Woodward: Fire Incidents, Oklahoma (OK)
Where are fire incidents reported in Woodward, OK
Something went wrong! Please refresh the page.
| Fire incidents reported | |
|---|---|
| Sreet name | Count |
| OKLAHOMA AVE | 104 |
| WILLIAMS AVE | 66 |
| MADISON AVE | 44 |
| HANKS TRL | 42 |
| WEBSTER AVE | 30 |
| 22ND ST | 26 |
| 1ST ST | 22 |
| 22ND. ST | 22 |
| 48TH ST | 22 |
| KANSAS | 22 |
| MAIN AVE | 22 |
| 11TH ST | 20 |
| 9TH ST | 20 |
| DOWNS AVE | 20 |
| 22ND | 18 |
| 6TH ST | 18 |
| 8TH | 18 |
| WEBSTER | 18 |
| 17TH ST | 16 |
| 1ST | 16 |
| 48TH. ST | 16 |
| 4TH ST | 16 |
| 9TH | 16 |
| OAK AVE | 16 |
| TEXAS AVE | 16 |
| 13TH | 14 |
| 13TH ST | 14 |
| 5TH ST | 14 |
| 7TH ST | 14 |
| 8TH ST | 14 |
| Other | 1,614 |
2006 - 2018 National Fire Incident Reporting System (NFIRS) incidents
- Incident types reported to NFIRS in Woodward, OK
- 4,48250.2%Rescue & EMS
- 2,35026.3%Fire
- 8329.3%Hazardous Condition
- 6026.7%Good Intent Call
- 3634.1%False Alarm
- 2673.0%Service Call
- 180.2%Overpressure Rupture
- 90.1%Severe Weather
- Fire incident types reported to NFIRS in Woodward, OK
- 1,55066.0%Outside Fires
- 38616.4%Structure Fires
- 2239.5%Mobile Property/Vehicle Fires
- 1918.1%Other
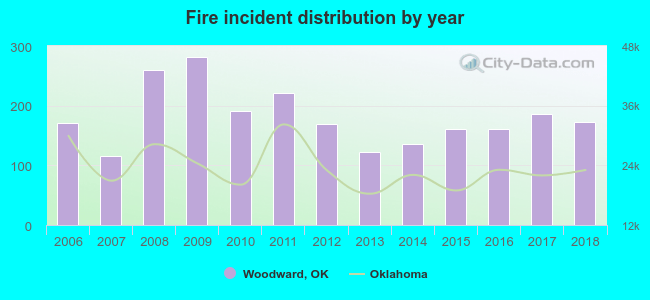 According to the data from the years 2006 - 2018 the average number of fire incidents per year is 181. The highest number of fire incidents - 282 took place in 2009, and the least - 116 in 2007. The data has a rising trend.
 The median response time based on all reported fire incidents is 9 minutes. This is higher compared to the state median value.
The median response time in Woodward, OK compared to nearest cities:
(Note: Based on data for all years, including only cities with at least 500 fire incidents)
| Woodward: | 9 minutes |
| Mooreland: | 0 minutes |
| Seiling: | 10 minutes |
| Alva: | 8 minutes |
| Fairview: | 11 minutes |
| Ashland: | 13 minutes |
| Thomas: | 8 minutes |
| Clinton: | 5 minutes |
| Watonga: | 11 minutes |
 Based on the data from the years 2006 - 2018 the average number of fire-related casualties per year is 0. The highest number of injuries - 2 took place in 2018, and the lowest - 0 in 2006. The data has a growing trend.
The average number of injuries per 1,000 fire incidents is 2. This indicator was the highest - 12 in 2018, and the lowest 0 in 2006. The trend for casualties per 1,000 fires is growing. Compared to the Oklahoma value the number of injuries per 1,000 fires is much lower.
Based on the data from the years 2006 - 2018 the average number of fire-related casualties per year is 0. The highest number of injuries - 2 took place in 2018, and the lowest - 0 in 2006. The data has a growing trend.
The average number of injuries per 1,000 fire incidents is 2. This indicator was the highest - 12 in 2018, and the lowest 0 in 2006. The trend for casualties per 1,000 fires is growing. Compared to the Oklahoma value the number of injuries per 1,000 fires is much lower.
 24.9% incidents where reported in the morning and 75.1% in the evening. The most fires (14.6%) took place on Saturday, and the least (14.0%) on Thursday.
 According to the 2,350 fires from years 2006 - 2018 most fires (14.8%) took place during March, and the least (4.9%) in September.
 Out of all 8,931 cases reported during the years 2006 - 2018, the most belonged to the categories: Rescue & EMS (50.2%), Fire (26.3%), and Hazardous Condition (9.3%).
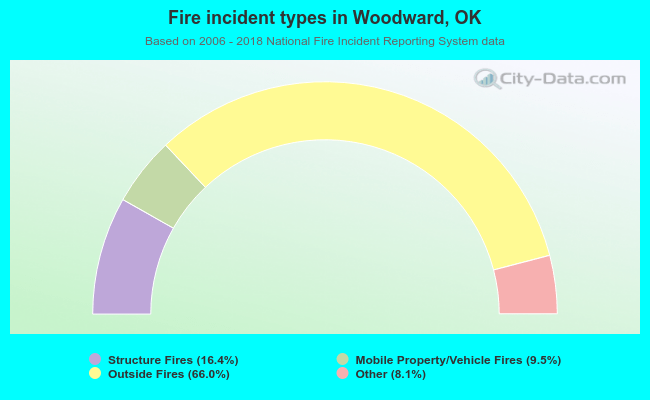 When looking into fire subcategories, the most reports belonged to: Outside Fires (66.0%), and Structure Fires (16.4%).