Woonsocket: Fire Incidents, Rhode Island (RI)
Where are fire incidents reported in Woonsocket, RI
Something went wrong! Please refresh the page.
| Fire incidents reported | |
|---|---|
| Sreet name | Count |
| DIAMOND HILL RD | 70 |
| FRONT ST | 62 |
| SOCIAL | 60 |
| DIAMOND HILL RD | 52 |
| MAIN ST | 50 |
| SCHOOL ST | 46 |
| CASS AV | 42 |
| MANVILLE RD | 42 |
| RATHBUN | 42 |
| SECOND AVE | 42 |
| VILLAGE RD | 40 |
| EAST SCHOOL | 38 |
| FRONT | 38 |
| SOCIAL ST | 38 |
| PARK AV | 34 |
| BLACKSTONE ST | 32 |
| PARK AVE | 32 |
| VILLAGE RD | 32 |
| RATHBUN ST | 28 |
| MANVILLE RD | 26 |
| CLINTON ST | 24 |
| SECOND AV | 24 |
| BERNON ST | 22 |
| BOURDON BLVD | 22 |
| BURNSIDE AV | 22 |
| CLINTON | 22 |
| CUMBERLAND HILL RD | 22 |
| FOURTH AV | 22 |
| SOUTH MAIN | 22 |
| BERNON | 20 |
| Other | 342 |
2008 - 2018 National Fire Incident Reporting System (NFIRS) incidents
- Incident types reported to NFIRS in Woonsocket, RI
- 24,03870.9%Rescue & EMS
- 4,77914.1%False Alarm
- 1,4664.3%Hazardous Condition
- 1,4214.2%Service Call
- 1,4104.2%Fire
- 7532.2%Good Intent Call
- 410.1%Overpressure Rupture
- Fire incident types reported to NFIRS in Woonsocket, RI
- 90163.9%Structure Fires
- 33824.0%Outside Fires
- 1077.6%Mobile Property/Vehicle Fires
- 644.5%Other
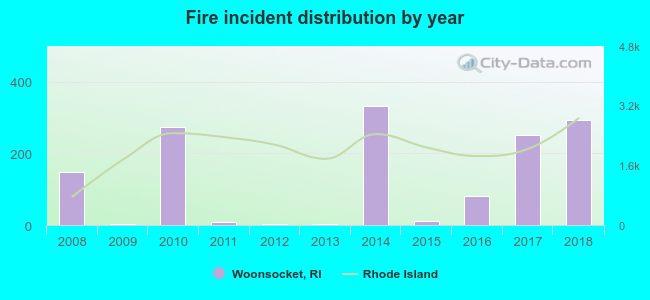 According to the data from the years 2008 - 2018 the average number of fire incidents per year is 128. The highest number of fire incidents - 333 took place in 2014, and the least - 2 in 2009. The data has a growing trend.
The average number of yearly fire incidents per 10k residents in Woonsocket, RI compared to nearest cities:
(Note: Based on data for the last 3 years, including only cities with population 5,000 and above)
| Woonsocket: | 50.6 |
| North Smithfield: | 12.0 |
| Cumberland: | 39.7 |
| Lincoln: | 31.0 |
| Smithfield: | 27.7 |
| Central Falls: | 96.2 |
| Pawtucket: | 0.3 |
| Johnston: | 26.6 |
| Glocester: | 1.0 |
 The median response time based on all reported fire incidents is 5 minutes. This is similar to the Rhode Island median value.
The median response time in Woonsocket, RI compared to nearest cities:
(Note: Based on data for all years, including only cities with at least 500 fire incidents)
| Woonsocket: | 5 minutes |
| Blackstone: | 5 minutes |
| Cumberland: | 6 minutes |
| Lincoln: | 4 minutes |
| Bellingham: | 7 minutes |
| Franklin: | 6 minutes |
| Uxbridge: | 7 minutes |
| Smithfield: | 6 minutes |
| Wrentham: | 2 minutes |
 Based on the data from the years 2008 - 2018 the average number of fire-related casualties per year is 1. The highest number of casualties - 6 took place in 2008, and the lowest - 0 in 2009. The data has a declining trend.
The average number of casualties per 1,000 fire incidents is 6. This indicator was the highest - 41 in 2008, and the lowest 0 in 2009. The trend for injuries per 1,000 fires is decreasing. Compared to the Rhode Island value the number of injuries per 1,000 fires is similar.
Based on the data from the years 2008 - 2018 the average number of fire-related casualties per year is 1. The highest number of casualties - 6 took place in 2008, and the lowest - 0 in 2009. The data has a declining trend.
The average number of casualties per 1,000 fire incidents is 6. This indicator was the highest - 41 in 2008, and the lowest 0 in 2009. The trend for injuries per 1,000 fires is decreasing. Compared to the Rhode Island value the number of injuries per 1,000 fires is similar.Casualties per 1,000 incidents in Woonsocket, RI compared to nearest cities:
(Note: Based on data for all years, including only cities with at least 500 fire incidents)
| Woonsocket: | 9.9 |
| Blackstone: | 15.5 |
| Cumberland: | 7.6 |
| Lincoln: | 6.0 |
| Bellingham: | 12.0 |
| Franklin: | 3.0 |
| Uxbridge: | 24.6 |
| Smithfield: | 6.1 |
| Wrentham: | 0.0 |
 27.9% incidents where reported in the morning and 72.1% in the evening. The most fires (16.2%) took place on Saturday, and the least (11.6%) on Friday.
 According to the 1,410 fires from years 2008 - 2018 most fires (12.1%) took place during April, and the least (6.2%) in June.
 Out of all 33,926 cases reported during the years 2008 - 2018, the most belonged to the categories: Rescue & EMS (70.9%), False Alarm (14.1%), and Hazardous Condition (4.3%).
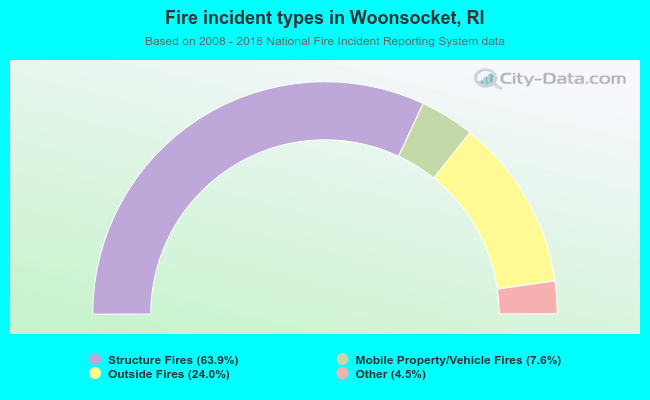 When looking into fire subcategories, the most reports belonged to: Structure Fires (63.9%), and Outside Fires (24.0%).