York: Fire Incidents, Pennsylvania (PA)
Where are fire incidents reported in York, PA
Something went wrong! Please refresh the page.
| Fire incidents reported | |
|---|---|
| Sreet name | Count |
| MARKET ST | 1,270 |
| PHILADELPHIA ST | 674 |
| GEORGE ST | 570 |
| KING ST | 506 |
| PRINCESS ST | 458 |
| QUEEN ST | 430 |
| COLLEGE AVE | 300 |
| POPLAR ST | 286 |
| DUKE ST | 264 |
| AAA OUT OF TOWNSHIP | 250 |
| RICHLAND AVE | 236 |
| COUNTRY CLUB RD | 228 |
| LOUCKS RD | 200 |
| PERSHING AVE | 196 |
| ROOSEVELT AVE | 188 |
| JACKSON ST | 176 |
| PROSPECT ST | 168 |
| KINGS MILL RD | 154 |
| BEAVER ST | 152 |
| SUSQUEHANNA TRL | 146 |
| CARLISLE RD | 138 |
| COTTAGE PL | 130 |
| PINE ST | 130 |
| WALNUT ST | 126 |
| NEWBERRY ST | 118 |
| EDEN RD | 116 |
| MAPLE ST | 114 |
| PENN ST | 110 |
| WEST ST | 110 |
| SHERMAN ST | 104 |
| Other | 2,407 |
2002 - 2018 National Fire Incident Reporting System (NFIRS) incidents
- Incident types reported to NFIRS in York, PA
- 12,59125.8%Hazardous Condition
- 10,45521.4%Fire
- 10,07520.7%Rescue & EMS
- 6,52713.4%Good Intent Call
- 6,34213.0%False Alarm
- 2,3654.8%Service Call
- 1990.4%Overpressure Rupture
- 1350.3%Special Incident
- 890.2%Severe Weather
- Fire incident types reported to NFIRS in York, PA
- 6,22059.5%Structure Fires
- 2,43123.3%Outside Fires
- 1,21811.6%Mobile Property/Vehicle Fires
- 5865.6%Other
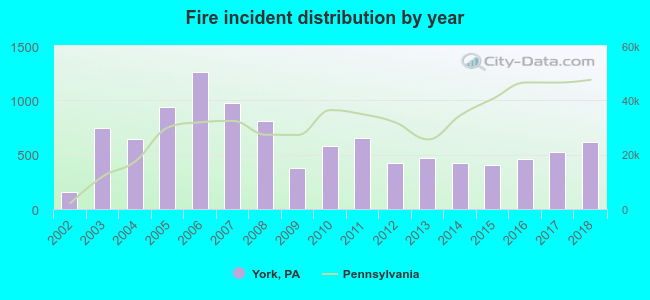 According to the data from the years 2002 - 2018 the average number of fires per year is 615. The highest number of fires - 1,257 took place in 2006, and the least - 161 in 2002. The data has an increasing trend.
The average number of yearly fire incidents per 10k residents in York, PA compared to nearest cities:
(Note: Based on data for the last 3 years, including only cities with population 5,000 and above)
| York: | 121.7 |
| Red Lion: | 68.0 |
| Columbia: | 89.6 |
| Elizabethtown: | 78.4 |
| Mount Joy: | 82.4 |
| Middletown: | 69.5 |
| Hanover: | 96.6 |
| Steelton: | 64.1 |
| New Cumberland: | 60.1 |
 The median response time based on all reported fire incidents is 4 minutes. This is lower than the state median value.
The median response time in York, PA compared to nearest cities:
(Note: Based on data for all years, including only cities with at least 500 fire incidents)
| York: | 4 minutes |
| Manchester: | 8 minutes |
| Dover: | 9 minutes |
| Red Lion: | 8 minutes |
| Spring Grove: | 10 minutes |
| Marietta: | 8 minutes |
| Wrightsville: | 9 minutes |
| Glen Rock: | 9 minutes |
| Columbia: | 6 minutes |
 Based on the reports from the years 2002 - 2018 the average number of fire-related fatalities per year is 1. The highest number of deaths - 7 took place in 2007, and the lowest - 0 in 2002. The data has a constant trend.
The average number of fatalities per 1,000 fire incidents is 1. This indicator was the highest - 7 in 2007, and the lowest 0 in 2002. The trend for deaths per 1,000 fires is constant. Compared to the state value the number of fatalities per 1,000 fire incidents is similar.
Based on the reports from the years 2002 - 2018 the average number of fire-related fatalities per year is 1. The highest number of deaths - 7 took place in 2007, and the lowest - 0 in 2002. The data has a constant trend.
The average number of fatalities per 1,000 fire incidents is 1. This indicator was the highest - 7 in 2007, and the lowest 0 in 2002. The trend for deaths per 1,000 fires is constant. Compared to the state value the number of fatalities per 1,000 fire incidents is similar.
 Based on the data from the years 2002 - 2018 the average number of fire-related casualties per year is 8. The highest number of reported injuries - 20 took place in 2006, and the lowest - 0 in 2013. The data has a rising trend.
The average number of casualties per 1,000 fires is 12. This indicator was the highest - 24 in 2009, and the lowest 0 in 2013. The trend for injuries per 1,000 fire incidents is growing. Compared to the Pennsylvania value the number of casualties per 1,000 fires is much higher.
Based on the data from the years 2002 - 2018 the average number of fire-related casualties per year is 8. The highest number of reported injuries - 20 took place in 2006, and the lowest - 0 in 2013. The data has a rising trend.
The average number of casualties per 1,000 fires is 12. This indicator was the highest - 24 in 2009, and the lowest 0 in 2013. The trend for injuries per 1,000 fire incidents is growing. Compared to the Pennsylvania value the number of casualties per 1,000 fires is much higher.Casualties per 1,000 incidents in York, PA compared to nearest cities:
(Note: Based on data for all years, including only cities with at least 500 fire incidents)
| York: | 12.9 |
| Manchester: | 3.8 |
| Dover: | 1.2 |
| Red Lion: | 0.0 |
| Spring Grove: | 2.3 |
| Marietta: | 0.0 |
| Wrightsville: | 0.0 |
| Glen Rock: | 5.0 |
| Columbia: | 2.5 |
 31.4% incidents where reported in the morning and 68.6% in the evening. The most fires (14.9%) took place on Saturday, and the least (13.8%) on Friday.
 According to the 10,455 reports from years 2002 - 2018 most fires (11.4%) took place during April, and the least (6.1%) in December.
 Out of all 48,778 cases reported during the years 2002 - 2018, the most belonged to the categories: Hazardous Condition (25.8%), Fire (21.4%), and Rescue & EMS (20.7%).
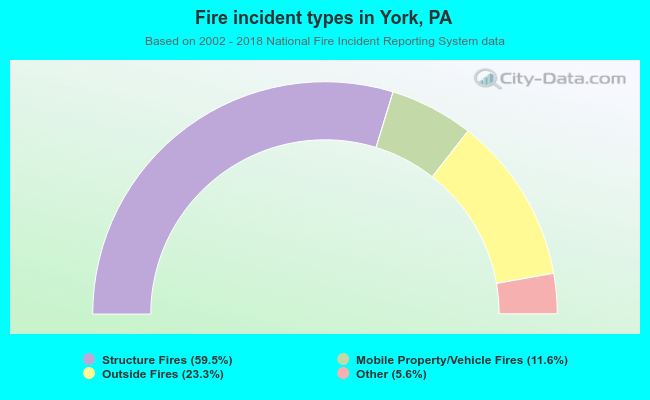 When looking into fire subcategories, the most incidents belonged to: Structure Fires (59.5%), and Outside Fires (23.3%).