Brookfield, WI (Wisconsin) Houses and Residents
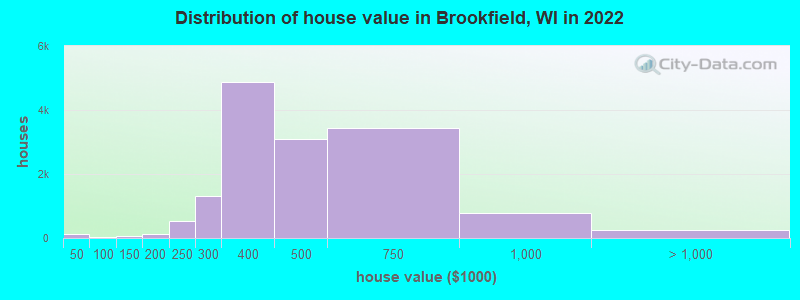
Estimated median house or condo value in 2022: $418,467 (it was $188,700 in 2000 )
Brookfield:
$418,467Wisconsin:
$252,800
Lower value quartile - upper value quartile: $343,709 - $547,542Mean price in 2022: Detached houses: $502,426 Here:
$502,426State:
$308,468
Townhouses or other attached units: $411,773 Here:
$411,773State:
$265,873
In 2-unit structures: $401,061 Here:
$401,061State:
$203,667
In 3-to-4-unit structures: $329,790 Here:
$329,790State:
$216,833
In 5-or-more-unit structures: $328,527 Here:
$328,527State:
$280,537
Total population: 37,982 (All urban)
Houses: 16,753 (16,310 occupied: 13,769 owner occupied, 2,714 renter occupied )
% of renters here:
16%State:
32%
Housing density: 616 houses/condos per square mile
Median price asked for vacant for-sale houses and condos in 2022: $252,423.
Median contract rent in 2022: $1,435 (lower quartile is $1,254, upper quartile is $1,863)
Median rent asked for vacant for-rent units in 2022: $1,908
Median gross rent in Brookfield, WI in 2022: $1,670
Housing units in Brookfield with a mortgage: 8,261 (1,083 second mortgage, 10 home equity loan, 1,023 both second mortgage and home equity loan )Houses without a mortgage: 853
Median household income for houses/condos with a mortgage: $143,772
Median household income for apartments without a mortgage: $100,756
Median monthly housing costs: $1,589
Data:
Median house or condo value ($)
Median house or condo value ($ change since 2000)
Median house or condo value ($) - White
Median house or condo value ($) - Black or African American
Median house or condo value ($) - Asian
Median house or condo value ($) - Hispanic or Latino
Median house or condo value ($) - American Indian and Alaska Native
Median house or condo value ($) - Multirace
Median house or condo value ($) - Other Race
Median price asked for mobile homes ($)
Household density (households per square mile)
Mean house or condo value by units in structure - 1, detached ($)
Mean house or condo value by units in structure - 1, attached ($)
Mean house or condo value by units in structure - 2 ($)
Mean house or condo value by units in structure by units in structure - 3 or 4 ($)
Mean house or condo value by units in structure - 5 or more ($)
Mean house or condo value by units in structure - Boat, RV, van, etc. ($)
Mean house or condo value by units in structure - Mobile home ($)
Median contract rent ($)
Median contract rent - Lower quartile ($)
Median contract rent - Upper quartile ($)
Median gross rent ($)
Urban houses (%)
Rural houses (%)
Houses occupied (%)
Houses occupied (% change since 2000)
Houses owner occupied (%)
Houses owner occupied (% change since 2000)
Houses renter occupied (%)
Houses renter occupied (% change since 2000)
Vacant housing units - For rent (%)
Vacant housing units - For rent (% change since 2000)
Vacant housing units - For sale only (%)
Vacant housing units - For sale only (% change since 2000)
Vacant housing units - Rented or sold, not occupied (%)
Vacant housing units - Rented or sold, not occupied (% change since 2000)
Vacant housing units - For seasonal, recreational, or occasional use (%)
Vacant housing units - For seasonal, recreational, or occasional use (% change since 2000)
Vacant housing units - For migrant workers (%)
Vacant housing units - For migrant workers (% change since 2000)
Vacant housing units - Other vacant (%)
Vacant housing units - Other vacant (% change since 2000)
Median monthly housing costs ($)
Median household income for houses/condos with a mortgage ($)
Median household income for houses/condos without a mortgage ($)
Median household income ($)
Median household income ($) - White
Median household income ($) - Black or African American
Median household income ($) - Asian
Median household income ($) - Hispanic or Latino
Median household income ($) - American Indian and Alaska Native
Median household income ($) - Multirace
Median household income ($) - Other Race
Mortgage status - with mortgage (%)
Mortgage status - with second mortgage (%)
Mortgage status - with home equity loan (%)
Mortgage status - with both second mortgage and home equity loan (%)
Mortgage status - without a mortgage (%)
Median year house/condo built
Median year apartment built
Household type by relationship - Male householder living alone (%)
Household type by relationship - Male householder not living alone (%)
Household type by relationship - Female householder living alone (%)
Household type by relationship - Female householder not living alone (%)
Household type by relationship - Opposite-Sex spouse (%)
Household type by relationship - Same-Sex spouse (%)
Household type by relationship - Opposite-Sex unmarried partner (%)
Household type by relationship - Same-Sex unmarried partner (%)
Household type by relationship - In group quarters (%)
Size of family households - 2-person household (%)
Size of family households - 3-person household (%)
Size of family households - 4-person household (%)
Size of family households - 5-person household (%)
Size of family households - 6-person household (%)
Size of family households - 7-or-more-person household (%)
Size of nonfamily households - 1-person household (%)
Size of nonfamily households - 2-person household (%)
Size of nonfamily households - 3-person household (%)
Size of nonfamily households - 4-person household (%)
Size of nonfamily households - 5-person household (%)
Size of nonfamily households - 6-person household (%)
Size of nonfamily households - 7-or-moreperson household (%)
Year house built - Built 2010 or later (%)
Year house built - Built 2000 to 2009 (%)
Year house built - Built 1990 to 1999 (%)
Year house built - Built 1980 to 1989 (%)
Year house built - Built 1970 to 1979 (%)
Year house built - Built 1960 to 1969 (%)
Year house built - Built 1950 to 1959 (%)
Year house built - Built 1940 to 1949 (%)
Year house built - Built 1939 or earlier (%)
Median number of rooms in houses and condos
Median number of rooms in apartments
Median number of bedrooms in owner occupied houses
Mean number of bedrooms in owner occupied houses
Median number of bedrooms in renter occupied houses
Mean number of bedrooms in renter occupied houses
Median number of vehichles in owner occupied houses
Mean number of vehichles in owner occupied houses
Median number of vehichles in renter occupied houses
Mean number of vehichles in renter occupied houses
Rooms in owner-occupied houses - 1 room (%)
Rooms in owner-occupied houses - 2 rooms (%)
Rooms in owner-occupied houses - 3 rooms (%)
Rooms in owner-occupied houses - 4 rooms (%)
Rooms in owner-occupied houses - 5 rooms (%)
Rooms in owner-occupied houses - 6 rooms (%)
Rooms in owner-occupied houses - 7 rooms (%)
Rooms in owner-occupied houses - 8 rooms (%)
Rooms in owner-occupied houses - 9+ rooms (%)
Rooms in renter-occupied houses - 1 room (%)
Rooms in renter-occupied houses - 2 rooms (%)
Rooms in renter-occupied houses - 3 rooms (%)
Rooms in renter-occupied houses - 4 rooms (%)
Rooms in renter-occupied houses - 5 rooms (%)
Rooms in renter-occupied houses - 6 rooms (%)
Rooms in renter-occupied houses - 7 rooms (%)
Rooms in renter-occupied houses - 8 rooms (%)
Rooms in renter-occupied houses - 9+ rooms (%)
Bedrooms in owner-occupied houses - no bedrooms (%)
Bedrooms in owner-occupied houses - 1 bedroom (%)
Bedrooms in owner-occupied houses - 2 bedrooms (%)
Bedrooms in owner-occupied houses - 3 bedrooms (%)
Bedrooms in owner-occupied houses - 4 bedrooms (%)
Bedrooms in owner-occupied houses - 5+ bedrooms (%)
Bedrooms in renter-occupied houses - no bedrooms (%)
Bedrooms in renter-occupied houses - 1 bedroom (%)
Bedrooms in renter-occupied houses - 2 bedrooms (%)
Bedrooms in renter-occupied houses - 3 bedrooms (%)
Bedrooms in renter-occupied houses - 4 bedrooms (%)
Bedrooms in renter-occupied houses - 5+ bedrooms (%)
Vehicles available in owner-occupied houses - no vehicle available (%)
Vehicles available in owner-occupied houses - 1 vehicle available(%)
Vehicles available in owner-occupied houses - 2 Vehicles available (%)
Vehicles available in owner-occupied houses - 3 Vehicles available (%)
Vehicles available in owner-occupied houses - 4 Vehicles available (%)
Vehicles available in owner-occupied houses - 5+ Vehicles available (%)
Vehicles available in renter-occupied houses - no vehicle available (%)
Vehicles available in renter-occupied houses - 1 vehicle available (%)
Vehicles available in renter-occupied houses - 2 Vehicles available (%)
Vehicles available in renter-occupied houses - 3 Vehicles available (%)
Vehicles available in renter-occupied houses - 4 Vehicles available (%)
Vehicles available in renter-occupied houses - 5+ Vehicles available (%)
Housing units in structures - 1, detached (%)
Housing units in structures - 1, attached (%)
Housing units in structures - 2 (%)
Housing units in structures - 3 or 4 (%)
Housing units in structures - 5 to 9 (%)
Housing units in structures - 10 to 19 (%)
Housing units in structures - 20 to 49 (%)
Housing units in structures - 50 or more (%)
Housing units in structures - Mobile home (%)
Housing units in structures - Boat, RV, van, etc. (%)
Housing units in structures - Owners - 1, detached (%)
Housing units in structures - Owners - 1, attached (%)
Housing units in structures - Owners - 2 (%)
Housing units in structures - Owners - 3 or 4 (%)
Housing units in structures - Owners - 5 to 9 (%)
Housing units in structures - Owners - 10 to 19 (%)
Housing units in structures - Owners - 20 to 49 (%)
Housing units in structures - Owners - 50 or more (%)
Housing units in structures - Owners - Mobile home (%)
Housing units in structures - Owners - Boat, RV, van, etc. (%)
Housing units in structures - Renters - 1, detached (%)
Housing units in structures - Renters - 1, attached (%)
Housing units in structures - Renters - 2 (%)
Housing units in structures - Renters - 3 or 4 (%)
Housing units in structures - Renters - 5 to 9 (%)
Housing units in structures - Renters - 10 to 19 (%)
Housing units in structures - Renters - 20 to 49 (%)
Housing units in structures - Renters - 50 or more (%)
Housing units in structures - Renters - Mobile home (%)
Housing units in structures - Renters - Boat, RV, van, etc. (%)
House/condo owner moved in on average (years ago)
Renter moved in on average (years ago)
Year householder moved into unit - Moved in 1999 to March 2000 (%)
Year householder moved into unit - Moved in 1999 to March 2000 (%) - White
Year householder moved into unit - Moved in 1999 to March 2000 (%) - Black or African American
Year householder moved into unit - Moved in 1999 to March 2000 (%) - Asian
Year householder moved into unit - Moved in 1999 to March 2000 (%) - Hispanic or Latino
Year householder moved into unit - Moved in 1999 to March 2000 (%) - American Indian and Alaska Native
Year householder moved into unit - Moved in 1999 to March 2000 (%) - Multirace
Year householder moved into unit - Moved in 1999 to March 2000 (%) - Other Race
Year householder moved into unit - Moved in 1995 to 1998 (%)
Year householder moved into unit - Moved in 1995 to 1998 (%) - White
Year householder moved into unit - Moved in 1995 to 1998 (%) - Black or African American
Year householder moved into unit - Moved in 1995 to 1998 (%) - Asian
Year householder moved into unit - Moved in 1995 to 1998 (%) - Hispanic or Latino
Year householder moved into unit - Moved in 1995 to 1998 (%) - American Indian and Alaska Native
Year householder moved into unit - Moved in 1995 to 1998 (%) - Multirace
Year householder moved into unit - Moved in 1995 to 1998 (%) - Other Race
Year householder moved into unit - Moved in 1990 to 1994 (%)
Year householder moved into unit - Moved in 1990 to 1994 (%) - White
Year householder moved into unit - Moved in 1990 to 1994 (%) - Black or African American
Year householder moved into unit - Moved in 1990 to 1994 (%) - Asian
Year householder moved into unit - Moved in 1990 to 1994 (%) - Hispanic or Latino
Year householder moved into unit - Moved in 1990 to 1994 (%) - American Indian and Alaska Native
Year householder moved into unit - Moved in 1990 to 1994 (%) - Multirace
Year householder moved into unit - Moved in 1990 to 1994 (%) - Other Race
Year householder moved into unit - Moved in 1980 to 1989 (%)
Year householder moved into unit - Moved in 1980 to 1989 (%) - White
Year householder moved into unit - Moved in 1980 to 1989 (%) - Black or African American
Year householder moved into unit - Moved in 1980 to 1989 (%) - Asian
Year householder moved into unit - Moved in 1980 to 1989 (%) - Hispanic or Latino
Year householder moved into unit - Moved in 1980 to 1989 (%) - American Indian and Alaska Native
Year householder moved into unit - Moved in 1980 to 1989 (%) - Multirace
Year householder moved into unit - Moved in 1980 to 1989 (%) - Other Race
Year householder moved into unit - Moved in 1970 to 1979 (%)
Year householder moved into unit - Moved in 1970 to 1979 (%) - White
Year householder moved into unit - Moved in 1970 to 1979 (%) - Black or African American
Year householder moved into unit - Moved in 1970 to 1979 (%) - Asian
Year householder moved into unit - Moved in 1970 to 1979 (%) - Hispanic or Latino
Year householder moved into unit - Moved in 1970 to 1979 (%) - American Indian and Alaska Native
Year householder moved into unit - Moved in 1970 to 1979 (%) - Multirace
Year householder moved into unit - Moved in 1970 to 1979 (%) - Other Race
Year householder moved into unit - Moved in 1969 or earlier (%)
Year householder moved into unit - Moved in 1969 or earlier (%) - White
Year householder moved into unit - Moved in 1969 or earlier (%) - Black or African American
Year householder moved into unit - Moved in 1969 or earlier (%) - Asian
Year householder moved into unit - Moved in 1969 or earlier (%) - Hispanic or Latino
Year householder moved into unit - Moved in 1969 or earlier (%) - American Indian and Alaska Native
Year householder moved into unit - Moved in 1969 or earlier (%) - Multirace
Year householder moved into unit - Moved in 1969 or earlier (%) - Other Race
Housing units lacking complete plumbing facilities (%)
Housing units lacking complete kitchen facilities (%)
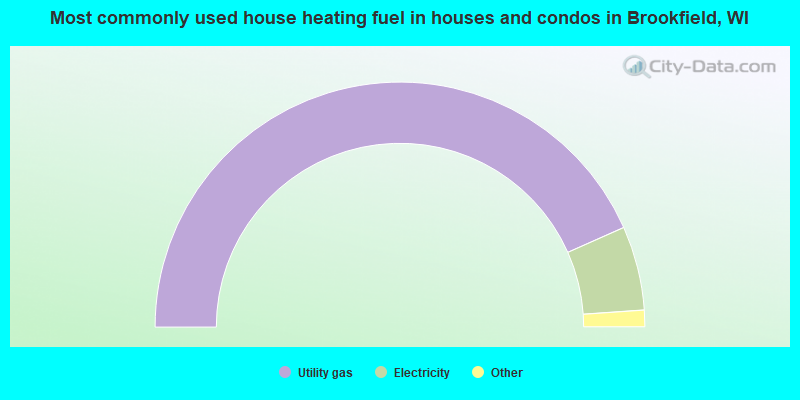
House heating fuel used in houses and condos - Utility gas (%)
House heating fuel used in houses and condos - Bottled, tank, or LP gas (%)
House heating fuel used in houses and condos - Electricity (%)
House heating fuel used in houses and condos - Fuel oil, kerosene, etc. (%)
House heating fuel used in houses and condos - Coal or coke (%)
House heating fuel used in houses and condos - Wood (%)
House heating fuel used in houses and condos - Solar energy (%)
House heating fuel used in houses and condos - Other fuel (%)
House heating fuel used in houses and condos - No fuel used (%)
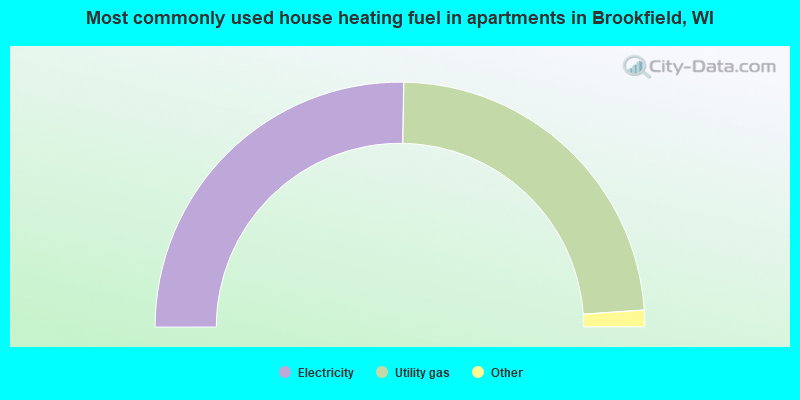
House heating fuel used in apartments - Utility gas (%)
House heating fuel used in apartments - Bottled, tank, or LP gas (%)
House heating fuel used in apartments - Electricity (%)
House heating fuel used in apartments - Fuel oil, kerosene, etc. (%)
House heating fuel used in apartments - Coal or coke (%)
House heating fuel used in apartments - Wood (%)
House heating fuel used in apartments - Solar energy (%)
House heating fuel used in apartments - Other fuel (%)
House heating fuel used in apartments - No fuel used (%)
Latest news about housing in Brookfield, WI collected exclusively by city-data.com from local newspapers, TV, and radio stations
Median year house/condo built: 1970Median year apartment built: 1994Household type by relationship:
Households: 41,661
Male householders: 9,178 (1,683 living alone ), Female householders: 7,005 (2,135 living alone )10,453 spouses (10,406 opposite-sex spouses ), 724 unmarried partners , (716 opposite-sex unmarried partners ), 12,741 children (12,110 natural , 273 adopted , 357 stepchildren ), 195 grandchildren , 96 brothers or sisters , 249 parents , 0 foster children , 120 other relatives , 456 non-relatives In group quarters: 438
Size of family households: 5,620 2-persons , 2,110 3-persons , 2,611 4-persons , 1,015 5-persons , 194 6-persons , 98 7-or-more-persons .
Size of nonfamily households: 4,068 1-person , 566 2-persons , 150 3-persons , 7 5-persons .
8,283 married couples with children. single-parent households (238 men , 679 women ).
86.2% of residents of Brookfield speak English at home. of residents speak Spanish at home (82% speak English very well , 17% speak English well ).of residents speak other Indo-European language at home (86% speak English very well , 12% speak English well , 1% speak English not well , 1% don't speak English at all ).of residents speak Asian or Pacific Island language at home (73% speak English very well , 19% speak English well , 7% speak English not well ).of residents speak other language at home (88% speak English very well , 7% speak English well , 6% speak English not well ).
Foreign born population: 4,674 (11.2%)of them are naturalized citizens )
Median number of rooms in houses and condos:
Median number of rooms in apartments
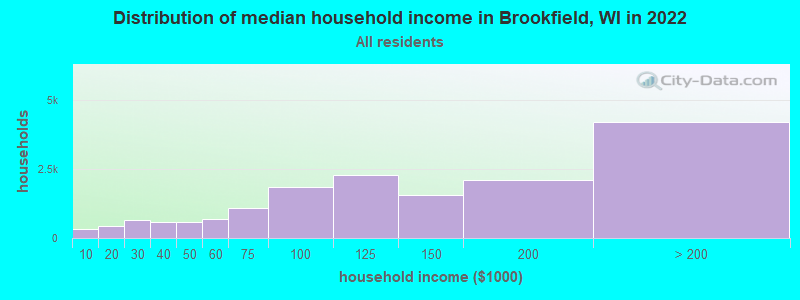
Brookfield, WI household income distribution 317 Less than $10,000419 $10,000 to $19,999640 $20,000 to $29,999566 $30,000 to $39,999593 $40,000 to $49,999672 $50,000 to $59,9991,072 $60,000 to $74,9991,849 $75,000 to $99,9992,273 $100,000 to $124,9991,554 $125,000 to $149,9992,088 $150,000 to $199,9994,202 $200,000 or more
Home value of owner - occupied houses in 2022 in Brookfield, WI 23 Less than $10,0007 $10,000 to $14,99920 $20,000 to $24,99958 $25,000 to $29,9994 $40,000 to $49,99910 $50,000 to $59,99923 $60,000 to $69,99936 $100,000 to $124,99919 $125,000 to $149,99957 $150,000 to $174,99977 $175,000 to $199,999546 $200,000 to $249,9991,298 $250,000 to $299,9994,887 $300,000 to $399,9993,091 $400,000 to $499,9993,425 $500,000 to $749,999783 $750,000 to $999,999164 $1,000,000 to $1,499,99968 $1,500,000 to $1,999,9998 $2,000,000 or moreRent paid by renters in 2022 in Brookfield, WI 76 $450 to $4999 $700 to $74938 $750 to $79940 $800 to $899135 $900 to $999292 $1,000 to $1,249875 $1,250 to $1,499578 $1,500 to $1,999414 $2,000 to $2,499117 $2,500 to $2,99928 $3,000 to $3,49922 No cash rent
Percentage of workers working in this county: 61.8%Number of people working at home: 3,885 (19.3% of all workers )
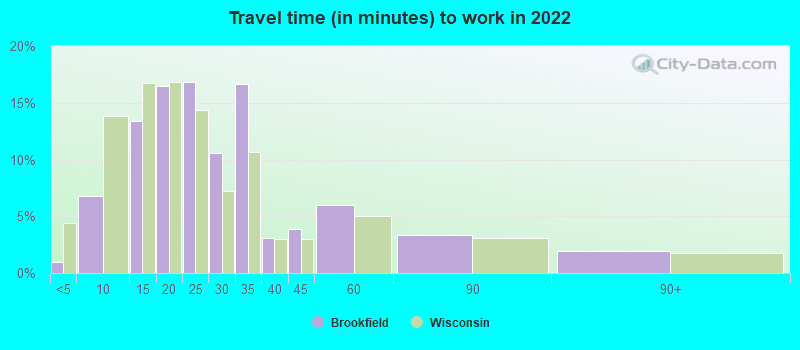
Travel time to work (commute)
Less than 5 minutes: 2795 to 9 minutes: 1,46410 to 14 minutes: 3,37515 to 19 minutes: 3,19920 to 24 minutes: 2,89125 to 29 minutes: 1,61230 to 34 minutes: 1,61335 to 39 minutes: 67640 to 44 minutes: 44445 to 59 minutes: 37260 to 89 minutes: 23590 or more minutes: 258
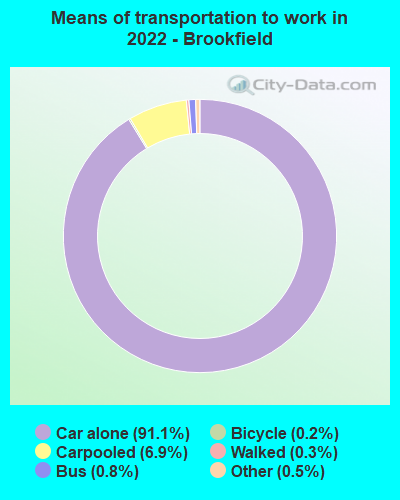
Means of transportation to work:
Drove a car alone: 29,211 (80.8%)Carpooled: 2,437 (6.7%)Bus : 137 (0.4%)Subway or elevated rail : 45 (0.1%)Long-distance train or commuter rail : 2 (0.0%)Taxi: 209 (0.6%)Bicycle: 75 (0.2%)Walked: 73 (0.2%)Worked at home: 3,885 (10.8%)
Unemployment by race in 2022
Unemployment rate for White non-Hispanic residents 2.1% Males3.0% FemalesUnemployment rate for Black residents 26.9% MalesUnemployment rate for Asian residents 0.6% FemalesUnemployment rate for two or more race residents 10.9% Males0.7% FemalesUnemployment rate for Hispanic or Latino residents 6.1% Males
Year of entry for the foreign-born population in Brookfield, Wisconsin
1,952 2010 or later 1,071 2000 to 2009 596 1990 to 1999 305 1980 to 1989 492 1970 to 1979 1,043 Before 1970
First ancestries reported:
German: 5,183 (28.8%)
American: 1,075 (6.0%)
Polish: 908 (5.0%)
Irish: 893 (5.0%)
European: 831 (4.6%)
Italian: 721 (4.0%)
English: 477 (2.6%)
Norwegian: 376 (2.1%)
Greek: 313 (1.7%)
Swedish: 158 (0.9%)
Dutch: 154 (0.9%)
Swiss: 126 (0.7%)
Ukrainian: 110 (0.6%)
Syrian: 94 (0.5%)
Hungarian: 71 (0.4%)
Slovak: 71 (0.4%)
Eastern European: 70 (0.4%)
Scandinavian: 70 (0.4%)
Iranian: 69 (0.4%)
Scottish: 69 (0.4%)
French Canadian: 61 (0.3%)
Austrian: 56 (0.3%)
Arab: 52 (0.3%)
Czech: 48 (0.3%)
Russian: 46 (0.3%)
Welsh: 45 (0.2%)
Latvian: 44 (0.2%)
Finnish: 42 (0.2%)
Luxembourger: 41 (0.2%)
French: 39 (0.2%)
Northern European: 37 (0.2%)
Danish: 37 (0.2%)
Macedonian: 34 (0.2%)
Scotch-Irish: 32 (0.2%)
Slavic: 31 (0.2%)
Belgian: 30 (0.2%)
Czechoslovakian: 30 (0.2%)
Jamaican: 29 (0.2%)
British: 26 (0.1%)
Slovene: 25 (0.1%)
Canadian: 23 (0.1%)
Armenian: 22 (0.1%)
Brazilian: 17 (0.09%)
Croatian: 16 (0.09%)
Portuguese: 16 (0.09%)
Lebanese: 15 (0.08%)
Turkish: 14 (0.08%)
Israeli: 13 (0.07%)
Palestinian: 12 (0.07%)
Jordanian: 12 (0.07%)
Romanian: 9 (0.05%)
Serbian: 7 (0.04%)
Lithuanian: 1 (0.01%)
Most common places of birth for foreign-born residents (%): India Brookfield:
33.3% (1,568)Wisconsin:
8.0% (23,594)
China, excluding Hong Kong and Taiwan Brookfield:
14.0% (660)Wisconsin:
5.1% (15,165)
Korea Brookfield:
5.8% (274)Wisconsin:
1.8% (5,320)
Pakistan Brookfield:
3.2% (150)Wisconsin:
0.9% (2,757)
Vietnam Brookfield:
3.0% (140)Wisconsin:
1.5% (4,400)
Hong Kong Brookfield:
3.0% (139)Wisconsin:
0.2% (645)
Greece Brookfield:
2.4% (112)Wisconsin:
0.3% (843)
Taiwan Brookfield:
2.2% (105)Wisconsin:
0.7% (1,987)
Italy Brookfield:
2.2% (103)Wisconsin:
0.7% (2,099)
Japan Brookfield:
2.1% (97)Wisconsin:
0.7% (1,981)
Germany Brookfield:
1.8% (86)Wisconsin:
3.0% (8,773)
Kuwait Brookfield:
1.7% (82)Wisconsin:
0.2% (500)
Mexico Brookfield:
1.7% (81)Wisconsin:
29.5% (87,182)
Ukraine Brookfield:
1.5% (72)Wisconsin:
0.7% (2,177)
Place of birth for U.S.-born residents:
This state: 27,092Other state: 9,627Northeast: 1,197Midwest: 6,173South: 1,277West: 957 89.7% of Brookfield residents lived in the same house 1 years ago.
Out of people who lived in different houses, 29.1% lived in this county.
Out of people who lived in different counties, 60.2% lived in Wisconsin.
Brookfield:
89.7%State average:
87.7%
Education attainment for males 25 years and older:
No schooling: 62Nursery to 4th grade: 05th and 6th grade: 107th and 8th grade: 99th grade: 710th grade: 6111th grade: 612th grade, no diploma: 108High school graduate (or equivalency): 1,845Less than 1 year of college: 615Some college more than 1 year, no degree: 1,235Associate degree: 1,255Bachelor's degree: 5,285Master's degree: 2,937Professional school degree: 886Doctorate degree: 536
Education attainment for females 25 years and older:
No schooling: 77Nursery to 4th grade: 245th and 6th grade: 127th and 8th grade: 209th grade: 010th grade: 3611th grade: 3912th grade, no diploma: 94High school graduate (or equivalency): 2,072Less than 1 year of college: 794Some college more than 1 year, no degree: 1,251Associate degree: 1,105Bachelor's degree: 5,269Master's degree: 2,887Professional school degree: 924Doctorate degree: 506
Housing units in structures:
One, detached: 12,610One, attached: 1,314Two: 1333 or 4: 2445 to 9: 55410 to 19: 32420 to 49: 45850 or more: 1,019Mobile homes: 93Housing units lacking complete plumbing facilities in 2022: 0.4%Housing units lacking complete kitchen facilities in 2022: 0.8%House/condo owner moved in on average 12 years ago
Renter moved in on average 0 years ago
Private vs. public school enrollment:
Students in private schools in grades 1 to 8 (elementary and middle school): 711 Here:
15.9%Wisconsin:
16.7%
Students in private schools in grades 9 to 12 (high school): 289 Here:
11.4%Wisconsin:
12.5%
Students in private undergraduate colleges: 347 Here:
19.8%Wisconsin:
17.5%