Housing density: 2,905 houses/condos per square mile
Median price asked for vacant for-sale houses and condos in 2022: $836,677.
Median contract rent in 2022: $1,727 (lower quartile is $1,411, upper quartile is over $2,000)
Median rent asked for vacant for-rent units in 2022: $1,231
Median gross rent in Downey, CA in 2022: $1,849
Housing units in Downey with a mortgage: 13,024 (1,147 second mortgage, 0 home equity loan, 1,054 both second mortgage and home equity loan) Houses without a mortgage: 353
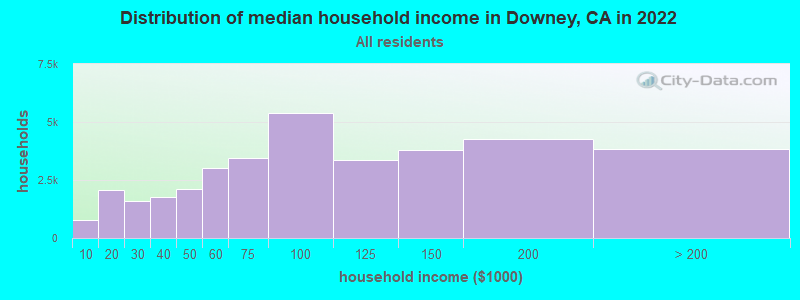
Median household income for houses/condos with a mortgage: $111,391
Median household income for apartments without a mortgage: $89,094
11,791 married couples with children.
8,756 single-parent households (4,697 men, 4,059 women).
35.6% of residents of Downey speak English at home.
55.8% of residents speak Spanish at home (68% speak English very well, 16% speak English well, 12% speak English not well, 4% don't speak English at all).
2.0% of residents speak other Indo-European language at home (58% speak English very well, 24% speak English well, 14% speak English not well, 3% don't speak English at all).
5.0% of residents speak Asian or Pacific Island language at home (54% speak English very well, 26% speak English well, 19% speak English not well, 2% don't speak English at all).
1.1% of residents speak other language at home (67% speak English very well, 22% speak English well, 7% speak English not well, 3% don't speak English at all).
Foreign born population: 35,705 (32.5%)
(63.6% of them are naturalized citizens)
Percentage of workers working in this county: 91.1% Number of people working at home: 6,502 (11.3% of all workers)
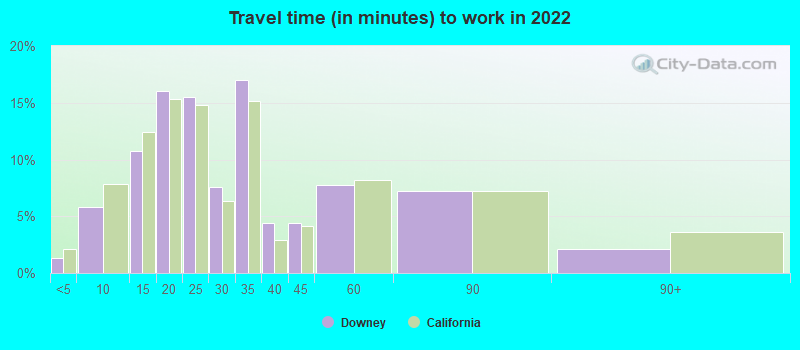
Travel time to work (commute)
Less than 5 minutes: 262
5 to 9 minutes: 2,559
10 to 14 minutes: 4,894
15 to 19 minutes: 7,087
20 to 24 minutes: 7,849
25 to 29 minutes: 3,782
30 to 34 minutes: 10,231
35 to 39 minutes: 1,417
40 to 44 minutes: 1,501
45 to 59 minutes: 6,006
60 to 89 minutes: 4,337
90 or more minutes: 980
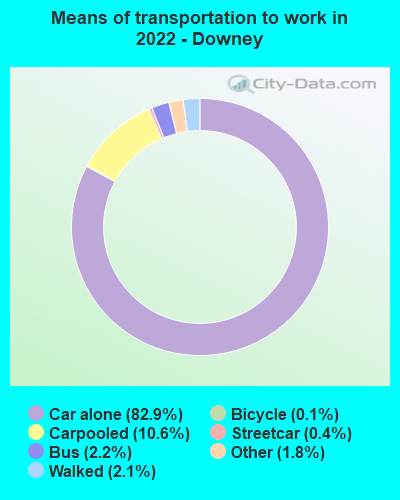
Means of transportation to work:
Drove a car alone: 36,604 (72.2%)
Carpooled: 4,682 (9.2%)
Bus: 960 (1.9%)
Subway or elevated rail: 155 (0.3%)
Taxi: 780 (1.5%)
Bicycle: 48 (0.1%)
Walked: 932 (1.8%)
Worked at home: 6,502 (12.8%)
Unemployment by race in 2022
Unemployment rate for White non-Hispanic residents
2.4%Females
Unemployment rate for Black residents
6.4%Males
7.6%Females
Unemployment rate for American Indian and Alaska Native residents
1.0%Males
Unemployment rate for Asian residents
2.2%Males
Unemployment rate for other race residents
6.9%Males
3.5%Females
Unemployment rate for two or more race residents
2.0%Males
3.9%Females
Unemployment rate for Hispanic or Latino residents
5.5%Males
3.3%Females
Year of entry for the foreign-born population in Downey, California
4,3072010 or later
4,8112000 to 2009
5,2591990 to 1999
12,3481980 to 1989
9,8341970 to 1979
6,053Before 1970
First ancestries reported:
American: 1,638 (2.2%)
English: 709 (1.0%)
Italian: 658 (0.9%)
German: 625 (0.8%)
Greek: 395 (0.5%)
Egyptian: 373 (0.5%)
Lebanese: 336 (0.5%)
Armenian: 322 (0.4%)
European: 321 (0.4%)
Irish: 306 (0.4%)
French Canadian: 195 (0.3%)
Belizean: 186 (0.2%)
Romanian: 169 (0.2%)
Jordanian: 142 (0.2%)
Polish: 140 (0.2%)
Norwegian: 118 (0.2%)
French: 111 (0.1%)
Scottish: 107 (0.1%)
Nigerian: 76 (0.1%)
Kenyan: 75 (0.1%)
Russian: 72 (0.10%)
Brazilian: 61 (0.08%)
Scandinavian: 61 (0.08%)
Ghanaian: 60 (0.08%)
Portuguese: 48 (0.06%)
Scotch-Irish: 47 (0.06%)
African: 46 (0.06%)
Palestinian: 38 (0.05%)
Iranian: 36 (0.05%)
Hungarian: 36 (0.05%)
Czech: 30 (0.04%)
Eastern European: 28 (0.04%)
Dutch: 26 (0.03%)
British: 23 (0.03%)
Croatian: 22 (0.03%)
Danish: 20 (0.03%)
Syrian: 18 (0.02%)
Jamaican: 17 (0.02%)
Trinidadian and Tobagonian: 13 (0.02%)
Yugoslavian: 12 (0.02%)
Basque: 11 (0.01%)
Iraqi: 11 (0.01%)
Ethiopian: 8 (0.01%)
Swedish: 8 (0.01%)
Canadian: 7 (0.01%)
Northern European: 6 (0.01%)
Somali: 6 (0.01%)
Swiss: 4 (0.01%)
Slovak: 4 (0.01%)
Most common places of birth for foreign-born residents (%):
Mexico
Downey:
52.1% (18,105)
California:
37.2% (3,881,193)
El Salvador
Downey:
6.8% (2,370)
California:
4.2% (440,287)
Philippines
Downey:
6.1% (2,120)
California:
7.8% (818,297)
Guatemala
Downey:
5.9% (2,042)
California:
2.8% (290,436)
Korea
Downey:
3.9% (1,357)
California:
3.0% (315,248)
Cuba
Downey:
2.4% (825)
California:
0.3% (30,441)
India
Downey:
2.0% (701)
California:
5.2% (539,184)
Peru
Downey:
1.8% (631)
California:
0.7% (74,025)
Place of birth for U.S.-born residents:
This state: 67,745
Other state: 5,255
Northeast: 1,364
Midwest: 1,509
South: 1,100
West: 1,282
93.0% of Downey residents lived in the same house 1 years ago. Out of people who lived in different houses, 44.3% lived in this county. Out of people who lived in different counties, 76.8% lived in California.
Downey:
93.0%
State average:
88.9%
Education attainment for males 25 years and older:
No schooling: 2,006
Nursery to 4th grade: 330
5th and 6th grade: 1,053
7th and 8th grade: 650
9th grade: 196
10th grade: 389
11th grade: 672
12th grade, no diploma: 1,437
High school graduate (or equivalency): 10,003
Less than 1 year of college: 2,296
Some college more than 1 year, no degree: 5,002
Associate degree: 4,040
Bachelor's degree: 6,287
Master's degree: 2,478
Professional school degree: 709
Doctorate degree: 101
Education attainment for females 25 years and older:
No schooling: 1,929
Nursery to 4th grade: 421
5th and 6th grade: 1,006
7th and 8th grade: 878
9th grade: 1,011
10th grade: 424
11th grade: 685
12th grade, no diploma: 1,235
High school graduate (or equivalency): 8,594
Less than 1 year of college: 2,252
Some college more than 1 year, no degree: 4,193
Associate degree: 3,404
Bachelor's degree: 7,703
Master's degree: 2,970
Professional school degree: 319
Doctorate degree: 213
Housing units in structures:
One, detached: 19,933
One, attached: 2,559
Two: 679
3 or 4: 1,972
5 to 9: 2,131
10 to 19: 3,942
20 to 49: 2,119
50 or more: 2,543
Mobile homes: 195
Housing units lacking complete plumbing facilities in 2022: 0.3%
Housing units lacking complete kitchen facilities in 2022: 2.9%
House/condo owner moved in on average 18 years ago