Faribault, MN (Minnesota) Houses and Residents
| Faribault: | $231,720 |
| Minnesota: | $314,600 |
Total population: 23,594 (Urban population: 20,532 (all inside urban clusters), Rural population: 299 (18 farm, 281 nonfarm))
Houses: 9,395 (8,949 occupied: 5,765 owner occupied, 3,220 renter occupied)
| % of renters here: | 36% |
| State: | 28% |
Housing density: 742 houses/condos per square mile
Median price asked for vacant for-sale houses and condos in 2022: $518,059.
Median contract rent in 2022: $798 (lower quartile is $607, upper quartile is $1,081)
Median rent asked for vacant for-rent units in 2022: $2,487
Median gross rent in Faribault, MN in 2022: $912
Housing units in Faribault with a mortgage: 3,529 (240 second mortgage, 0 home equity loan, 160 both second mortgage and home equity loan)
Houses without a mortgage: 111
Median household income for houses/condos with a mortgage: $87,256
Median household income for apartments without a mortgage: $63,775
Median monthly housing costs: $1,077
Compare current foreclosures in Faribault, MN:
| Photo | Address | Area | Beds / Baths | Price | Details |
|---|---|---|---|---|---|

|
#1
Fairfax Way
Faribault, MN 55021
|
1,373 sq. feet
|
2 baths 2 beds |
$394,900
|
show details |

|
#2
Bixby Ave
Faribault, MN 55021
|
1,522 sq. feet
|
2 baths 3 beds |
$269,900
|
show details |

|
#3
1st St SW
Faribault, MN 55021
|
1,360 sq. feet
|
2 baths 3 beds |
show details | |

|
#4
7th Ave SW
Faribault, MN 55021
|
1,058 sq. feet
|
1 baths 2 beds |
show details | |

|
#5
Frink Ave
Faribault, MN 55021
|
1,208 sq. feet
|
2 baths 4 beds |
show details | |

|
#6
1st Ave NW
Faribault, MN 55021
|
720 sq. feet
|
1 baths 2 beds |
show details | |

|
#7
Greenwood Pl
Faribault, MN 55021
|
816 sq. feet
|
1 baths 2 beds |
show details | |

|
#8
2nd Ave NW
Faribault, MN 55021
|
1,939 sq. feet
|
1 baths 4 beds |
show details | |

|
#9
7th Ave SW
Faribault, MN 55021
|
1,344 sq. feet
|
1 baths 4 beds |
show details | |

|
#10
Prairie Ave SW
Faribault, MN 55021
|
892 sq. feet
|
1 baths 3 beds |
show details |
| Photo | Address | Area | Beds / Baths | Price | Details |
|---|---|---|---|---|---|

|
#11
French Lake Trl
Faribault, MN 55021
|
1,920 sq. feet
|
1 baths 2 beds |
show details | |

|
#12
Willow St
Faribault, MN 55021
|
884 sq. feet
|
1 baths 3 beds |
show details | |

|
#13
6th St NW
Faribault, MN 55021
|
1,568 sq. feet
|
2 baths 3 beds |
show details | |

|
#14
7th Ave SW
Faribault, MN 55021
|
1,574 sq. feet
|
2 baths 5 beds |
show details | |

|
#15
Summer Ln
Faribault, MN 55021
|
1,696 sq. feet
|
2 baths 4 beds |
show details | |

|
#16
Tatepaha Blvd
Faribault, MN 55021
|
1,634 sq. feet
|
1 baths 3 beds |
show details | |

|
#17
Holland Trl
Faribault, MN 55021
|
1,420 sq. feet
|
1 baths 3 beds |
show details | |

|
#18
S Trail Cir
Faribault, MN 55021
|
1,019 sq. feet
|
1 baths 3 beds |
show details | |

|
#19
15 1/2 St NW
Faribault, MN 55021
|
1,750 sq. feet
|
1 baths 3 beds |
show details | |

|
#20
Ivanhoe Ct
Faribault, MN 55021
|
873 sq. feet
|
1 baths 2 beds |
show details |
| Photo | Address | Area | Beds / Baths | Price | Details |
|---|---|---|---|---|---|

|
#21
Westwood Dr SW
Faribault, MN 55021
|
2,092 sq. feet
|
2 baths 3 beds |
show details | |

|
#22
Saint Paul Ave
Faribault, MN 55021
|
2,190 sq. feet
|
2 baths 5 beds |
show details | |

|
#23
9th St SW
Faribault, MN 55021
|
1,222 sq. feet
|
1 baths 4 beds |
show details | |

|
#24
5th St NW
Faribault, MN 55021
|
792 sq. feet
|
1 baths 2 beds |
show details | |

|
#25
Birn Hill Dr
Faribault, MN 55021
|
974 sq. feet
|
1 baths 4 beds |
show details | |

|
#26
Village Dr
Faribault, MN 55021
|
1,577 sq. feet
|
1 baths 2 beds |
show details | |

|
#27
1st St NW
Faribault, MN 55021
|
- sq. feet
|
- baths - beds |
show details | |

|
#28
6th St NW Apt 3
Faribault, MN 55021
|
- sq. feet
|
- baths - beds |
show details | |

|
#29
177th St W
Faribault, MN 55021
|
- sq. feet
|
- baths - beds |
show details | |

|
#30
8th St NW
Faribault, MN 55021
|
- sq. feet
|
- baths - beds |
show details |
| Photo | Address | Area | Beds / Baths | Price | Details |
|---|---|---|---|---|---|

|
#31
Willow St
Faribault, MN 55021
|
- sq. feet
|
- baths - beds |
show details | |

|
Check over 1 million property listings on Foreclosure.com!
|
browse all offers | |||

Latest news about housing in Faribault, MN collected exclusively by city-data.com from local newspapers, TV, and radio stations

 | Need your help moving for work to Wanamingo, MN (7 replies) |
| Rochester - neighborhoods, schools, general housing info (2 replies) |
| Moving to Rochester area, suggestions? (12 replies) |
| Which suburbs to live in if working in Bloomington? (21 replies) |
| Faribault job offer (5 replies) |
| Affordable Areas in Minnesota? (16 replies) |

Median year apartment built: 1980
Household type by relationship:
Households: 24,614- Male householders: 4,202 (1,445 living alone), Female householders: 4,721 (1,511 living alone)
3,645 spouses (3,537 opposite-sex spouses), 836 unmarried partners, (806 opposite-sex unmarried partners), 7,016 children (6,674 natural, 102 adopted, 238 stepchildren), 222 grandchildren, 349 brothers or sisters, 131 parents, 0 foster children, 425 other relatives, 706 non-relatives
- In group quarters: 2,356
Size of family households: 2,333 2-persons, 1,345 3-persons, 849 4-persons, 453 5-persons, 288 6-persons, 137 7-or-more-persons.
Size of nonfamily households: 3,144 1-person, 316 2-persons, 65 3-persons, 29 5-persons, 12 7-or-more-persons.
3,105 married couples with children.
2,144 single-parent households (203 men, 1,941 women).
77.6% of residents of Faribault speak English at home.
11.2% of residents speak Spanish at home (51% speak English very well, 20% speak English well, 25% speak English not well, 4% don't speak English at all).
0.7% of residents speak other Indo-European language at home (96% speak English very well, 4% speak English not well).
1.0% of residents speak Asian or Pacific Island language at home (91% speak English very well, 9% speak English well).
10.3% of residents speak other language at home (39% speak English very well, 39% speak English well, 6% speak English not well, 15% don't speak English at all).
Foreign born population: 4,133 (16.8%)
(34.6% of them are naturalized citizens)
| Here: | 7.0 |
| State: | 7.1 |
| Here: | 3.9 |
| State: | 3.8 |

- Bedrooms in owner-occupied houses and condos in Faribault, Minnesota
- 86no bedroom
- 1751 bedroom
- 1,2152 bedrooms
- 2,4743 bedrooms
- 1,3664 bedrooms
- 4505+ bedrooms

- Bedrooms in renter-occupied apartments in Faribault, Minnesota
- 163no bedroom
- 8141 bedroom
- 1,4542 bedrooms
- 5683 bedrooms
- 1744 bedrooms
- 485+ bedrooms

- Cars and other vehicles available in Faribault in owner-occupied houses/condos
- 62no vehicle
- 1,4991 vehicle
- 2,6032 vehicles
- 9483 vehicles
- 4354 vehicles
- 2185+ vehicles

- Cars and other vehicles available in Faribault in renter-occupied apartments
- 707no vehicle
- 1,6541 vehicle
- 6942 vehicles
- 1523 vehicles
- 144 vehicles
- 05+ vehicles

- Rooms in owner-occupied houses in Faribault, Minnesota
- 861 room
- 02 rooms
- 853 rooms
- 2704 rooms
- 9775 rooms
- 1,2686 rooms
- 1,1167 rooms
- 5898 rooms
- 1,3759+ rooms

- Rooms in renter-occupied apartments in Faribault, Minnesota
- 1491 room
- 1052 rooms
- 6443 rooms
- 1,1194 rooms
- 5845 rooms
- 2056 rooms
- 1937 rooms
- 1718 rooms
- 539+ rooms


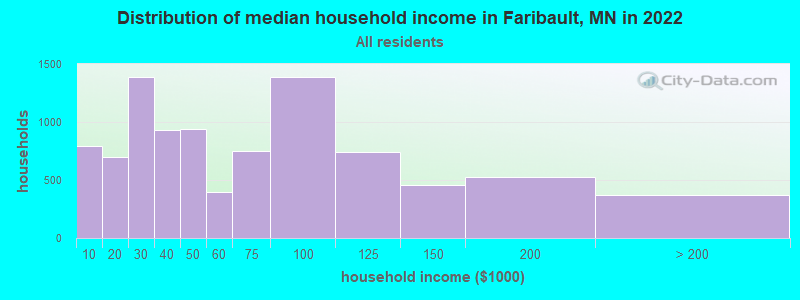
Faribault, MN household income distribution

- 790Less than $10,000
- 700$10,000 to $19,999
- 1,391$20,000 to $29,999
- 930$30,000 to $39,999
- 943$40,000 to $49,999
- 395$50,000 to $59,999
- 749$60,000 to $74,999
- 1,385$75,000 to $99,999
- 739$100,000 to $124,999
- 459$125,000 to $149,999
- 526$150,000 to $199,999
- 370$200,000 or more
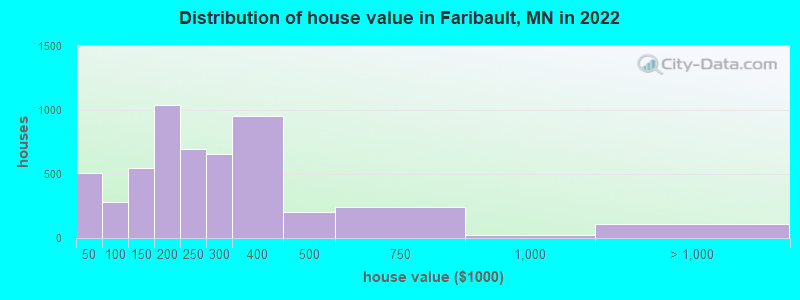
Home value of owner - occupied houses in 2022 in Faribault, MN
-
- 166Less than $10,000
- 31$10,000 to $14,999
- 79$15,000 to $19,999
- 11$20,000 to $24,999
- 50$25,000 to $29,999
- 87$30,000 to $34,999
- 26$35,000 to $39,999
- 56$40,000 to $49,999
- 10$50,000 to $59,999
- 10$60,000 to $69,999
- 18$70,000 to $79,999
- 104$80,000 to $89,999
- 82$90,000 to $99,999
- 303$100,000 to $124,999
- 243$125,000 to $149,999
- 590$150,000 to $174,999
- 445$175,000 to $199,999
- 697$200,000 to $249,999
- 657$250,000 to $299,999
- 954$300,000 to $399,999
- 201$400,000 to $499,999
- 241$500,000 to $749,999
- 22$750,000 to $999,999
- 94$1,000,000 to $1,499,999
- 12$2,000,000 or more
Rent paid by renters in 2022 in Faribault, MN
-
- 111$150 to $199
- 12$200 to $249
- 9$250 to $299
- 60$300 to $349
- 124$350 to $399
- 14$400 to $449
- 14$450 to $499
- 98$500 to $549
- 125$550 to $599
- 183$600 to $649
- 92$650 to $699
- 145$700 to $749
- 388$750 to $799
- 375$800 to $899
- 448$900 to $999
- 683$1,000 to $1,249
- 131$1,250 to $1,499
- 98$1,500 to $1,999
- 112$2,000 to $2,499
- 31$2,500 to $2,999
- 23$3,000 to $3,499
- 11$3,500 or more
- 11No cash rent


Percentage of workers working in this county: 78.6%
Number of people working at home: 632 (6.2% of all workers)
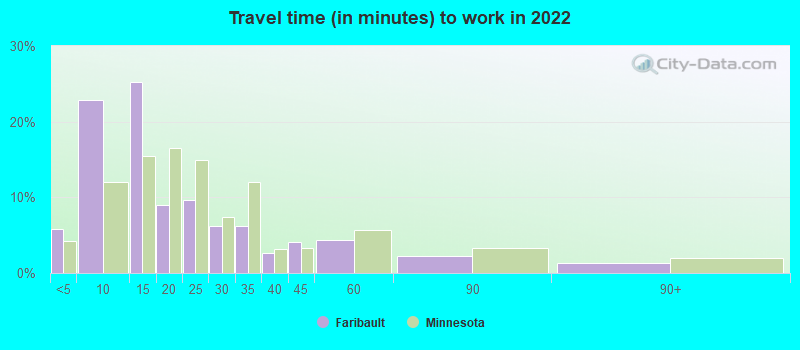
Travel time to work (commute)
- Less than 5 minutes: 780
- 5 to 9 minutes: 2,694
- 10 to 14 minutes: 3,165
- 15 to 19 minutes: 577
- 20 to 24 minutes: 1,156
- 25 to 29 minutes: 212
- 30 to 34 minutes: 399
- 35 to 39 minutes: 122
- 40 to 44 minutes: 300
- 45 to 59 minutes: 653
- 60 to 89 minutes: 253
- 90 or more minutes: 148
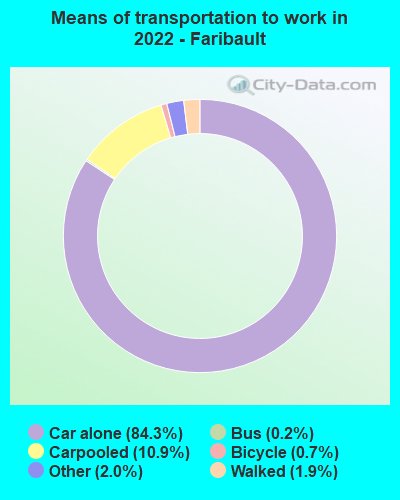
Means of transportation to work:
- Drove a car alone: 9,135 (77.7%)
- Carpooled: 1,210 (10.3%)
- Bus: 13 (0.1%)
- Taxi: 272 (2.3%)
- Bicycle: 68 (0.6%)
- Walked: 209 (1.8%)
- Worked at home: 632 (5.4%)

- Unemployment by race in 2022
- Unemployment rate for White non-Hispanic residents
- 2.9%Males
- 3.2%Females
- Unemployment rate for Black residents
- 13.2%Males
- 12.6%Females
- Unemployment rate for other race residents
- 12.1%Males
- Unemployment rate for two or more race residents
- 6.1%Males
- Unemployment rate for Hispanic or Latino residents
- 11.3%Males

- Year of entry for the foreign-born population in Faribault, Minnesota
- 2,4452010 or later
- 6662000 to 2009
- 5741990 to 1999
- 4031980 to 1989
- 2041970 to 1979
- 61Before 1970

First ancestries reported:
- Somali: 2,411 (17.8%)
- German: 2,386 (17.7%)
- American: 970 (7.2%)
- Norwegian: 826 (6.1%)
- English: 498 (3.7%)
- Irish: 352 (2.6%)
- Czech: 291 (2.2%)
- European: 256 (1.9%)
- French Canadian: 182 (1.3%)
- French: 135 (1.0%)
- Sudanese: 129 (1.0%)
- Polish: 113 (0.8%)
- Scandinavian: 111 (0.8%)
- Eastern European: 86 (0.6%)
- Ethiopian: 81 (0.6%)
- Scotch-Irish: 62 (0.5%)
- Swedish: 58 (0.4%)
- Czechoslovakian: 51 (0.4%)
- Greek: 30 (0.2%)
- Ukrainian: 27 (0.2%)
- African: 26 (0.2%)
- Nigerian: 22 (0.2%)
- Scottish: 19 (0.1%)
- Italian: 19 (0.1%)
- Northern European: 19 (0.1%)
- Russian: 17 (0.1%)
- Slovene: 17 (0.1%)
- Dutch: 15 (0.1%)
- Finnish: 15 (0.1%)
- Slovak: 12 (0.09%)
- Liberian: 11 (0.08%)
- Danish: 10 (0.07%)
- Egyptian: 9 (0.07%)
- Kenyan: 6 (0.04%)
- Moroccan: 1 (0.01%)
Most common places of birth for foreign-born residents (%):
| Faribault: | 35.6% (1,342) |
| Minnesota: | 8.0% (38,461) |
| Faribault: | 27.2% (1,026) |
| Minnesota: | 12.1% (58,312) |
| Faribault: | 12.5% (472) |
| Minnesota: | 5.1% (24,630) |
| Faribault: | 4.4% (166) |
| Minnesota: | 0.6% (2,993) |
| Faribault: | 3.7% (139) |
| Minnesota: | 3.3% (15,701) |
| Faribault: | 3.3% (125) |
| Minnesota: | 0.4% (2,042) |
| Faribault: | 2.5% (93) |
| Minnesota: | 2.4% (11,675) |
| Faribault: | 1.7% (63) |
| Minnesota: | 2.0% (9,850) |
Place of birth for U.S.-born residents:
- This state: 16,493
- Other state: 4,119
- Northeast: 474
- Midwest: 2,220
- South: 778
- West: 583
87.1% of Faribault residents lived in the same house 1 years ago.
Out of people who lived in different houses, 26.1% lived in this county.
Out of people who lived in different counties, 81.2% lived in Minnesota.
| Faribault: | 87.1% |
| State average: | 87.4% |
Education attainment for males 25 years and older:
- No schooling: 193
- Nursery to 4th grade: 73
- 5th and 6th grade: 30
- 7th and 8th grade: 99
- 9th grade: 44
- 10th grade: 138
- 11th grade: 77
- 12th grade, no diploma: 150
- High school graduate (or equivalency): 3,701
- Less than 1 year of college: 563
- Some college more than 1 year, no degree: 1,435
- Associate degree: 422
- Bachelor's degree: 1,147
- Master's degree: 341
- Professional school degree: 114
- Doctorate degree: 40

Education attainment for females 25 years and older:
- No schooling: 426
- Nursery to 4th grade: 76
- 5th and 6th grade: 0
- 7th and 8th grade: 62
- 9th grade: 11
- 10th grade: 81
- 11th grade: 151
- 12th grade, no diploma: 168
- High school graduate (or equivalency): 2,829
- Less than 1 year of college: 531
- Some college more than 1 year, no degree: 1,075
- Associate degree: 874
- Bachelor's degree: 1,412
- Master's degree: 248
- Professional school degree: 57
- Doctorate degree: 0


Housing units in structures:
- One, detached: 5,578
- One, attached: 413
- Two: 259
- 3 or 4: 531
- 5 to 9: 374
- 10 to 19: 432
- 20 to 49: 593
- 50 or more: 531
- Mobile homes: 680
Median worth of mobile homes: $41,461
Housing units lacking complete kitchen facilities in 2022: 1.9%
House/condo owner moved in on average 11 years ago
Renter moved in on average 1 years ago

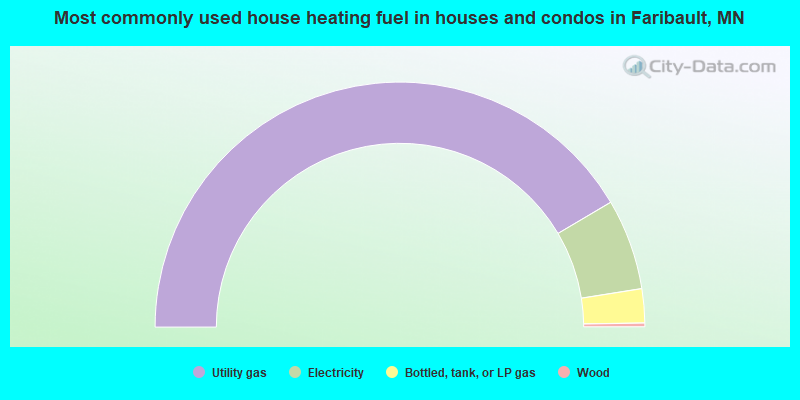
- 83.0%Utility gas
- 12.0%Electricity
- 4.5%Bottled, tank, or LP gas
- 0.5%Wood
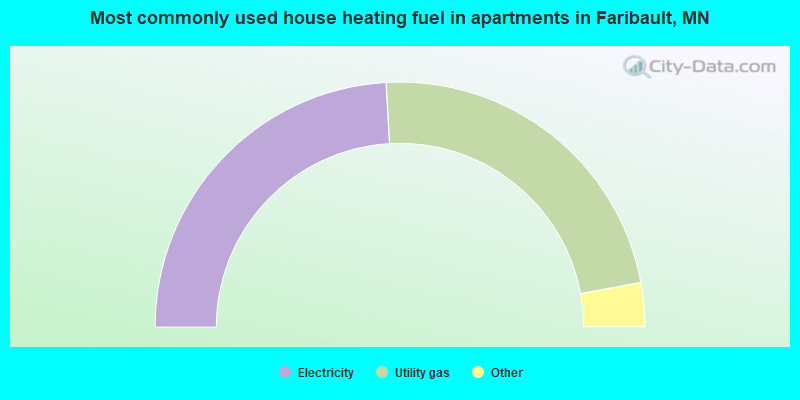
- 48.2%Electricity
- 46.0%Utility gas
- 3.1%Bottled, tank, or LP gas
- 1.5%No fuel used
- 1.2%Other fuel
Private vs. public school enrollment:
| Here: | 16.1% |
| Minnesota: | 12.9% |
| Here: | 18.4% |
| Minnesota: | 8.6% |
| Here: | 10.5% |
| Minnesota: | 26.2% |


