Graham, WA (Washington) Houses and Residents
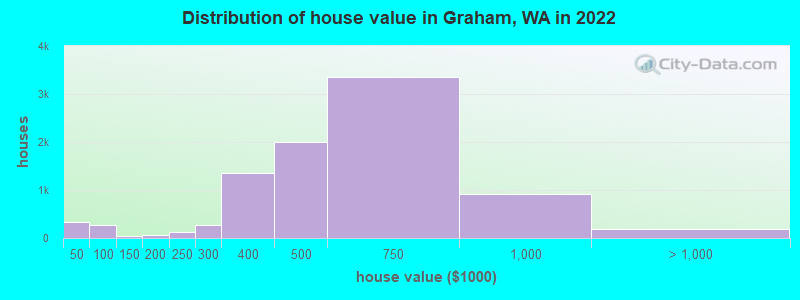
Estimated median house or condo value in 2022: $517,910 (it was $153,200 in 2000 )
Graham:
$517,910Washington:
$569,500
Lower value quartile - upper value quartile: $414,094 - $652,236Mean price in 2022: Detached houses: $507,441 Here:
$507,441State:
$734,307
Townhouses or other attached units: $478,319 Here:
$478,319State:
$657,697
Mobile homes: $206,815 Here:
$206,815State:
$218,362
Total population: 23,491 (Urban population: 4,479, Rural population: 4,401 (127 farm, 4,274 nonfarm ))
Houses: 11,338 (10,935 occupied: 9,023 owner occupied, 1,914 renter occupied )
% of renters here:
18%State:
36%
Housing density: 529 houses/condos per square mile
Median price asked for vacant for-sale houses and condos in 2022 in this county: $155,723.
Median contract rent in 2022: $1,883 (lower quartile is $1,268, upper quartile is over $2,000)
Median rent asked for vacant for-rent units in 2022: $2,234
Median gross rent in Graham, WA in 2022: over $2,000
Housing units in Graham with a mortgage: 6,563 (466 second mortgage, 0 home equity loan, 350 both second mortgage and home equity loan )Houses without a mortgage: 233
Median household income for houses/condos with a mortgage: $126,327
Median household income for apartments without a mortgage: $83,771
Median monthly housing costs: $1,973
Data:
Median house or condo value ($)
Median house or condo value ($ change since 2000)
Median house or condo value ($) - White
Median house or condo value ($) - Black or African American
Median house or condo value ($) - Asian
Median house or condo value ($) - Hispanic or Latino
Median house or condo value ($) - American Indian and Alaska Native
Median house or condo value ($) - Multirace
Median house or condo value ($) - Other Race
Median price asked for mobile homes ($)
Household density (households per square mile)
Mean house or condo value by units in structure - 1, detached ($)
Mean house or condo value by units in structure - 1, attached ($)
Mean house or condo value by units in structure - 2 ($)
Mean house or condo value by units in structure by units in structure - 3 or 4 ($)
Mean house or condo value by units in structure - 5 or more ($)
Mean house or condo value by units in structure - Boat, RV, van, etc. ($)
Mean house or condo value by units in structure - Mobile home ($)
Median contract rent ($)
Median contract rent - Lower quartile ($)
Median contract rent - Upper quartile ($)
Median gross rent ($)
Urban houses (%)
Rural houses (%)
Houses occupied (%)
Houses occupied (% change since 2000)
Houses owner occupied (%)
Houses owner occupied (% change since 2000)
Houses renter occupied (%)
Houses renter occupied (% change since 2000)
Vacant housing units - For rent (%)
Vacant housing units - For rent (% change since 2000)
Vacant housing units - For sale only (%)
Vacant housing units - For sale only (% change since 2000)
Vacant housing units - Rented or sold, not occupied (%)
Vacant housing units - Rented or sold, not occupied (% change since 2000)
Vacant housing units - For seasonal, recreational, or occasional use (%)
Vacant housing units - For seasonal, recreational, or occasional use (% change since 2000)
Vacant housing units - For migrant workers (%)
Vacant housing units - For migrant workers (% change since 2000)
Vacant housing units - Other vacant (%)
Vacant housing units - Other vacant (% change since 2000)
Median monthly housing costs ($)
Median household income for houses/condos with a mortgage ($)
Median household income for houses/condos without a mortgage ($)
Median household income ($)
Median household income ($) - White
Median household income ($) - Black or African American
Median household income ($) - Asian
Median household income ($) - Hispanic or Latino
Median household income ($) - American Indian and Alaska Native
Median household income ($) - Multirace
Median household income ($) - Other Race
Mortgage status - with mortgage (%)
Mortgage status - with second mortgage (%)
Mortgage status - with home equity loan (%)
Mortgage status - with both second mortgage and home equity loan (%)
Mortgage status - without a mortgage (%)
Median year house/condo built
Median year apartment built
Household type by relationship - Male householder living alone (%)
Household type by relationship - Male householder not living alone (%)
Household type by relationship - Female householder living alone (%)
Household type by relationship - Female householder not living alone (%)
Household type by relationship - Opposite-Sex spouse (%)
Household type by relationship - Same-Sex spouse (%)
Household type by relationship - Opposite-Sex unmarried partner (%)
Household type by relationship - Same-Sex unmarried partner (%)
Household type by relationship - In group quarters (%)
Size of family households - 2-person household (%)
Size of family households - 3-person household (%)
Size of family households - 4-person household (%)
Size of family households - 5-person household (%)
Size of family households - 6-person household (%)
Size of family households - 7-or-more-person household (%)
Size of nonfamily households - 1-person household (%)
Size of nonfamily households - 2-person household (%)
Size of nonfamily households - 3-person household (%)
Size of nonfamily households - 4-person household (%)
Size of nonfamily households - 5-person household (%)
Size of nonfamily households - 6-person household (%)
Size of nonfamily households - 7-or-moreperson household (%)
Year house built - Built 2010 or later (%)
Year house built - Built 2000 to 2009 (%)
Year house built - Built 1990 to 1999 (%)
Year house built - Built 1980 to 1989 (%)
Year house built - Built 1970 to 1979 (%)
Year house built - Built 1960 to 1969 (%)
Year house built - Built 1950 to 1959 (%)
Year house built - Built 1940 to 1949 (%)
Year house built - Built 1939 or earlier (%)
Median number of rooms in houses and condos
Median number of rooms in apartments
Median number of bedrooms in owner occupied houses
Mean number of bedrooms in owner occupied houses
Median number of bedrooms in renter occupied houses
Mean number of bedrooms in renter occupied houses
Median number of vehichles in owner occupied houses
Mean number of vehichles in owner occupied houses
Median number of vehichles in renter occupied houses
Mean number of vehichles in renter occupied houses
Rooms in owner-occupied houses - 1 room (%)
Rooms in owner-occupied houses - 2 rooms (%)
Rooms in owner-occupied houses - 3 rooms (%)
Rooms in owner-occupied houses - 4 rooms (%)
Rooms in owner-occupied houses - 5 rooms (%)
Rooms in owner-occupied houses - 6 rooms (%)
Rooms in owner-occupied houses - 7 rooms (%)
Rooms in owner-occupied houses - 8 rooms (%)
Rooms in owner-occupied houses - 9+ rooms (%)
Rooms in renter-occupied houses - 1 room (%)
Rooms in renter-occupied houses - 2 rooms (%)
Rooms in renter-occupied houses - 3 rooms (%)
Rooms in renter-occupied houses - 4 rooms (%)
Rooms in renter-occupied houses - 5 rooms (%)
Rooms in renter-occupied houses - 6 rooms (%)
Rooms in renter-occupied houses - 7 rooms (%)
Rooms in renter-occupied houses - 8 rooms (%)
Rooms in renter-occupied houses - 9+ rooms (%)
Bedrooms in owner-occupied houses - no bedrooms (%)
Bedrooms in owner-occupied houses - 1 bedroom (%)
Bedrooms in owner-occupied houses - 2 bedrooms (%)
Bedrooms in owner-occupied houses - 3 bedrooms (%)
Bedrooms in owner-occupied houses - 4 bedrooms (%)
Bedrooms in owner-occupied houses - 5+ bedrooms (%)
Bedrooms in renter-occupied houses - no bedrooms (%)
Bedrooms in renter-occupied houses - 1 bedroom (%)
Bedrooms in renter-occupied houses - 2 bedrooms (%)
Bedrooms in renter-occupied houses - 3 bedrooms (%)
Bedrooms in renter-occupied houses - 4 bedrooms (%)
Bedrooms in renter-occupied houses - 5+ bedrooms (%)
Vehicles available in owner-occupied houses - no vehicle available (%)
Vehicles available in owner-occupied houses - 1 vehicle available(%)
Vehicles available in owner-occupied houses - 2 Vehicles available (%)
Vehicles available in owner-occupied houses - 3 Vehicles available (%)
Vehicles available in owner-occupied houses - 4 Vehicles available (%)
Vehicles available in owner-occupied houses - 5+ Vehicles available (%)
Vehicles available in renter-occupied houses - no vehicle available (%)
Vehicles available in renter-occupied houses - 1 vehicle available (%)
Vehicles available in renter-occupied houses - 2 Vehicles available (%)
Vehicles available in renter-occupied houses - 3 Vehicles available (%)
Vehicles available in renter-occupied houses - 4 Vehicles available (%)
Vehicles available in renter-occupied houses - 5+ Vehicles available (%)
Housing units in structures - 1, detached (%)
Housing units in structures - 1, attached (%)
Housing units in structures - 2 (%)
Housing units in structures - 3 or 4 (%)
Housing units in structures - 5 to 9 (%)
Housing units in structures - 10 to 19 (%)
Housing units in structures - 20 to 49 (%)
Housing units in structures - 50 or more (%)
Housing units in structures - Mobile home (%)
Housing units in structures - Boat, RV, van, etc. (%)
Housing units in structures - Owners - 1, detached (%)
Housing units in structures - Owners - 1, attached (%)
Housing units in structures - Owners - 2 (%)
Housing units in structures - Owners - 3 or 4 (%)
Housing units in structures - Owners - 5 to 9 (%)
Housing units in structures - Owners - 10 to 19 (%)
Housing units in structures - Owners - 20 to 49 (%)
Housing units in structures - Owners - 50 or more (%)
Housing units in structures - Owners - Mobile home (%)
Housing units in structures - Owners - Boat, RV, van, etc. (%)
Housing units in structures - Renters - 1, detached (%)
Housing units in structures - Renters - 1, attached (%)
Housing units in structures - Renters - 2 (%)
Housing units in structures - Renters - 3 or 4 (%)
Housing units in structures - Renters - 5 to 9 (%)
Housing units in structures - Renters - 10 to 19 (%)
Housing units in structures - Renters - 20 to 49 (%)
Housing units in structures - Renters - 50 or more (%)
Housing units in structures - Renters - Mobile home (%)
Housing units in structures - Renters - Boat, RV, van, etc. (%)
House/condo owner moved in on average (years ago)
Renter moved in on average (years ago)
Year householder moved into unit - Moved in 1999 to March 2000 (%)
Year householder moved into unit - Moved in 1999 to March 2000 (%) - White
Year householder moved into unit - Moved in 1999 to March 2000 (%) - Black or African American
Year householder moved into unit - Moved in 1999 to March 2000 (%) - Asian
Year householder moved into unit - Moved in 1999 to March 2000 (%) - Hispanic or Latino
Year householder moved into unit - Moved in 1999 to March 2000 (%) - American Indian and Alaska Native
Year householder moved into unit - Moved in 1999 to March 2000 (%) - Multirace
Year householder moved into unit - Moved in 1999 to March 2000 (%) - Other Race
Year householder moved into unit - Moved in 1995 to 1998 (%)
Year householder moved into unit - Moved in 1995 to 1998 (%) - White
Year householder moved into unit - Moved in 1995 to 1998 (%) - Black or African American
Year householder moved into unit - Moved in 1995 to 1998 (%) - Asian
Year householder moved into unit - Moved in 1995 to 1998 (%) - Hispanic or Latino
Year householder moved into unit - Moved in 1995 to 1998 (%) - American Indian and Alaska Native
Year householder moved into unit - Moved in 1995 to 1998 (%) - Multirace
Year householder moved into unit - Moved in 1995 to 1998 (%) - Other Race
Year householder moved into unit - Moved in 1990 to 1994 (%)
Year householder moved into unit - Moved in 1990 to 1994 (%) - White
Year householder moved into unit - Moved in 1990 to 1994 (%) - Black or African American
Year householder moved into unit - Moved in 1990 to 1994 (%) - Asian
Year householder moved into unit - Moved in 1990 to 1994 (%) - Hispanic or Latino
Year householder moved into unit - Moved in 1990 to 1994 (%) - American Indian and Alaska Native
Year householder moved into unit - Moved in 1990 to 1994 (%) - Multirace
Year householder moved into unit - Moved in 1990 to 1994 (%) - Other Race
Year householder moved into unit - Moved in 1980 to 1989 (%)
Year householder moved into unit - Moved in 1980 to 1989 (%) - White
Year householder moved into unit - Moved in 1980 to 1989 (%) - Black or African American
Year householder moved into unit - Moved in 1980 to 1989 (%) - Asian
Year householder moved into unit - Moved in 1980 to 1989 (%) - Hispanic or Latino
Year householder moved into unit - Moved in 1980 to 1989 (%) - American Indian and Alaska Native
Year householder moved into unit - Moved in 1980 to 1989 (%) - Multirace
Year householder moved into unit - Moved in 1980 to 1989 (%) - Other Race
Year householder moved into unit - Moved in 1970 to 1979 (%)
Year householder moved into unit - Moved in 1970 to 1979 (%) - White
Year householder moved into unit - Moved in 1970 to 1979 (%) - Black or African American
Year householder moved into unit - Moved in 1970 to 1979 (%) - Asian
Year householder moved into unit - Moved in 1970 to 1979 (%) - Hispanic or Latino
Year householder moved into unit - Moved in 1970 to 1979 (%) - American Indian and Alaska Native
Year householder moved into unit - Moved in 1970 to 1979 (%) - Multirace
Year householder moved into unit - Moved in 1970 to 1979 (%) - Other Race
Year householder moved into unit - Moved in 1969 or earlier (%)
Year householder moved into unit - Moved in 1969 or earlier (%) - White
Year householder moved into unit - Moved in 1969 or earlier (%) - Black or African American
Year householder moved into unit - Moved in 1969 or earlier (%) - Asian
Year householder moved into unit - Moved in 1969 or earlier (%) - Hispanic or Latino
Year householder moved into unit - Moved in 1969 or earlier (%) - American Indian and Alaska Native
Year householder moved into unit - Moved in 1969 or earlier (%) - Multirace
Year householder moved into unit - Moved in 1969 or earlier (%) - Other Race
Housing units lacking complete plumbing facilities (%)
Housing units lacking complete kitchen facilities (%)
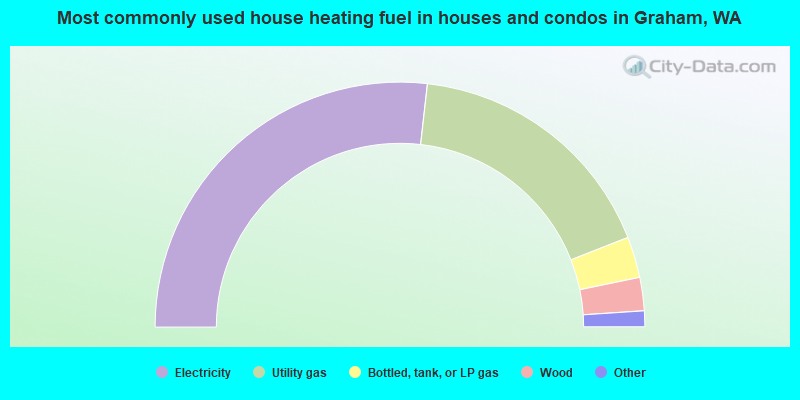
House heating fuel used in houses and condos - Utility gas (%)
House heating fuel used in houses and condos - Bottled, tank, or LP gas (%)
House heating fuel used in houses and condos - Electricity (%)
House heating fuel used in houses and condos - Fuel oil, kerosene, etc. (%)
House heating fuel used in houses and condos - Coal or coke (%)
House heating fuel used in houses and condos - Wood (%)
House heating fuel used in houses and condos - Solar energy (%)
House heating fuel used in houses and condos - Other fuel (%)
House heating fuel used in houses and condos - No fuel used (%)
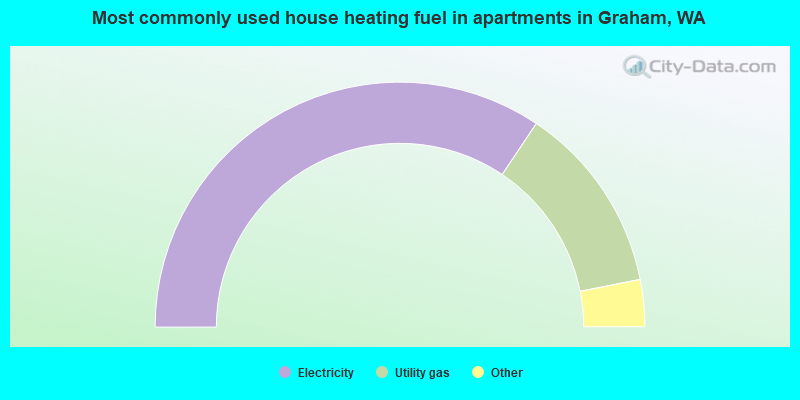
House heating fuel used in apartments - Utility gas (%)
House heating fuel used in apartments - Bottled, tank, or LP gas (%)
House heating fuel used in apartments - Electricity (%)
House heating fuel used in apartments - Fuel oil, kerosene, etc. (%)
House heating fuel used in apartments - Coal or coke (%)
House heating fuel used in apartments - Wood (%)
House heating fuel used in apartments - Solar energy (%)
House heating fuel used in apartments - Other fuel (%)
House heating fuel used in apartments - No fuel used (%)
Latest news about housing in Graham, WA collected exclusively by city-data.com from local newspapers, TV, and radio stations
Median year house/condo built: 1999Median year apartment built: 2002Household type by relationship:
Households: 35,095
Male householders: 5,597 (613 living alone ), Female householders: 5,130 (643 living alone )6,794 spouses (6,722 opposite-sex spouses ), 1,010 unmarried partners , (944 opposite-sex unmarried partners ), 12,561 children (11,261 natural , 411 adopted , 888 stepchildren ), 710 grandchildren , 255 brothers or sisters , 662 parents , 87 foster children , 768 other relatives , 1,397 non-relatives In group quarters: 118
Size of family households: 2,878 2-persons , 2,059 3-persons , 1,623 4-persons , 1,466 5-persons , 574 6-persons , 322 7-or-more-persons .
Size of nonfamily households: 1,280 1-person , 493 2-persons , 53 3-persons , 67 4-persons , 11 5-persons .
6,523 married couples with children. single-parent households (1,342 men , 1,195 women ).
87.0% of residents of Graham speak English at home. of residents speak Spanish at home (83% speak English very well , 3% speak English well , 13% speak English not well ).of residents speak other Indo-European language at home (53% speak English very well , 30% speak English well , 5% speak English not well , 11% don't speak English at all ).of residents speak Asian or Pacific Island language at home (60% speak English very well , 32% speak English well , 7% speak English not well , 1% don't speak English at all ).of residents speak other language at home (100% speak English very well ).
Foreign born population: 2,638 (7.5%)of them are naturalized citizens )
Median number of rooms in houses and condos:
Median number of rooms in apartments
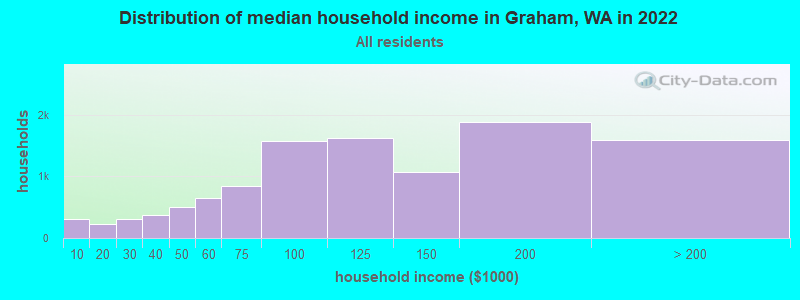
Graham, WA household income distribution 311 Less than $10,000225 $10,000 to $19,999306 $20,000 to $29,999378 $30,000 to $39,999510 $40,000 to $49,999645 $50,000 to $59,999846 $60,000 to $74,9991,573 $75,000 to $99,9991,620 $100,000 to $124,9991,069 $125,000 to $149,9991,881 $150,000 to $199,9991,585 $200,000 or more
Home value of owner - occupied houses in 2022 in Graham, WA 113 Less than $10,00046 $10,000 to $14,99920 $15,000 to $19,99957 $20,000 to $24,99911 $25,000 to $29,99912 $30,000 to $34,99920 $35,000 to $39,99947 $40,000 to $49,99956 $50,000 to $59,99983 $60,000 to $69,99959 $70,000 to $79,99912 $80,000 to $89,99914 $90,000 to $99,99927 $100,000 to $124,99915 $125,000 to $149,9999 $150,000 to $174,99943 $175,000 to $199,999126 $200,000 to $249,999281 $250,000 to $299,9991,360 $300,000 to $399,9991,994 $400,000 to $499,9993,359 $500,000 to $749,999915 $750,000 to $999,99993 $1,000,000 to $1,499,99941 $1,500,000 to $1,999,99953 $2,000,000 or moreRent paid by renters in 2022 in Graham, WA 21 $550 to $59971 $750 to $79916 $800 to $89991 $900 to $999181 $1,000 to $1,249142 $1,250 to $1,499549 $1,500 to $1,999353 $2,000 to $2,499453 $2,500 to $2,99951 $3,000 to $3,499159 No cash rent
Percentage of workers working in this county: 75.1%Number of people working at home: 1,992 (12.2% of all workers )
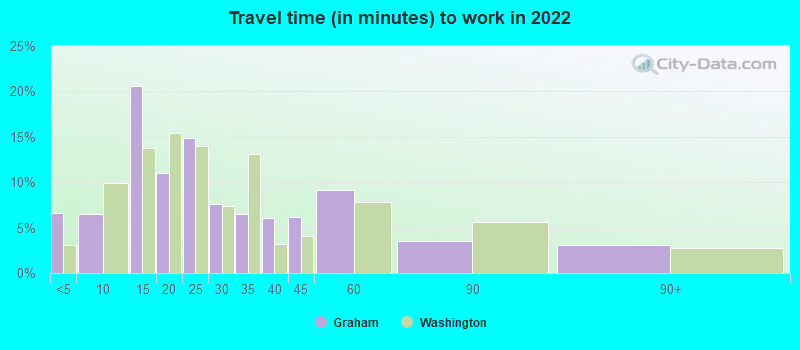
Travel time to work (commute)
Less than 5 minutes: 2305 to 9 minutes: 46210 to 14 minutes: 1,05515 to 19 minutes: 1,07020 to 24 minutes: 1,41225 to 29 minutes: 88130 to 34 minutes: 1,69635 to 39 minutes: 39440 to 44 minutes: 92145 to 59 minutes: 2,42160 to 89 minutes: 1,75790 or more minutes: 1,178
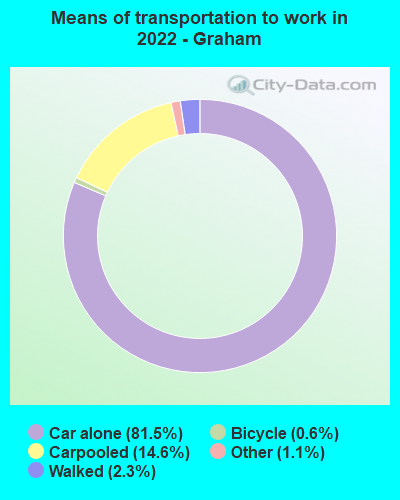
Means of transportation to work:
Drove a car alone: 1,821 (47.2%)Carpooled: 337 (8.7%)Taxi: 23 (0.6%)Bicycle: 18 (0.5%)Walked: 65 (1.7%)Worked at home: 1,992 (51.6%)
Unemployment by race in 2022
Unemployment rate for White non-Hispanic residents 7.9% Males2.4% FemalesUnemployment rate for Black residents 2.7% Males1.9% FemalesUnemployment rate for Asian residents 8.1% Males3.7% FemalesUnemployment rate for other race residents 31.7% FemalesUnemployment rate for two or more race residents 2.8% Males6.4% FemalesUnemployment rate for Hispanic or Latino residents 4.2% Males6.9% Females
Year of entry for the foreign-born population in Graham, Washington
1,034 2010 or later 350 2000 to 2009 596 1990 to 1999 26 1980 to 1989 29 1970 to 1979 78 Before 1970
First ancestries reported:
American: 1,600 (11.3%)
German: 1,525 (10.8%)
Irish: 709 (5.0%)
Scandinavian: 626 (4.4%)
English: 601 (4.2%)
Italian: 553 (3.9%)
European: 498 (3.5%)
Norwegian: 375 (2.7%)
Scottish: 249 (1.8%)
Swedish: 179 (1.3%)
Ukrainian: 179 (1.3%)
Dutch: 174 (1.2%)
Russian: 155 (1.1%)
Polish: 126 (0.9%)
Scotch-Irish: 81 (0.6%)
British: 80 (0.6%)
Kenyan: 80 (0.6%)
African: 66 (0.5%)
Eastern European: 62 (0.4%)
West Indian: 48 (0.3%)
Croatian: 46 (0.3%)
French: 38 (0.3%)
Danish: 32 (0.2%)
Swiss: 30 (0.2%)
Celtic: 29 (0.2%)
Iranian: 27 (0.2%)
Yugoslavian: 26 (0.2%)
Australian: 25 (0.2%)
Romanian: 25 (0.2%)
Northern European: 19 (0.1%)
Czechoslovakian: 17 (0.1%)
French Canadian: 10 (0.07%)
Welsh: 10 (0.07%)
Ethiopian: 9 (0.06%)
Canadian: 7 (0.05%)
Finnish: 6 (0.04%)
Portuguese: 6 (0.04%) Most common places of birth for foreign-born residents (%): Philippines Graham:
17.2% (440)Washington:
6.3% (71,661)
Ukraine Graham:
8.0% (206)Washington:
3.1% (35,872)
Mexico Graham:
7.2% (185)Washington:
21.1% (241,655)
Micronesia Graham:
7.0% (178)Washington:
0.4% (4,144)
Germany Graham:
6.4% (163)Washington:
1.6% (17,761)
Korea Graham:
5.6% (144)Washington:
4.3% (48,886)
Kenya Graham:
5.5% (141)Washington:
1.1% (12,735)
Vietnam Graham:
5.0% (129)Washington:
5.4% (62,003)
Peru Graham:
4.9% (126)Washington:
0.4% (4,914)
Russia Graham:
4.7% (120)Washington:
1.9% (21,540)
Dominican Republic Graham:
3.8% (97)Washington:
0.1% (1,313)
China, excluding Hong Kong and Taiwan Graham:
2.5% (64)Washington:
7.4% (84,470)
Oceania, n.e.c. Graham:
2.0% (51)Washington:
0.7% (8,049)
Austria Graham:
1.8% (45)Washington:
0.1% (709)
Brazil Graham:
1.6% (42)Washington:
0.8% (9,359)
Place of birth for U.S.-born residents:
This state: 19,046Other state: 12,064Northeast: 1,078Midwest: 2,274South: 2,700West: 5,976 88.2% of Graham residents lived in the same house 1 years ago.
Out of people who lived in different houses, 40.5% lived in this county.
Out of people who lived in different counties, 51.6% lived in Washington.
Graham:
88.2%State average:
85.2%
Education attainment for males 25 years and older:
No schooling: 71Nursery to 4th grade: 05th and 6th grade: 647th and 8th grade: 289th grade: 3510th grade: 13311th grade: 16812th grade, no diploma: 406High school graduate (or equivalency): 3,702Less than 1 year of college: 1,483Some college more than 1 year, no degree: 1,477Associate degree: 1,616Bachelor's degree: 1,251Master's degree: 616Professional school degree: 125Doctorate degree: 31
Education attainment for females 25 years and older:
No schooling: 80Nursery to 4th grade: 05th and 6th grade: 07th and 8th grade: 69th grade: 11610th grade: 6611th grade: 12812th grade, no diploma: 328High school graduate (or equivalency): 2,984Less than 1 year of college: 1,227Some college more than 1 year, no degree: 1,607Associate degree: 1,608Bachelor's degree: 1,646Master's degree: 701Professional school degree: 66Doctorate degree: 92
Housing units in structures:
One, detached: 9,151One, attached: 366Two: 593 or 4: 125 to 9: 14810 to 19: 7650 or more: 119Mobile homes: 1,405Median worth of mobile homes: $275,289
Housing units lacking complete plumbing facilities in 2022: 0.8%Housing units lacking complete kitchen facilities in 2022: 0.9%House/condo owner moved in on average 9 years ago
Renter moved in on average 5 years ago
Private vs. public school enrollment:
Students in private schools in grades 1 to 8 (elementary and middle school): 503 Here:
10.2%Washington:
12.4%
Students in private schools in grades 9 to 12 (high school): 396 Here:
16.8%Washington:
9.2%
Students in private undergraduate colleges: 204 Here:
18.1%Washington:
16.5%