Housing density: 615 houses/condos per square mile
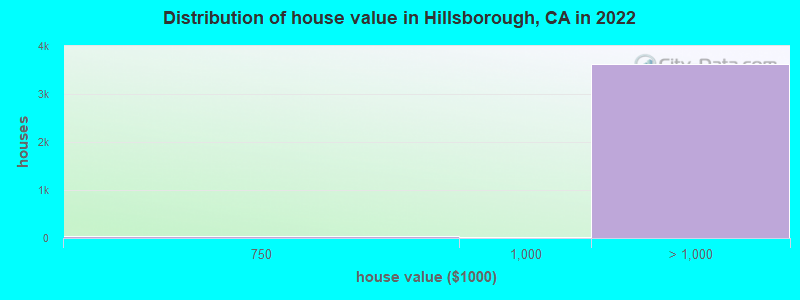
Median price asked for vacant for-sale houses and condos in 2022: $4,662,143.
Median contract rent in 2022: over $2,000
Median rent asked for vacant for-rent units in 2022: $32,664
Median gross rent in Hillsborough, CA in 2022: over $2,000
Housing units in Hillsborough with a mortgage: 2,009 (357 second mortgage, 41 home equity loan, 325 both second mortgage and home equity loan) Houses without a mortgage: 0
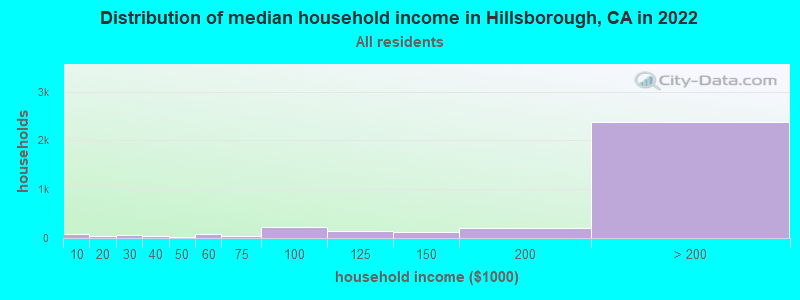
Median household income for houses/condos with a mortgage: $258,196
Median household income for apartments without a mortgage: $244,299
Median monthly housing costs: $3,819
Compare current foreclosures near Hillsborough, CA:
Size of family households: 1,028 2-persons, 573 3-persons, 861 4-persons, 290 5-persons, 112 6-persons, 15 7-or-more-persons.
Size of nonfamily households: 366 1-person, 50 2-persons, 17 3-persons.
2,532 married couples with children.
143 single-parent households (75 men, 68 women).
65.1% of residents of Hillsborough speak English at home.
3.5% of residents speak Spanish at home (90% speak English very well, 8% speak English well, 2% speak English not well).
7.8% of residents speak other Indo-European language at home (95% speak English very well, 3% speak English well, 2% speak English not well).
21.9% of residents speak Asian or Pacific Island language at home (72% speak English very well, 20% speak English well, 5% speak English not well, 3% don't speak English at all).
1.9% of residents speak other language at home (100% speak English very well).
Foreign born population: 2,887 (26.5%)
(77.1% of them are naturalized citizens)
Percentage of workers working in this county: 72.7% Number of people working at home: 1,710 (36.6% of all workers)
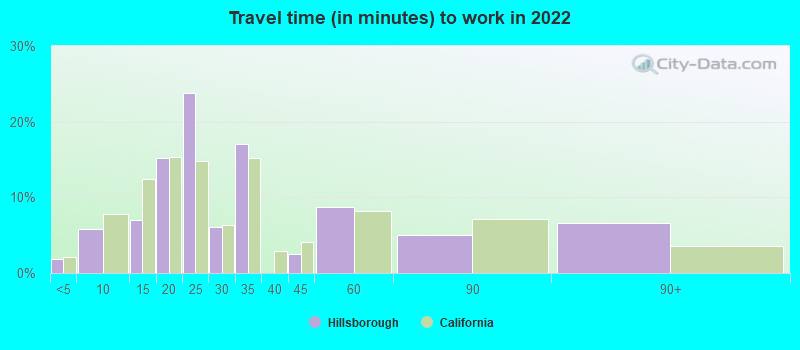
Travel time to work (commute)
Less than 5 minutes: 56
5 to 9 minutes: 177
10 to 14 minutes: 387
15 to 19 minutes: 614
20 to 24 minutes: 300
25 to 29 minutes: 168
30 to 34 minutes: 484
35 to 39 minutes: 311
40 to 44 minutes: 129
45 to 59 minutes: 234
60 to 89 minutes: 181
90 or more minutes: 71
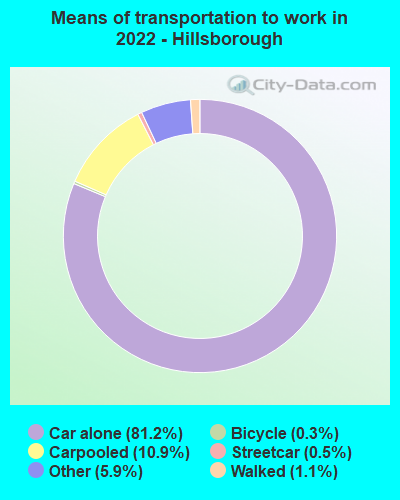
Means of transportation to work:
Drove a car alone: 1,384 (43.8%)
Carpooled: 204 (6.4%)
Subway or elevated rail: 7 (0.2%)
Taxi: 82 (2.6%)
Bicycle: 6 (0.2%)
Walked: 22 (0.7%)
Worked at home: 1,710 (54.1%)
Unemployment by race in 2022
Unemployment rate for White non-Hispanic residents
5.9%Males
2.4%Females
Unemployment rate for Asian residents
1.7%Males
4.2%Females
Unemployment rate for other race residents
55.3%Males
Unemployment rate for two or more race residents
2.8%Males
Year of entry for the foreign-born population in Hillsborough, California
3932010 or later
3652000 to 2009
5091990 to 1999
5541980 to 1989
7361970 to 1979
883Before 1970
First ancestries reported:
English: 333 (5.9%)
Irish: 253 (4.5%)
German: 217 (3.8%)
Italian: 215 (3.8%)
European: 167 (3.0%)
American: 153 (2.7%)
Iranian: 108 (1.9%)
Eastern European: 58 (1.0%)
Polish: 36 (0.6%)
Hungarian: 31 (0.5%)
Lebanese: 28 (0.5%)
Israeli: 23 (0.4%)
Egyptian: 21 (0.4%)
Portuguese: 21 (0.4%)
Scottish: 21 (0.4%)
French: 19 (0.3%)
Lithuanian: 17 (0.3%)
Danish: 17 (0.3%)
British: 16 (0.3%)
Norwegian: 16 (0.3%)
Northern European: 12 (0.2%)
Scandinavian: 12 (0.2%)
Serbian: 12 (0.2%)
Basque: 11 (0.2%)
Assyrian: 10 (0.2%)
Romanian: 10 (0.2%)
Ukrainian: 10 (0.2%)
Brazilian: 9 (0.2%)
Greek: 9 (0.2%)
Dutch: 9 (0.2%)
Swiss: 9 (0.2%)
Belgian: 7 (0.1%)
Russian: 7 (0.1%)
Slovak: 7 (0.1%)
Australian: 6 (0.1%)
Armenian: 5 (0.09%)
Most common places of birth for foreign-born residents (%):
China, excluding Hong Kong and Taiwan
Hillsborough:
28.2% (826)
California:
6.6% (684,672)
India
Hillsborough:
7.8% (228)
California:
5.2% (539,184)
Taiwan
Hillsborough:
7.3% (212)
California:
1.7% (176,274)
Philippines
Hillsborough:
6.5% (189)
California:
7.8% (818,297)
Hong Kong
Hillsborough:
6.5% (189)
California:
1.0% (105,215)
Ukraine
Hillsborough:
5.1% (150)
California:
0.6% (60,761)
Iran
Hillsborough:
3.3% (97)
California:
2.0% (206,004)
Korea
Hillsborough:
3.2% (93)
California:
3.0% (315,248)
Uzbekistan
Hillsborough:
2.7% (78)
California:
0.1% (5,897)
Japan
Hillsborough:
2.3% (67)
California:
1.0% (103,575)
Colombia
Hillsborough:
2.1% (61)
California:
0.5% (55,249)
Belarus
Hillsborough:
2.0% (59)
California:
0.1% (11,157)
Peru
Hillsborough:
1.9% (57)
California:
0.7% (74,025)
Thailand
Hillsborough:
1.6% (46)
California:
0.6% (65,335)
Vietnam
Hillsborough:
1.5% (45)
California:
4.9% (512,335)
Canada
Hillsborough:
1.5% (44)
California:
1.2% (127,477)
Place of birth for U.S.-born residents:
This state: 5,802
Other state: 2,014
Northeast: 589
Midwest: 787
South: 256
West: 388
90.8% of Hillsborough residents lived in the same house 1 years ago. Out of people who lived in different houses, 40.9% lived in this county. Out of people who lived in different counties, 77.4% lived in California.
Hillsborough:
90.8%
State average:
88.9%
Education attainment for males 25 years and older:
No schooling: 16
Nursery to 4th grade: 6
5th and 6th grade: 0
7th and 8th grade: 0
9th grade: 0
10th grade: 0
11th grade: 0
12th grade, no diploma: 0
High school graduate (or equivalency): 117
Less than 1 year of college: 55
Some college more than 1 year, no degree: 133
Associate degree: 94
Bachelor's degree: 1,098
Master's degree: 1,180
Professional school degree: 682
Doctorate degree: 293
Education attainment for females 25 years and older:
No schooling: 29
Nursery to 4th grade: 0
5th and 6th grade: 3
7th and 8th grade: 28
9th grade: 0
10th grade: 9
11th grade: 0
12th grade, no diploma: 26
High school graduate (or equivalency): 170
Less than 1 year of college: 85
Some college more than 1 year, no degree: 260
Associate degree: 183
Bachelor's degree: 1,356
Master's degree: 1,000
Professional school degree: 535
Doctorate degree: 139
Housing units in structures:
One, detached: 3,769
One, attached: 57
Housing units lacking complete plumbing facilities in 2022: 0.6%
Housing units lacking complete kitchen facilities in 2022: 0.6%
House/condo owner moved in on average 15 years ago