Manteca, CA (California) Houses and Residents
| Manteca: | $572,400 |
| California: | $715,900 |
Total population: 73,494 (Urban population: 48,727, Rural population: 474 (all nonfarm))
Houses: 27,236 (25,882 occupied: 18,291 owner occupied, 7,591 renter occupied)
| % of renters here: | 29% |
| State: | 44% |
Housing density: 1,712 houses/condos per square mile
Median price asked for vacant for-sale houses and condos in 2022: $630,170.
Median contract rent in 2022: $1,635 (lower quartile is $1,229, upper quartile is $1,969)
Median rent asked for vacant for-rent units in 2022: $1,873
Median gross rent in Manteca, CA in 2022: $1,862
Housing units in Manteca with a mortgage: 12,608 (813 second mortgage, 0 home equity loan, 731 both second mortgage and home equity loan)
Houses without a mortgage: 174
Median household income for houses/condos with a mortgage: $114,771
Median household income for apartments without a mortgage: $78,496
Median monthly housing costs: $1,879
Compare current foreclosures in Manteca, CA:
| Photo | Address | Area | Beds / Baths | Price | Details |
|---|---|---|---|---|---|

|
#1
Fern Dell Ln
Manteca, CA 95336
|
1,343 sq. feet
|
2 baths 4 beds |
show details | |

|
#2
Jason St
Manteca, CA 95336
|
1,194 sq. feet
|
2 baths 3 beds |
show details | |

|
#3
Countryside Ln
Manteca, CA 95337
|
2,606 sq. feet
|
3 baths 4 beds |
show details | |

|
#4
Sapphire Way
Manteca, CA 95336
|
1,136 sq. feet
|
2 baths 3 beds |
show details | |

|
#5
Vasconcellos Ave
Manteca, CA 95336
|
3,305 sq. feet
|
3 baths 5 beds |
show details | |

|
#6
Ginger Way
Manteca, CA 95336
|
1,402 sq. feet
|
2 baths 3 beds |
show details | |

|
#7
Hearth Dr
Manteca, CA 95337
|
2,268 sq. feet
|
2 baths 3 beds |
show details | |

|
#8
Amy Way
Manteca, CA 95337
|
2,971 sq. feet
|
3 baths 4 beds |
show details | |

|
#9
Ore St
Manteca, CA 95336
|
1,293 sq. feet
|
1 baths 3 beds |
show details | |

|
#10
Zoe Ln
Manteca, CA 95336
|
2,327 sq. feet
|
3 baths 5 beds |
show details |
| Photo | Address | Area | Beds / Baths | Price | Details |
|---|---|---|---|---|---|

|
#11
Mitchell Ln
Manteca, CA 95336
|
1,499 sq. feet
|
2 baths 3 beds |
show details | |

|
#12
Huntington Pl
Manteca, CA 95336
|
1,727 sq. feet
|
2 baths 3 beds |
show details | |

|
#13
Oldham Pl
Manteca, CA 95336
|
1,156 sq. feet
|
2 baths 3 beds |
show details | |

|
#14
Hacienda Ave
Manteca, CA 95336
|
1,938 sq. feet
|
2 baths 4 beds |
show details | |

|
#15
S Walnut Ave
Manteca, CA 95337
|
1,258 sq. feet
|
1 baths 2 beds |
show details | |

|
#16
Vin Rose Way
Manteca, CA 95337
|
1,720 sq. feet
|
2 baths 4 beds |
show details | |

|
#17
Ericwood Ct
Manteca, CA 95336
|
1,298 sq. feet
|
2 baths 3 beds |
show details | |

|
#18
Slayton Dr
Manteca, CA 95336
|
1,862 sq. feet
|
2 baths 3 beds |
show details | |

|
#19
Fishback Rd
Manteca, CA 95337
|
2,521 sq. feet
|
3 baths 5 beds |
show details | |

|
#20
Katherine Pl
Manteca, CA 95337
|
4,044 sq. feet
|
3 baths 5 beds |
show details |
| Photo | Address | Area | Beds / Baths | Price | Details |
|---|---|---|---|---|---|

|
#21
Valenzuela Ct
Manteca, CA 95336
|
3,305 sq. feet
|
3 baths 4 beds |
show details | |

|
#22
Scenic Pl
Manteca, CA 95337
|
1,388 sq. feet
|
2 baths 2 beds |
show details | |

|
#23
Springbrook Way
Manteca, CA 95336
|
1,525 sq. feet
|
2 baths 3 beds |
show details | |

|
#24
Souza Blvd
Manteca, CA 95336
|
1,749 sq. feet
|
2 baths 3 beds |
show details | |

|
#25
Zurich Dr
Manteca, CA 95337
|
2,780 sq. feet
|
2 baths 6 beds |
show details | |

|
#26
W Edison St
Manteca, CA 95336
|
1,395 sq. feet
|
1 baths 3 beds |
show details | |

|
#27
Montezuma Way
Manteca, CA 95336
|
1,265 sq. feet
|
2 baths 3 beds |
show details | |

|
#28
Aurora Ct
Manteca, CA 95336
|
1,581 sq. feet
|
2 baths 3 beds |
show details | |

|
#29
Piedmont Dr
Manteca, CA 95336
|
3,074 sq. feet
|
2 baths 4 beds |
show details | |

|
#30
Sapphire Way
Manteca, CA 95336
|
1,670 sq. feet
|
2 baths 3 beds |
show details |
| Photo | Address | Area | Beds / Baths | Price | Details |
|---|---|---|---|---|---|

|
#31
Marsh Creek Ln
Manteca, CA 95336
|
2,969 sq. feet
|
2 baths 4 beds |
show details | |

|
#32
Sonora Ave
Manteca, CA 95337
|
1,200 sq. feet
|
2 baths 3 beds |
show details | |

|
#33
S Union Rd
Manteca, CA 95337
|
1,457 sq. feet
|
2 baths 3 beds |
show details | |

|
#34
Cooper Dr
Manteca, CA 95336
|
1,155 sq. feet
|
2 baths 3 beds |
show details | |

|
#35
Zurich Dr
Manteca, CA 95337
|
2,780 sq. feet
|
2 baths 6 beds |
show details | |

|
#36
Del Monte Ct
Manteca, CA 95336
|
1,508 sq. feet
|
2 baths 4 beds |
show details | |

|
#37
Hacienda Ave
Manteca, CA 95336
|
1,496 sq. feet
|
2 baths 4 beds |
show details | |

|
#38
Yorktown Ln
Manteca, CA 95336
|
1,654 sq. feet
|
2 baths 3 beds |
show details | |

|
#39
La Scala Way
Manteca, CA 95337
|
2,580 sq. feet
|
3 baths 5 beds |
show details | |

|
#40
Park Ave
Manteca, CA 95337
|
1,027 sq. feet
|
1 baths 3 beds |
show details |
| Photo | Address | Area | Beds / Baths | Price | Details |
|---|---|---|---|---|---|

|
#41
Purple Martin Ln
Manteca, CA 95337
|
2,428 sq. feet
|
2 baths 4 beds |
show details | |

|
#42
Alfonso Ln
Manteca, CA 95336
|
2,639 sq. feet
|
3 baths 5 beds |
show details | |

|
#43
Greenlaven St
Manteca, CA 95336
|
1,443 sq. feet
|
2 baths 3 beds |
show details | |

|
#44
Lucio St
Manteca, CA 95336
|
2,639 sq. feet
|
3 baths 5 beds |
show details | |

|
#45
Poplar Ave
Manteca, CA 95336
|
1,430 sq. feet
|
2 baths 3 beds |
show details | |

|
#46
Davis Street
Manteca, CA 95336
|
1,876 sq. feet
|
2 baths 4 beds |
show details | |

|
#47
Windsor Pl
Manteca, CA 95336
|
1,470 sq. feet
|
2 baths 3 beds |
show details | |

|
#48
Primrose Ave
Manteca, CA 95337
|
3,351 sq. feet
|
3 baths 5 beds |
show details | |

|
#49
Topiary Dr
Manteca, CA 95337
|
1,847 sq. feet
|
2 baths 4 beds |
show details | |

|
Check over 1 million property listings on Foreclosure.com!
|
browse all offers | |||

Latest news about housing in Manteca, CA collected exclusively by city-data.com from local newspapers, TV, and radio stations


Median year apartment built: 1988
Household type by relationship:
Households: 86,940- Male householders: 13,558 (1,503 living alone), Female householders: 12,324 (2,784 living alone)
15,119 spouses (15,006 opposite-sex spouses), 2,616 unmarried partners, (2,559 opposite-sex unmarried partners), 28,896 children (27,256 natural, 488 adopted, 1,152 stepchildren), 4,646 grandchildren, 1,577 brothers or sisters, 2,512 parents, 0 foster children, 2,966 other relatives, 2,213 non-relatives
- In group quarters: 513
Size of family households: 6,193 2-persons, 5,710 3-persons, 3,791 4-persons, 2,363 5-persons, 743 6-persons, 1,770 7-or-more-persons.
Size of nonfamily households: 4,287 1-person, 816 2-persons, 166 4-persons, 43 5-persons.
13,204 married couples with children.
5,403 single-parent households (1,841 men, 3,562 women).
64.9% of residents of Manteca speak English at home.
20.4% of residents speak Spanish at home (65% speak English very well, 19% speak English well, 11% speak English not well, 4% don't speak English at all).
6.6% of residents speak other Indo-European language at home (66% speak English very well, 16% speak English well, 16% speak English not well, 2% don't speak English at all).
6.8% of residents speak Asian or Pacific Island language at home (58% speak English very well, 25% speak English well, 15% speak English not well, 2% don't speak English at all).
0.4% of residents speak other language at home (46% speak English very well, 43% speak English well, 11% speak English not well).
Foreign born population: 19,469 (22.4%)
(63.6% of them are naturalized citizens)
| Here: | 6.1 |
| State: | 6.0 |
| Here: | 4.8 |
| State: | 3.9 |

- Bedrooms in owner-occupied houses and condos in Manteca, California
- 351no bedroom
- 411 bedroom
- 1,7862 bedrooms
- 8,0693 bedrooms
- 5,9064 bedrooms
- 2,1385+ bedrooms

- Bedrooms in renter-occupied apartments in Manteca, California
- 604no bedroom
- 7061 bedroom
- 2,4302 bedrooms
- 2,7313 bedrooms
- 1,0194 bedrooms
- 1015+ bedrooms

- Cars and other vehicles available in Manteca in owner-occupied houses/condos
- 433no vehicle
- 3,1721 vehicle
- 6,9132 vehicles
- 4,8633 vehicles
- 1,8884 vehicles
- 1,0225+ vehicles

- Cars and other vehicles available in Manteca in renter-occupied apartments
- 711no vehicle
- 1,6841 vehicle
- 2,8562 vehicles
- 1,3833 vehicles
- 4694 vehicles
- 4885+ vehicles

- Rooms in owner-occupied houses in Manteca, California
- 3511 room
- 412 rooms
- 3873 rooms
- 1,4064 rooms
- 3,9935 rooms
- 5,0516 rooms
- 2,4667 rooms
- 2,1078 rooms
- 2,4899+ rooms

- Rooms in renter-occupied apartments in Manteca, California
- 6041 room
- 3382 rooms
- 1,0963 rooms
- 1,3214 rooms
- 1,5235 rooms
- 1,3626 rooms
- 5047 rooms
- 6098 rooms
- 2349+ rooms


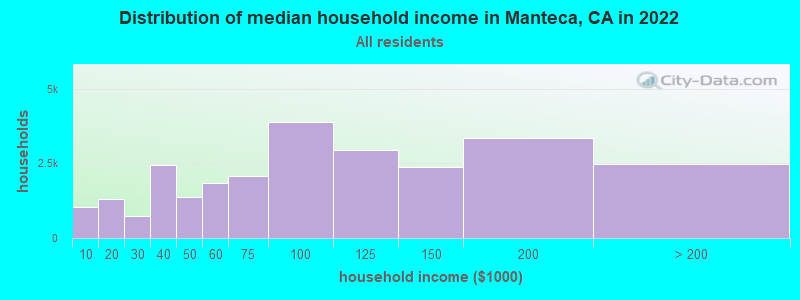
Manteca, CA household income distribution

- 1,026Less than $10,000
- 1,296$10,000 to $19,999
- 746$20,000 to $29,999
- 2,450$30,000 to $39,999
- 1,364$40,000 to $49,999
- 1,829$50,000 to $59,999
- 2,094$60,000 to $74,999
- 3,891$75,000 to $99,999
- 2,948$100,000 to $124,999
- 2,389$125,000 to $149,999
- 3,354$150,000 to $199,999
- 2,495$200,000 or more
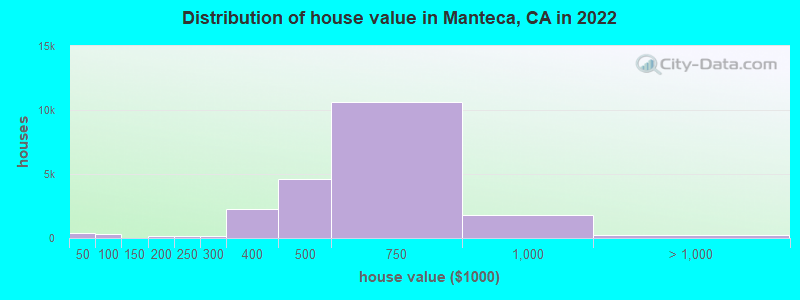
Home value of owner - occupied houses in 2022 in Manteca, CA
-
- 110Less than $10,000
- 33$20,000 to $24,999
- 97$25,000 to $29,999
- 6$30,000 to $34,999
- 24$35,000 to $39,999
- 140$40,000 to $49,999
- 88$50,000 to $59,999
- 43$60,000 to $69,999
- 38$70,000 to $79,999
- 4$80,000 to $89,999
- 7$90,000 to $99,999
- 22$100,000 to $124,999
- 7$125,000 to $149,999
- 119$150,000 to $174,999
- 58$175,000 to $199,999
- 134$200,000 to $249,999
- 120$250,000 to $299,999
- 2,289$300,000 to $399,999
- 4,595$400,000 to $499,999
- 10,626$500,000 to $749,999
- 1,832$750,000 to $999,999
- 176$1,000,000 to $1,499,999
- 49$2,000,000 or more
Rent paid by renters in 2022 in Manteca, CA
-
- 53$250 to $299
- 116$300 to $349
- 47$350 to $399
- 12$500 to $549
- 8$550 to $599
- 16$600 to $649
- 89$650 to $699
- 205$700 to $749
- 215$750 to $799
- 133$800 to $899
- 257$900 to $999
- 958$1,000 to $1,249
- 931$1,250 to $1,499
- 2,910$1,500 to $1,999
- 1,212$2,000 to $2,499
- 148$2,500 to $2,999
- 115$3,000 to $3,499
- 106$3,500 or more
- 317No cash rent

Percentage of workers working in this county: 71.1%
Number of people working at home: 4,410 (11.7% of all workers)
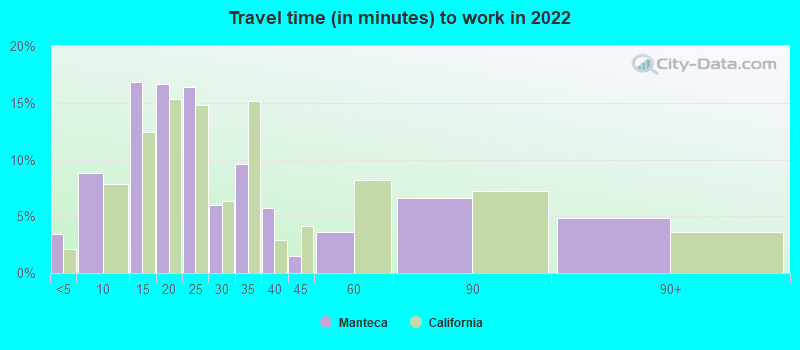
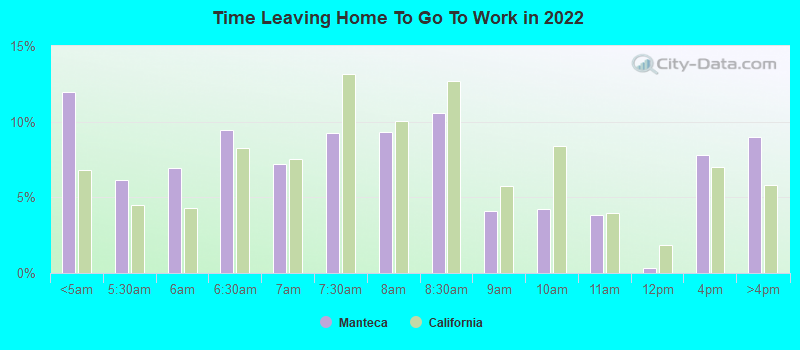
Travel time to work (commute)
- Less than 5 minutes: 1,363
- 5 to 9 minutes: 1,848
- 10 to 14 minutes: 4,879
- 15 to 19 minutes: 5,022
- 20 to 24 minutes: 3,494
- 25 to 29 minutes: 2,015
- 30 to 34 minutes: 3,797
- 35 to 39 minutes: 611
- 40 to 44 minutes: 739
- 45 to 59 minutes: 2,592
- 60 to 89 minutes: 1,858
- 90 or more minutes: 3,376

Means of transportation to work:
- Drove a car alone: 16,858 (68.8%)
- Carpooled: 2,961 (12.1%)
- Taxi: 367 (1.5%)
- Bicycle: 67 (0.3%)
- Walked: 279 (1.1%)
- Worked at home: 4,410 (18.0%)
- Unemployment by race in 2022
- Unemployment rate for White non-Hispanic residents
- 1.1%Males
- 4.4%Females
- Unemployment rate for Black residents
- 6.4%Males
- 4.5%Females
- Unemployment rate for American Indian and Alaska Native residents
- 6.1%Males
- 7.3%Females
- Unemployment rate for Asian residents
- 4.9%Males
- 2.8%Females
- Unemployment rate for other race residents
- 5.1%Males
- 8.4%Females
- Unemployment rate for two or more race residents
- 6.1%Males
- 5.5%Females
- Unemployment rate for Hispanic or Latino residents
- 6.5%Males
- 10.4%Females

- Year of entry for the foreign-born population in Manteca, California
- 5,1242010 or later
- 3,9922000 to 2009
- 3,9141990 to 1999
- 1,2641980 to 1989
- 9871970 to 1979
- 1,106Before 1970

First ancestries reported:
- English: 1,896 (4.0%)
- German: 1,774 (3.8%)
- Italian: 1,518 (3.2%)
- American: 1,203 (2.6%)
- Irish: 1,155 (2.5%)
- Portuguese: 965 (2.1%)
- European: 751 (1.6%)
- Polish: 353 (0.8%)
- Norwegian: 309 (0.7%)
- Eastern European: 246 (0.5%)
- Afghan: 198 (0.4%)
- French: 145 (0.3%)
- Scottish: 135 (0.3%)
- Dutch: 111 (0.2%)
- Swedish: 99 (0.2%)
- Greek: 95 (0.2%)
- African: 83 (0.2%)
- Swiss: 77 (0.2%)
- Russian: 73 (0.2%)
- Palestinian: 68 (0.1%)
- Scotch-Irish: 68 (0.1%)
- British: 64 (0.1%)
- Danish: 62 (0.1%)
- Hungarian: 59 (0.1%)
- Canadian: 46 (0.10%)
- Northern European: 44 (0.09%)
- Maltese: 42 (0.09%)
- French Canadian: 38 (0.08%)
- Basque: 36 (0.08%)
- Assyrian: 34 (0.07%)
- Finnish: 27 (0.06%)
- Slovak: 24 (0.05%)
- Lebanese: 21 (0.04%)
- Pennsylvania German: 19 (0.04%)
- Trinidadian and Tobagonian: 19 (0.04%)
- Bulgarian: 14 (0.03%)
- Jordanian: 13 (0.03%)
- Armenian: 11 (0.02%)
- Celtic: 10 (0.02%)
- Welsh: 9 (0.02%)
- Nigerian: 9 (0.02%)
- Iranian: 8 (0.02%)
- Czechoslovakian: 5 (0.01%)
- Czech: 5 (0.01%)
- Ethiopian: 5 (0.01%)
Most common places of birth for foreign-born residents (%):
| Manteca: | 37.1% (6,347) |
| California: | 37.2% (3,881,193) |
| Manteca: | 20.8% (3,558) |
| California: | 5.2% (539,184) |
| Manteca: | 16.9% (2,898) |
| California: | 7.8% (818,297) |
| Manteca: | 3.0% (518) |
| California: | 0.3% (33,937) |
| Manteca: | 2.1% (358) |
| California: | 0.5% (53,260) |
| Manteca: | 1.9% (318) |
| California: | 0.2% (25,462) |
| Manteca: | 1.8% (308) |
| California: | 0.7% (74,025) |
Place of birth for U.S.-born residents:
- This state: 58,161
- Other state: 6,846
- Northeast: 1,381
- Midwest: 1,567
- South: 1,584
- West: 2,314
88.9% of Manteca residents lived in the same house 1 years ago.
Out of people who lived in different houses, 35.0% lived in this county.
Out of people who lived in different counties, 95.1% lived in California.
| Manteca: | 88.9% |
| State average: | 88.9% |
Education attainment for males 25 years and older:
- No schooling: 626
- Nursery to 4th grade: 567
- 5th and 6th grade: 416
- 7th and 8th grade: 396
- 9th grade: 282
- 10th grade: 361
- 11th grade: 414
- 12th grade, no diploma: 2,020
- High school graduate (or equivalency): 8,578
- Less than 1 year of college: 2,468
- Some college more than 1 year, no degree: 3,475
- Associate degree: 2,757
- Bachelor's degree: 2,661
- Master's degree: 1,066
- Professional school degree: 598
- Doctorate degree: 495

Education attainment for females 25 years and older:
- No schooling: 1,228
- Nursery to 4th grade: 62
- 5th and 6th grade: 421
- 7th and 8th grade: 359
- 9th grade: 169
- 10th grade: 170
- 11th grade: 410
- 12th grade, no diploma: 776
- High school graduate (or equivalency): 8,322
- Less than 1 year of college: 3,003
- Some college more than 1 year, no degree: 3,826
- Associate degree: 3,403
- Bachelor's degree: 4,456
- Master's degree: 1,944
- Professional school degree: 412
- Doctorate degree: 61


Housing units in structures:
- One, detached: 22,851
- One, attached: 557
- Two: 166
- 3 or 4: 506
- 5 to 9: 1,096
- 10 to 19: 469
- 20 to 49: 540
- 50 or more: 579
- Mobile homes: 472
Median worth of mobile homes: $106,000
House/condo owner moved in on average 9 years ago
Renter moved in on average 4 years ago

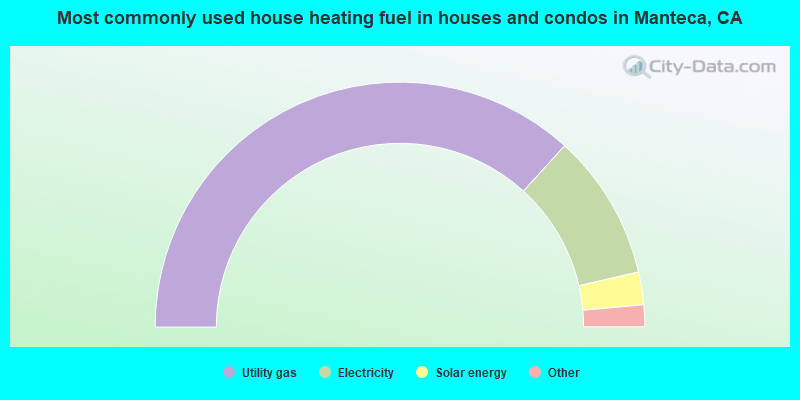
- 73.5%Utility gas
- 19.3%Electricity
- 4.3%Solar energy
- 1.2%Wood
- 1.0%Bottled, tank, or LP gas
- 0.4%No fuel used
- 0.3%Other fuel
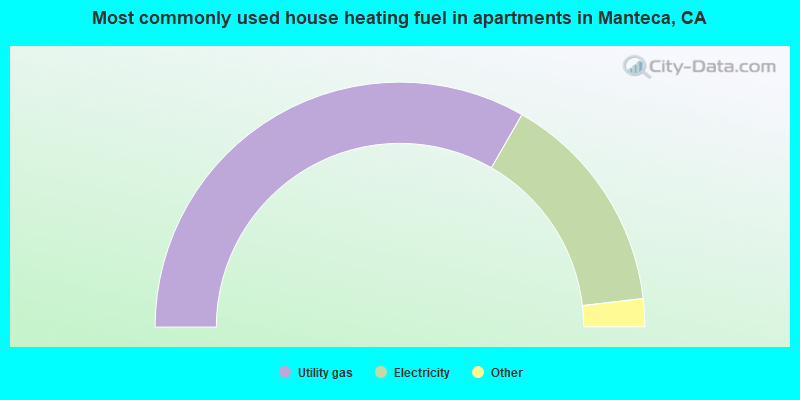
- 66.6%Utility gas
- 29.7%Electricity
- 1.7%Bottled, tank, or LP gas
- 1.0%Solar energy
- 0.4%Wood
- 0.4%No fuel used
- 0.1%Other fuel
Private vs. public school enrollment:
| Here: | 4.7% |
| California: | 10.5% |
| Here: | 3.6% |
| California: | 8.5% |
| Here: | 14.5% |
| California: | 15.9% |