Mount Pleasant, WI (Wisconsin) Houses and Residents
Estimated median house or condo value in 2022: $266,910 (it was $128,300 in 2000 )
Mount Pleasant:
$266,910Wisconsin:
$252,800
Lower value quartile - upper value quartile: $179,079 - $366,563Mean price in 2022: Detached houses: $357,634 Here:
$357,634State:
$308,468
Townhouses or other attached units: $265,887 Here:
$265,887State:
$265,873
In 2-unit structures: $141,590 Here:
$141,590State:
$203,667
In 3-to-4-unit structures: $258,268 Here:
$258,268State:
$216,833
In 5-or-more-unit structures: $113,939 Here:
$113,939State:
$280,537
Total population: 26,293 (Urban population: 21,755, Rural population: 1,362 (54 farm, 1,308 nonfarm ))
Houses: 12,256 (11,752 occupied: 9,156 owner occupied, 2,474 renter occupied )
% of renters here:
21%State:
32%
Housing density: 351 houses/condos per square mile
Median price asked for vacant for-sale houses and condos in 2022: $180,723.
Median contract rent in 2022: $894 (lower quartile is $713, upper quartile is $1,104)
Median rent asked for vacant for-rent units in 2022: $2,271
Median gross rent in Mount Pleasant, WI in 2022: $1,017
Housing units in Mount Pleasant with a mortgage: 5,995 (790 second mortgage, 22 home equity loan, 761 both second mortgage and home equity loan )Houses without a mortgage: 159
Median household income for houses/condos with a mortgage: $97,442
Median household income for apartments without a mortgage: $71,158
Median monthly housing costs: $1,126
Data:
Median house or condo value ($)
Median house or condo value ($ change since 2000)
Median house or condo value ($) - White
Median house or condo value ($) - Black or African American
Median house or condo value ($) - Asian
Median house or condo value ($) - Hispanic or Latino
Median house or condo value ($) - American Indian and Alaska Native
Median house or condo value ($) - Multirace
Median house or condo value ($) - Other Race
Median price asked for mobile homes ($)
Household density (households per square mile)
Mean house or condo value by units in structure - 1, detached ($)
Mean house or condo value by units in structure - 1, attached ($)
Mean house or condo value by units in structure - 2 ($)
Mean house or condo value by units in structure by units in structure - 3 or 4 ($)
Mean house or condo value by units in structure - 5 or more ($)
Mean house or condo value by units in structure - Boat, RV, van, etc. ($)
Mean house or condo value by units in structure - Mobile home ($)
Median contract rent ($)
Median contract rent - Lower quartile ($)
Median contract rent - Upper quartile ($)
Median gross rent ($)
Urban houses (%)
Rural houses (%)
Houses occupied (%)
Houses occupied (% change since 2000)
Houses owner occupied (%)
Houses owner occupied (% change since 2000)
Houses renter occupied (%)
Houses renter occupied (% change since 2000)
Vacant housing units - For rent (%)
Vacant housing units - For rent (% change since 2000)
Vacant housing units - For sale only (%)
Vacant housing units - For sale only (% change since 2000)
Vacant housing units - Rented or sold, not occupied (%)
Vacant housing units - Rented or sold, not occupied (% change since 2000)
Vacant housing units - For seasonal, recreational, or occasional use (%)
Vacant housing units - For seasonal, recreational, or occasional use (% change since 2000)
Vacant housing units - For migrant workers (%)
Vacant housing units - For migrant workers (% change since 2000)
Vacant housing units - Other vacant (%)
Vacant housing units - Other vacant (% change since 2000)
Median monthly housing costs ($)
Median household income for houses/condos with a mortgage ($)
Median household income for houses/condos without a mortgage ($)
Median household income ($)
Median household income ($) - White
Median household income ($) - Black or African American
Median household income ($) - Asian
Median household income ($) - Hispanic or Latino
Median household income ($) - American Indian and Alaska Native
Median household income ($) - Multirace
Median household income ($) - Other Race
Mortgage status - with mortgage (%)
Mortgage status - with second mortgage (%)
Mortgage status - with home equity loan (%)
Mortgage status - with both second mortgage and home equity loan (%)
Mortgage status - without a mortgage (%)
Median year house/condo built
Median year apartment built
Household type by relationship - Male householder living alone (%)
Household type by relationship - Male householder not living alone (%)
Household type by relationship - Female householder living alone (%)
Household type by relationship - Female householder not living alone (%)
Household type by relationship - Opposite-Sex spouse (%)
Household type by relationship - Same-Sex spouse (%)
Household type by relationship - Opposite-Sex unmarried partner (%)
Household type by relationship - Same-Sex unmarried partner (%)
Household type by relationship - In group quarters (%)
Size of family households - 2-person household (%)
Size of family households - 3-person household (%)
Size of family households - 4-person household (%)
Size of family households - 5-person household (%)
Size of family households - 6-person household (%)
Size of family households - 7-or-more-person household (%)
Size of nonfamily households - 1-person household (%)
Size of nonfamily households - 2-person household (%)
Size of nonfamily households - 3-person household (%)
Size of nonfamily households - 4-person household (%)
Size of nonfamily households - 5-person household (%)
Size of nonfamily households - 6-person household (%)
Size of nonfamily households - 7-or-moreperson household (%)
Year house built - Built 2010 or later (%)
Year house built - Built 2000 to 2009 (%)
Year house built - Built 1990 to 1999 (%)
Year house built - Built 1980 to 1989 (%)
Year house built - Built 1970 to 1979 (%)
Year house built - Built 1960 to 1969 (%)
Year house built - Built 1950 to 1959 (%)
Year house built - Built 1940 to 1949 (%)
Year house built - Built 1939 or earlier (%)
Median number of rooms in houses and condos
Median number of rooms in apartments
Median number of bedrooms in owner occupied houses
Mean number of bedrooms in owner occupied houses
Median number of bedrooms in renter occupied houses
Mean number of bedrooms in renter occupied houses
Median number of vehichles in owner occupied houses
Mean number of vehichles in owner occupied houses
Median number of vehichles in renter occupied houses
Mean number of vehichles in renter occupied houses
Rooms in owner-occupied houses - 1 room (%)
Rooms in owner-occupied houses - 2 rooms (%)
Rooms in owner-occupied houses - 3 rooms (%)
Rooms in owner-occupied houses - 4 rooms (%)
Rooms in owner-occupied houses - 5 rooms (%)
Rooms in owner-occupied houses - 6 rooms (%)
Rooms in owner-occupied houses - 7 rooms (%)
Rooms in owner-occupied houses - 8 rooms (%)
Rooms in owner-occupied houses - 9+ rooms (%)
Rooms in renter-occupied houses - 1 room (%)
Rooms in renter-occupied houses - 2 rooms (%)
Rooms in renter-occupied houses - 3 rooms (%)
Rooms in renter-occupied houses - 4 rooms (%)
Rooms in renter-occupied houses - 5 rooms (%)
Rooms in renter-occupied houses - 6 rooms (%)
Rooms in renter-occupied houses - 7 rooms (%)
Rooms in renter-occupied houses - 8 rooms (%)
Rooms in renter-occupied houses - 9+ rooms (%)
Bedrooms in owner-occupied houses - no bedrooms (%)
Bedrooms in owner-occupied houses - 1 bedroom (%)
Bedrooms in owner-occupied houses - 2 bedrooms (%)
Bedrooms in owner-occupied houses - 3 bedrooms (%)
Bedrooms in owner-occupied houses - 4 bedrooms (%)
Bedrooms in owner-occupied houses - 5+ bedrooms (%)
Bedrooms in renter-occupied houses - no bedrooms (%)
Bedrooms in renter-occupied houses - 1 bedroom (%)
Bedrooms in renter-occupied houses - 2 bedrooms (%)
Bedrooms in renter-occupied houses - 3 bedrooms (%)
Bedrooms in renter-occupied houses - 4 bedrooms (%)
Bedrooms in renter-occupied houses - 5+ bedrooms (%)
Vehicles available in owner-occupied houses - no vehicle available (%)
Vehicles available in owner-occupied houses - 1 vehicle available(%)
Vehicles available in owner-occupied houses - 2 Vehicles available (%)
Vehicles available in owner-occupied houses - 3 Vehicles available (%)
Vehicles available in owner-occupied houses - 4 Vehicles available (%)
Vehicles available in owner-occupied houses - 5+ Vehicles available (%)
Vehicles available in renter-occupied houses - no vehicle available (%)
Vehicles available in renter-occupied houses - 1 vehicle available (%)
Vehicles available in renter-occupied houses - 2 Vehicles available (%)
Vehicles available in renter-occupied houses - 3 Vehicles available (%)
Vehicles available in renter-occupied houses - 4 Vehicles available (%)
Vehicles available in renter-occupied houses - 5+ Vehicles available (%)
Housing units in structures - 1, detached (%)
Housing units in structures - 1, attached (%)
Housing units in structures - 2 (%)
Housing units in structures - 3 or 4 (%)
Housing units in structures - 5 to 9 (%)
Housing units in structures - 10 to 19 (%)
Housing units in structures - 20 to 49 (%)
Housing units in structures - 50 or more (%)
Housing units in structures - Mobile home (%)
Housing units in structures - Boat, RV, van, etc. (%)
Housing units in structures - Owners - 1, detached (%)
Housing units in structures - Owners - 1, attached (%)
Housing units in structures - Owners - 2 (%)
Housing units in structures - Owners - 3 or 4 (%)
Housing units in structures - Owners - 5 to 9 (%)
Housing units in structures - Owners - 10 to 19 (%)
Housing units in structures - Owners - 20 to 49 (%)
Housing units in structures - Owners - 50 or more (%)
Housing units in structures - Owners - Mobile home (%)
Housing units in structures - Owners - Boat, RV, van, etc. (%)
Housing units in structures - Renters - 1, detached (%)
Housing units in structures - Renters - 1, attached (%)
Housing units in structures - Renters - 2 (%)
Housing units in structures - Renters - 3 or 4 (%)
Housing units in structures - Renters - 5 to 9 (%)
Housing units in structures - Renters - 10 to 19 (%)
Housing units in structures - Renters - 20 to 49 (%)
Housing units in structures - Renters - 50 or more (%)
Housing units in structures - Renters - Mobile home (%)
Housing units in structures - Renters - Boat, RV, van, etc. (%)
House/condo owner moved in on average (years ago)
Renter moved in on average (years ago)
Year householder moved into unit - Moved in 1999 to March 2000 (%)
Year householder moved into unit - Moved in 1999 to March 2000 (%) - White
Year householder moved into unit - Moved in 1999 to March 2000 (%) - Black or African American
Year householder moved into unit - Moved in 1999 to March 2000 (%) - Asian
Year householder moved into unit - Moved in 1999 to March 2000 (%) - Hispanic or Latino
Year householder moved into unit - Moved in 1999 to March 2000 (%) - American Indian and Alaska Native
Year householder moved into unit - Moved in 1999 to March 2000 (%) - Multirace
Year householder moved into unit - Moved in 1999 to March 2000 (%) - Other Race
Year householder moved into unit - Moved in 1995 to 1998 (%)
Year householder moved into unit - Moved in 1995 to 1998 (%) - White
Year householder moved into unit - Moved in 1995 to 1998 (%) - Black or African American
Year householder moved into unit - Moved in 1995 to 1998 (%) - Asian
Year householder moved into unit - Moved in 1995 to 1998 (%) - Hispanic or Latino
Year householder moved into unit - Moved in 1995 to 1998 (%) - American Indian and Alaska Native
Year householder moved into unit - Moved in 1995 to 1998 (%) - Multirace
Year householder moved into unit - Moved in 1995 to 1998 (%) - Other Race
Year householder moved into unit - Moved in 1990 to 1994 (%)
Year householder moved into unit - Moved in 1990 to 1994 (%) - White
Year householder moved into unit - Moved in 1990 to 1994 (%) - Black or African American
Year householder moved into unit - Moved in 1990 to 1994 (%) - Asian
Year householder moved into unit - Moved in 1990 to 1994 (%) - Hispanic or Latino
Year householder moved into unit - Moved in 1990 to 1994 (%) - American Indian and Alaska Native
Year householder moved into unit - Moved in 1990 to 1994 (%) - Multirace
Year householder moved into unit - Moved in 1990 to 1994 (%) - Other Race
Year householder moved into unit - Moved in 1980 to 1989 (%)
Year householder moved into unit - Moved in 1980 to 1989 (%) - White
Year householder moved into unit - Moved in 1980 to 1989 (%) - Black or African American
Year householder moved into unit - Moved in 1980 to 1989 (%) - Asian
Year householder moved into unit - Moved in 1980 to 1989 (%) - Hispanic or Latino
Year householder moved into unit - Moved in 1980 to 1989 (%) - American Indian and Alaska Native
Year householder moved into unit - Moved in 1980 to 1989 (%) - Multirace
Year householder moved into unit - Moved in 1980 to 1989 (%) - Other Race
Year householder moved into unit - Moved in 1970 to 1979 (%)
Year householder moved into unit - Moved in 1970 to 1979 (%) - White
Year householder moved into unit - Moved in 1970 to 1979 (%) - Black or African American
Year householder moved into unit - Moved in 1970 to 1979 (%) - Asian
Year householder moved into unit - Moved in 1970 to 1979 (%) - Hispanic or Latino
Year householder moved into unit - Moved in 1970 to 1979 (%) - American Indian and Alaska Native
Year householder moved into unit - Moved in 1970 to 1979 (%) - Multirace
Year householder moved into unit - Moved in 1970 to 1979 (%) - Other Race
Year householder moved into unit - Moved in 1969 or earlier (%)
Year householder moved into unit - Moved in 1969 or earlier (%) - White
Year householder moved into unit - Moved in 1969 or earlier (%) - Black or African American
Year householder moved into unit - Moved in 1969 or earlier (%) - Asian
Year householder moved into unit - Moved in 1969 or earlier (%) - Hispanic or Latino
Year householder moved into unit - Moved in 1969 or earlier (%) - American Indian and Alaska Native
Year householder moved into unit - Moved in 1969 or earlier (%) - Multirace
Year householder moved into unit - Moved in 1969 or earlier (%) - Other Race
Housing units lacking complete plumbing facilities (%)
Housing units lacking complete kitchen facilities (%)
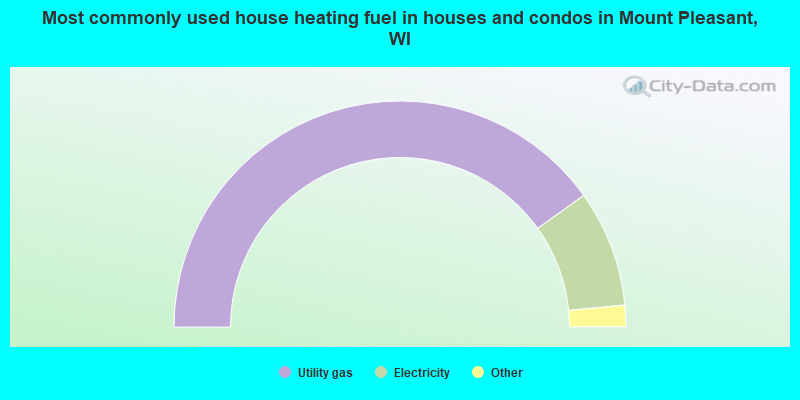
House heating fuel used in houses and condos - Utility gas (%)
House heating fuel used in houses and condos - Bottled, tank, or LP gas (%)
House heating fuel used in houses and condos - Electricity (%)
House heating fuel used in houses and condos - Fuel oil, kerosene, etc. (%)
House heating fuel used in houses and condos - Coal or coke (%)
House heating fuel used in houses and condos - Wood (%)
House heating fuel used in houses and condos - Solar energy (%)
House heating fuel used in houses and condos - Other fuel (%)
House heating fuel used in houses and condos - No fuel used (%)
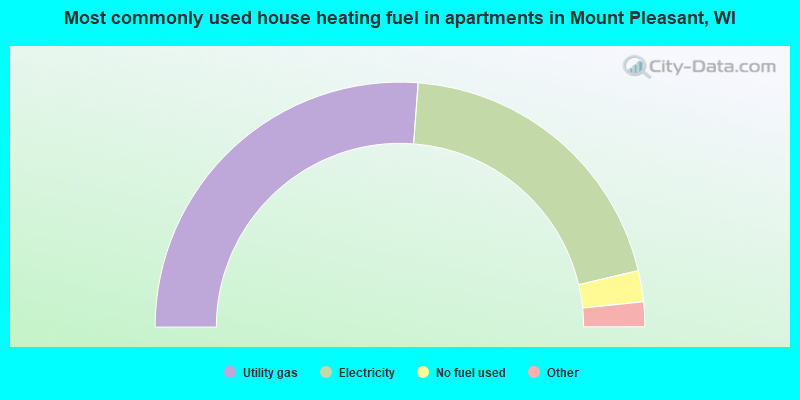
House heating fuel used in apartments - Utility gas (%)
House heating fuel used in apartments - Bottled, tank, or LP gas (%)
House heating fuel used in apartments - Electricity (%)
House heating fuel used in apartments - Fuel oil, kerosene, etc. (%)
House heating fuel used in apartments - Coal or coke (%)
House heating fuel used in apartments - Wood (%)
House heating fuel used in apartments - Solar energy (%)
House heating fuel used in apartments - Other fuel (%)
House heating fuel used in apartments - No fuel used (%)
Median year house/condo built: 1984Median year apartment built: 1981Household type by relationship:
Households: 27,468
Male householders: 5,880 (1,539 living alone ), Female householders: 5,756 (2,075 living alone )6,077 spouses (6,045 opposite-sex spouses ), 868 unmarried partners , (868 opposite-sex unmarried partners ), 6,955 children (6,620 natural , 156 adopted , 178 stepchildren ), 376 grandchildren , 78 brothers or sisters , 70 parents , 0 foster children , 416 other relatives , 649 non-relatives In group quarters: 338
Size of family households: 3,474 2-persons , 1,460 3-persons , 1,064 4-persons , 597 5-persons , 73 6-persons , 108 7-or-more-persons .
Size of nonfamily households: 4,149 1-person , 645 2-persons , 78 3-persons , 33 4-persons , 18 7-or-more-persons .
3,499 married couples with children. single-parent households (460 men , 963 women ).
87.8% of residents of Mount Pleasant speak English at home. of residents speak Spanish at home (67% speak English very well , 21% speak English well , 4% speak English not well , 8% don't speak English at all ).of residents speak other Indo-European language at home (50% speak English very well , 41% speak English well , 6% speak English not well , 3% don't speak English at all ).of residents speak Asian or Pacific Island language at home (55% speak English very well , 45% speak English well ).of residents speak other language at home (92% speak English very well , 8% speak English well ).
Foreign born population: 2,587 (9.4%)of them are naturalized citizens )
Median number of rooms in houses and condos:
Median number of rooms in apartments
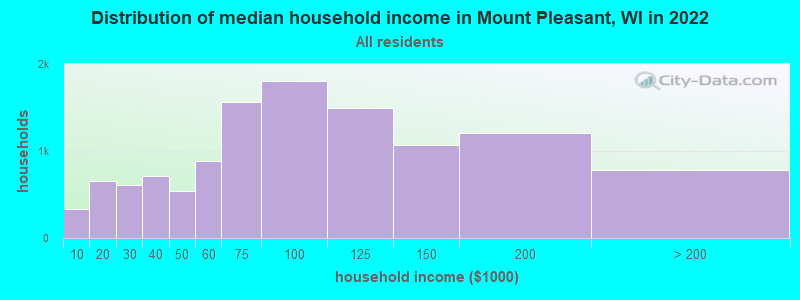
Mount Pleasant, WI household income distribution 328 Less than $10,000654 $10,000 to $19,999607 $20,000 to $29,999707 $30,000 to $39,999544 $40,000 to $49,999880 $50,000 to $59,9991,568 $60,000 to $74,9991,801 $75,000 to $99,9991,496 $100,000 to $124,9991,073 $125,000 to $149,9991,207 $150,000 to $199,999786 $200,000 or more
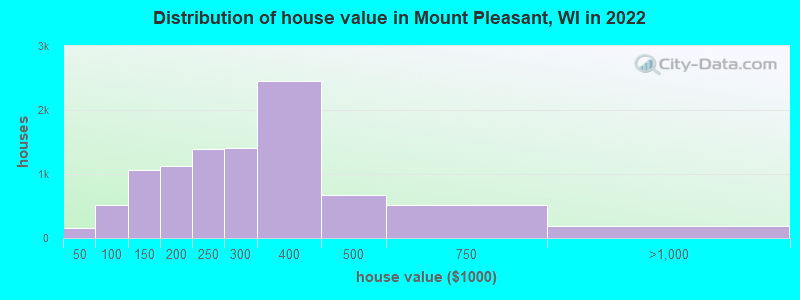
Home value of owner - occupied houses in 2022 in Mount Pleasant, WI 21 Less than $10,00011 $10,000 to $14,99933 $15,000 to $19,99926 $25,000 to $29,9991 $30,000 to $34,99931 $35,000 to $39,99935 $40,000 to $49,9995 $50,000 to $59,999138 $60,000 to $69,999103 $70,000 to $79,999184 $80,000 to $89,99944 $90,000 to $99,999524 $100,000 to $124,999533 $125,000 to $149,999561 $150,000 to $174,999562 $175,000 to $199,9991,391 $200,000 to $249,9991,409 $250,000 to $299,9992,457 $300,000 to $399,999667 $400,000 to $499,999510 $500,000 to $749,999149 $750,000 to $999,99943 $2,000,000 or moreRent paid by renters in 2022 in Mount Pleasant, WI 26 Less than $10014 $100 to $14960 $200 to $24971 $250 to $29929 $300 to $34917 $350 to $3998 $400 to $4492 $450 to $499108 $500 to $54944 $550 to $59941 $600 to $64984 $650 to $699128 $700 to $749143 $750 to $799449 $800 to $899306 $900 to $999461 $1,000 to $1,249117 $1,250 to $1,49956 $1,500 to $1,99910 $2,000 to $2,49937 $2,500 to $2,99913 $3,500 or more192 No cash rent
Percentage of workers working in this county: 68.9%Number of people working at home: 1,578 (11.8% of all workers )
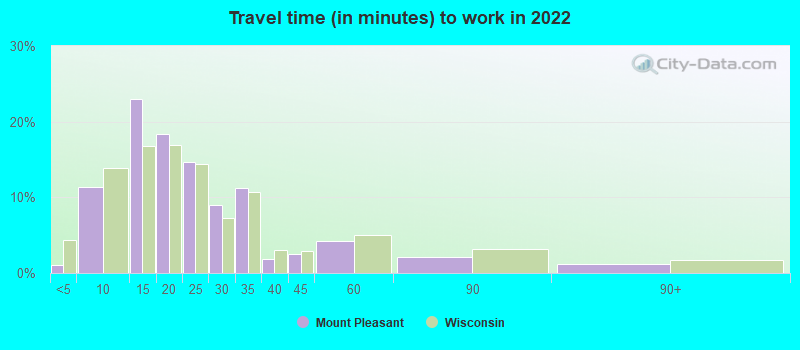
Travel time to work (commute)
Less than 5 minutes: 2425 to 9 minutes: 1,82910 to 14 minutes: 2,57815 to 19 minutes: 2,31620 to 24 minutes: 1,42325 to 29 minutes: 74330 to 34 minutes: 64235 to 39 minutes: 62440 to 44 minutes: 24845 to 59 minutes: 67060 to 89 minutes: 26490 or more minutes: 217
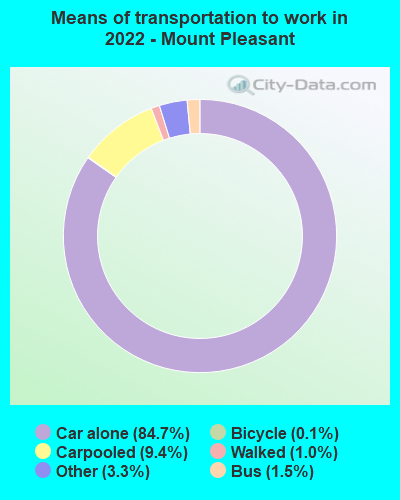
Means of transportation to work:
Drove a car alone: 9,800 (73.9%)Carpooled: 1,431 (10.8%)Bus : 174 (1.3%)Taxi: 446 (3.4%)Bicycle: 15 (0.1%)Walked: 140 (1.1%)Worked at home: 1,578 (11.9%)
Unemployment by race in 2022
Unemployment rate for White non-Hispanic residents 4.0% Males2.0% FemalesUnemployment rate for Black residents 5.0% FemalesUnemployment rate for other race residents 2.0% MalesUnemployment rate for two or more race residents 6.6% Females
Year of entry for the foreign-born population in Mount Pleasant, Wisconsin
827 2010 or later 328 2000 to 2009 957 1990 to 1999 138 1980 to 1989 131 1970 to 1979 384 Before 1970
First ancestries reported:
German: 2,881 (20.9%)
Irish: 787 (5.7%)
Danish: 703 (5.1%)
Polish: 606 (4.4%)
Italian: 524 (3.8%)
English: 466 (3.4%)
American: 361 (2.6%)
Norwegian: 249 (1.8%)
European: 228 (1.7%)
Czech: 161 (1.2%)
French: 150 (1.1%)
Arab: 146 (1.1%)
Australian: 140 (1.0%)
Croatian: 116 (0.8%)
Swedish: 115 (0.8%)
Dutch: 106 (0.8%)
Serbian: 50 (0.4%)
Scandinavian: 49 (0.4%)
French Canadian: 44 (0.3%)
Slovak: 39 (0.3%)
Scottish: 39 (0.3%)
Lithuanian: 38 (0.3%)
Greek: 34 (0.2%)
Ethiopian: 30 (0.2%)
Austrian: 28 (0.2%)
Scotch-Irish: 23 (0.2%)
Egyptian: 21 (0.2%)
Jamaican: 19 (0.1%)
Welsh: 16 (0.1%)
Luxembourger: 14 (0.1%)
African: 14 (0.1%)
Belgian: 14 (0.1%)
Hungarian: 13 (0.09%)
Slovene: 13 (0.09%)
Armenian: 11 (0.08%)
Romanian: 11 (0.08%)
Eastern European: 11 (0.08%)
Swiss: 10 (0.07%)
Ukrainian: 10 (0.07%)
Russian: 9 (0.07%)
Northern European: 9 (0.07%)
Carpatho Rusyn: 7 (0.05%)
Portuguese: 4 (0.03%)
British: 2 (0.01%)
Trinidadian and Tobagonian: 1 (0.01%) Most common places of birth for foreign-born residents (%): Mexico Mount Pleasant:
22.1% (563)Wisconsin:
29.5% (87,182)
Peru Mount Pleasant:
9.9% (252)Wisconsin:
0.7% (1,960)
India Mount Pleasant:
9.4% (238)Wisconsin:
8.0% (23,594)
Venezuela Mount Pleasant:
6.5% (164)Wisconsin:
0.8% (2,302)
Argentina Mount Pleasant:
6.4% (163)Wisconsin:
0.5% (1,622)
Philippines Mount Pleasant:
5.4% (137)Wisconsin:
3.1% (9,280)
China, excluding Hong Kong and Taiwan Mount Pleasant:
3.3% (84)Wisconsin:
5.1% (15,165)
Poland Mount Pleasant:
2.9% (73)Wisconsin:
1.5% (4,321)
Australia Mount Pleasant:
2.5% (64)Wisconsin:
0.3% (937)
Spain Mount Pleasant:
2.3% (59)Wisconsin:
0.3% (935)
Canada Mount Pleasant:
2.3% (58)Wisconsin:
2.3% (6,747)
Germany Mount Pleasant:
2.2% (57)Wisconsin:
3.0% (8,773)
Serbia Mount Pleasant:
2.2% (56)Wisconsin:
0.3% (802)
United Kingdom, excluding England and Scotland Mount Pleasant:
2.1% (53)Wisconsin:
0.8% (2,427)
France Mount Pleasant:
1.7% (42)Wisconsin:
0.3% (858)
Ethiopia Mount Pleasant:
1.6% (40)Wisconsin:
0.4% (1,080)
Taiwan Mount Pleasant:
1.5% (39)Wisconsin:
0.7% (1,987)
Place of birth for U.S.-born residents:
This state: 18,795Other state: 5,970Northeast: 360Midwest: 4,131South: 1,114West: 375 89.0% of Mount Pleasant residents lived in the same house 1 years ago.
Out of people who lived in different houses, 33.6% lived in this county.
Out of people who lived in different counties, 67.3% lived in Wisconsin.
Mount Pleasant:
89.0%State average:
87.7%
Education attainment for males 25 years and older:
No schooling: 58Nursery to 4th grade: 255th and 6th grade: 2047th and 8th grade: 639th grade: 4010th grade: 8911th grade: 11212th grade, no diploma: 178High school graduate (or equivalency): 2,276Less than 1 year of college: 559Some college more than 1 year, no degree: 1,559Associate degree: 895Bachelor's degree: 2,733Master's degree: 719Professional school degree: 196Doctorate degree: 32
Education attainment for females 25 years and older:
No schooling: 137Nursery to 4th grade: 115th and 6th grade: 417th and 8th grade: 849th grade: 1710th grade: 6711th grade: 9112th grade, no diploma: 68High school graduate (or equivalency): 2,398Less than 1 year of college: 972Some college more than 1 year, no degree: 1,355Associate degree: 889Bachelor's degree: 2,827Master's degree: 1,084Professional school degree: 307Doctorate degree: 79
Housing units in structures:
One, detached: 7,884One, attached: 948Two: 2493 or 4: 4435 to 9: 1,13310 to 19: 72920 to 49: 43550 or more: 390Mobile homes: 31Boats, RVs, vans, etc.: 10Housing units lacking complete plumbing facilities in 2022: 0.2%Housing units lacking complete kitchen facilities in 2022: 0.8%House/condo owner moved in on average 12 years ago
Renter moved in on average 3 years ago
Private vs. public school enrollment:
Students in private schools in grades 1 to 8 (elementary and middle school): 565 Here:
26.0%Wisconsin:
16.7%
Students in private schools in grades 9 to 12 (high school): 161 Here:
14.4%Wisconsin:
12.5%
Students in private undergraduate colleges: 105 Here:
11.0%Wisconsin:
17.5%