North Castle, NY (New York) Houses and Residents
| North Castle: | $1,313,356 |
| New York: | $400,400 |
Total population: 11,841 (Urban population: 9,174, Rural population: 1,675 (all nonfarm))
Houses: 3,706 (3,583 occupied: 3,118 owner occupied, 465 renter occupied)
| % of renters here: | 13% |
| State: | 46% |
Housing density: 154 houses/condos per square mile
Median price asked for vacant for-sale houses and condos in 2022 in this county: $406,754.
Median contract rent in 2022: over $2,000 (lower quartile is $1,498, upper quartile is over $2,000)
Median rent asked for vacant for-rent units in 2022: $2,006
Median gross rent in North Castle, NY in 2022: over $2,000
Housing units in North Castle with a mortgage: 2,143 (146 second mortgage, 376 home equity loan, 21 both second mortgage and home equity loan)
Houses without a mortgage: 746
Compare current foreclosures near North Castle, NY:
| Photo | Address | Area | Beds / Baths | Price | Details |
|---|---|---|---|---|---|

|
#1
Midland Ave Apt 4h
Bronxville, NY 10708
|
900 sq. feet
|
1 baths 1 beds |
$184,000
|
show details |

|
#2
Olcott Way # 122
Ridgefield, CT 06877
|
920 sq. feet
|
1 baths 1 beds |
$364,900
|
show details |

|
#3
Sylvan Knoll Rd
Stamford, CT 06902
|
1,100 sq. feet
|
1 baths 2 beds |
$339,900
|
show details |

|
#4
Martin Dr
Harrington Park, NJ 07640
|
1,746 sq. feet
|
3 baths 3 beds |
$950,000
|
show details |

|
#5
Central Park Ave Apt 9m
Yonkers, NY 10710
|
1,300 sq. feet
|
2 baths 3 beds |
$319,900
|
show details |

|
#6
W Sidney Ave
Mount Vernon, NY 10550
|
2,800 sq. feet
|
3 baths 8 beds |
$454,900
|
show details |

|
#7
N Broadway Apt A6
Yonkers, NY 10701
|
950 sq. feet
|
2 baths 2 beds |
$219,900
|
show details |

|
#8
N Broadway
Irvington, NY 10533
|
850 sq. feet
|
1 baths 2 beds |
$315,000
|
show details |

|
#9
Croton Park Rd
Cortlandt Manor, NY 10567
|
658 sq. feet
|
1 baths 1 beds |
$176,900
|
show details |

|
#10
N Riverside Ave
Croton On Hudson, NY 10520
|
1,642 sq. feet
|
2 baths 3 beds |
$585,000
|
show details |
| Photo | Address | Area | Beds / Baths | Price | Details |
|---|---|---|---|---|---|

|
#11
Crane Ave
White Plains, NY 10603
|
2,400 sq. feet
|
2 baths 4 beds |
$654,500
|
show details |

|
#12
Fox Island Rd
Port Chester, NY 10573
|
- sq. feet
|
6 baths 6 beds |
$910,000
|
show details |

|
#13
Davenport Ave Apt 1b
New Rochelle, NY 10805
|
750 sq. feet
|
1 baths 1 beds |
$159,900
|
show details |

|
#14
Chalmers Blvd
Amawalk, NY 10501
|
1,072 sq. feet
|
1 baths 1 beds |
$475,000
|
show details |

|
#15
Riverdale Ave
Port Chester, NY 10573
|
1,616 sq. feet
|
1 baths 3 beds |
$639,900
|
show details |

|
#16
Limerick St
Stamford, CT 06902
|
1,382 sq. feet
|
4 baths 5 beds |
$919,900
|
show details |

|
#17
Talmadge Hill Rd
Darien, CT 06820
|
- sq. feet
|
4 baths 5 beds |
$2,275,250
|
show details |

|
#18
Tuttle St
Stamford, CT 06902
|
- sq. feet
|
1 baths 3 beds |
$262,500
|
show details |

|
#19
Raven Ct
Armonk, NY 10504
|
- sq. feet
|
2 baths 3 beds |
$1,560,000
|
show details |

|
#20
Tempo Rd
New City, NY 10956
|
- sq. feet
|
1 baths 3 beds |
$799,900
|
show details |
| Photo | Address | Area | Beds / Baths | Price | Details |
|---|---|---|---|---|---|

|
#21
County Center Rd
White Plains, NY 10603
|
- sq. feet
|
2 baths 3 beds |
$540,800
|
show details |

|
#22
Clinton Ln
Spring Valley, NY 10977
|
3,137 sq. feet
|
3 baths 6 beds |
show details | |

|
#23
Washington Ave
New Rochelle, NY 10801
|
2,445 sq. feet
|
3 baths 8 beds |
show details | |

|
#24
Kenneth Rd
Hartsdale, NY 10530
|
1,325 sq. feet
|
2 baths 3 beds |
show details | |

|
#25
Oxford Rd
New Rochelle, NY 10804
|
5,000 sq. feet
|
5 baths 6 beds |
show details | |

|
#26
Dairy Farm Rd
Norwalk, CT 06851
|
1,200 sq. feet
|
3 baths 3 beds |
show details | |

|
#27
William St
Ossining, NY 10562
|
1,160 sq. feet
|
2 baths 3 beds |
show details | |

|
#28
Walter St
Tarrytown, NY 10591
|
1,250 sq. feet
|
2 baths 3 beds |
show details | |

|
#29
Diamondcrest Ln
Stamford, CT 06903
|
1,442 sq. feet
|
2 baths 3 beds |
show details | |

|
#30
Silvermine Rd
New Canaan, CT 06840
|
2,627 sq. feet
|
3 baths 3 beds |
show details |
| Photo | Address | Area | Beds / Baths | Price | Details |
|---|---|---|---|---|---|

|
#31
Fox Island Rd
Port Chester, NY 10573
|
1,174 sq. feet
|
2 baths 2 beds |
show details | |

|
#32
John St
Ossining, NY 10562
|
1,536 sq. feet
|
2 baths 4 beds |
show details | |

|
#33
Travis Ave
Stamford, CT 06905
|
2,198 sq. feet
|
3 baths 3 beds |
show details | |

|
#34
Pipers Hill Rd
Wilton, CT 06897
|
3,526 sq. feet
|
4 baths 5 beds |
show details | |

|
#35
Broad Ave
Ossining, NY 10562
|
2,128 sq. feet
|
2 baths 5 beds |
show details | |

|
#36
Croton Ave
Ossining, NY 10562
|
3,274 sq. feet
|
3 baths 6 beds |
show details | |

|
#37
Lawrence Pl
Yonkers, NY 10701
|
1,856 sq. feet
|
4 baths 3 beds |
show details | |

|
#38
Oak St
Yonkers, NY 10701
|
1,250 sq. feet
|
2 baths 3 beds |
show details | |

|
#39
Parmly Ct
Mohegan Lake, NY 10547
|
480 sq. feet
|
1 baths 2 beds |
show details | |

|
#40
Dexter Rd
Yonkers, NY 10710
|
2,502 sq. feet
|
2 baths 4 beds |
show details |
| Photo | Address | Area | Beds / Baths | Price | Details |
|---|---|---|---|---|---|

|
#41
Palisade Ave
White Plains, NY 10607
|
1,272 sq. feet
|
2 baths 4 beds |
show details | |

|
#42
White Oak Shade Rd
New Canaan, CT 06840
|
3,336 sq. feet
|
5 baths 4 beds |
show details | |

|
#43
Cutler Rd
Greenwich, CT 06831
|
4,702 sq. feet
|
5 baths 5 beds |
show details | |

|
#44
Bridge St Apt 10
Stamford, CT 06905
|
1,325 sq. feet
|
2 baths 2 beds |
show details | |

|
#45
Thomas St
Scarsdale, NY 10583
|
8,400 sq. feet
|
3 baths 2 beds |
show details | |

|
#46
Moore St Apt 3
Stamford, CT 06902
|
2,460 sq. feet
|
4 baths 3 beds |
show details | |

|
#47
Hall St
Mamaroneck, NY 10543
|
1,364 sq. feet
|
1 baths 2 beds |
show details | |

|
#48
Fara Dr
Stamford, CT 06905
|
2,184 sq. feet
|
3 baths 3 beds |
show details | |

|
#49
Lewis Pl
New Rochelle, NY 10804
|
2,659 sq. feet
|
3 baths 4 beds |
show details | |

|
Check over 1 million property listings on Foreclosure.com!
|
browse all offers | |||

Household type by relationship:
Households: 920,409- In family households: 787,571 (154,325 male householders, 82,094 female householders)
177,077 spouses, 289,201 children (277,229 natural, 5,836 adopted, 6,136 stepchildren), 13,465 grandchildren, 12,621 brothers or sisters, 11,677 parents, foster children, 16,923 other relatives, 23,097 non-relatives
- In nonfamily households: 132,838 (45,065 male householders (36,259 living alone)), 65,748 female householders (58,355 living alone)), 22,025 nonrelatives
- In group quarters: 28,704 (13,258 institutionalized population)
167,242 married couples with children.
43,170 single-parent households (7,022 men, 36,148 women).
81.2% of residents of North Castle speak English at home.
5.0% of residents speak Spanish at home (68% speak English very well, 16% speak English well, 12% speak English not well, 5% don't speak English at all).
10.3% of residents speak other Indo-European language at home (80% speak English very well, 14% speak English well, 5% speak English not well, 1% don't speak English at all).
2.8% of residents speak Asian or Pacific Island language at home (58% speak English very well, 26% speak English well, 9% speak English not well, 6% don't speak English at all).
0.8% of residents speak other language at home (91% speak English very well, 9% speak English well).
Foreign born population: 1,716 (14.7%)
(84.8% of them are naturalized citizens)
| Here: | 8.7 |
| State: | 6.3 |
| Here: | 6.2 |
| State: | 3.8 |

- Bedrooms in owner-occupied houses and condos in North Castle, New York
- 0no bedroom
- 261 bedroom
- 2452 bedrooms
- 8683 bedrooms
- 1,3694 bedrooms
- 6105+ bedrooms

- Bedrooms in renter-occupied apartments in North Castle, New York
- 28no bedroom
- 911 bedroom
- 1262 bedrooms
- 1523 bedrooms
- 404 bedrooms
- 285+ bedrooms

- Cars and other vehicles available in North Castle in owner-occupied houses/condos
- 39no vehicle
- 4291 vehicle
- 1,5802 vehicles
- 8223 vehicles
- 1574 vehicles
- 915+ vehicles

- Cars and other vehicles available in North Castle in renter-occupied apartments
- 25no vehicle
- 1521 vehicle
- 2562 vehicles
- 263 vehicles
- 64 vehicles
- 05+ vehicles

- Rooms in owner-occupied houses in North Castle, New York
- 01 room
- 62 rooms
- 253 rooms
- 604 rooms
- 1765 rooms
- 2456 rooms
- 5137 rooms
- 7448 rooms
- 1,3499+ rooms

- Rooms in renter-occupied apartments in North Castle, New York
- 221 room
- 582 rooms
- 393 rooms
- 664 rooms
- 1035 rooms
- 706 rooms
- 547 rooms
- 328 rooms
- 219+ rooms


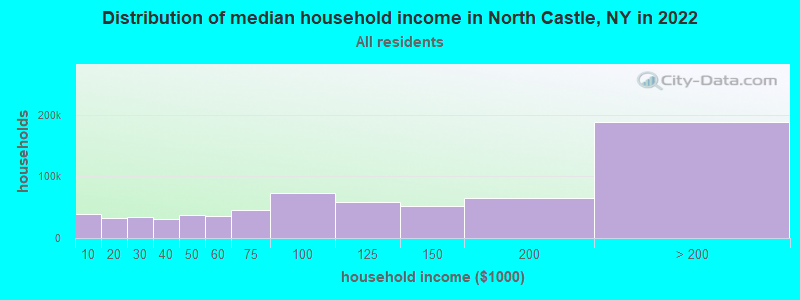
North Castle, NY household income distribution

- 38,784Less than $10,000
- 32,414$10,000 to $19,999
- 34,048$20,000 to $29,999
- 30,818$30,000 to $39,999
- 37,050$40,000 to $49,999
- 35,968$50,000 to $59,999
- 46,163$60,000 to $74,999
- 72,503$75,000 to $99,999
- 58,053$100,000 to $124,999
- 52,502$125,000 to $149,999
- 65,298$150,000 to $199,999
- 188,489$200,000 or more
Percentage of workers working in this county: 66.5%
Number of people working at home: 1,067 (18.0% of all workers)
Travel time to work (commute)
- Less than 5 minutes: 158
- 5 to 9 minutes: 500
- 10 to 14 minutes: 476
- 15 to 19 minutes: 666
- 20 to 24 minutes: 777
- 25 to 29 minutes: 260
- 30 to 34 minutes: 486
- 35 to 39 minutes: 171
- 40 to 44 minutes: 134
- 45 to 59 minutes: 287
- 60 to 89 minutes: 686
- 90 or more minutes: 302
Means of transportation to work:
- Drove a car alone: 3,776 (73.1%)
- Carpooled: 332 (6.4%)
- Bus or trolley bus: 16 (0.3%)
- Subway or elevated: 13 (0.3%)
- Railroad: 643 (12.4%)
- Walked: 112 (2.2%)
- Other means: 11 (0.2%)
- Worked at home: 262 (5.1%)


- Year of entry for the foreign-born population in North Castle, New York
- 2021995 to March 2000
- 1261990 to 1994
- 1661985 to 1989
- 1071980 to 1984
- 1501975 to 1979
- 991970 to 1974
- 1221965 to 1969
- 411Before 1965
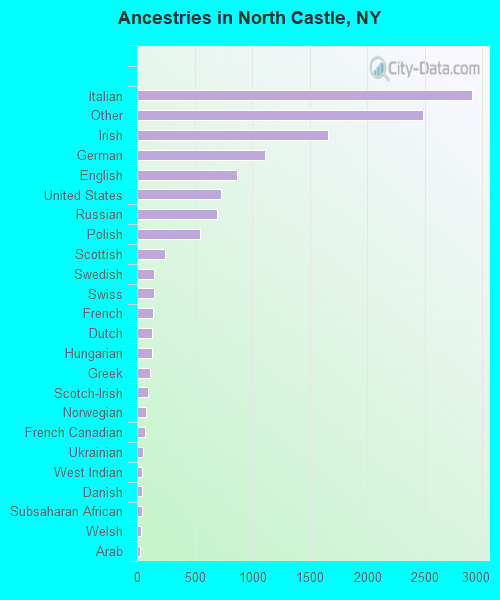
First ancestries reported:
- Italian: 2,915 (23.1%)
- Other: 2,489 (19.7%)
- Irish: 1,662 (13.2%)
- German: 1,109 (8.8%)
- English: 871 (6.9%)
- United States: 731 (5.8%)
- Russian: 695 (5.5%)
- Polish: 544 (4.3%)
- Scottish: 247 (2.0%)
- Swedish: 146 (1.2%)
- Swiss: 144 (1.1%)
- French: 143 (1.1%)
- Dutch: 132 (1.0%)
- Hungarian: 131 (1.0%)
- Greek: 112 (0.9%)
- Scotch-Irish: 97 (0.8%)
- Norwegian: 81 (0.6%)
- French Canadian: 71 (0.6%)
- Ukrainian: 56 (0.4%)
- West Indian: 46 (0.4%)
- Danish: 42 (0.3%)
- Subsaharan African: 41 (0.3%)
- Welsh: 32 (0.3%)
- Arab: 27 (0.2%)
- Czech: 25 (0.2%)
- Slovak: 20 (0.2%)
- Portuguese: 7 (0.06%)
Most common places of birth for foreign-born residents (%):
| North Castle: | 20.4% (282) |
| New York: | 3.8% (147,729) |
| North Castle: | 6.3% (87) |
| New York: | 6.0% (233,766) |
| North Castle: | 5.8% (80) |
| New York: | 1.6% (62,237) |
| North Castle: | 5.7% (79) |
| New York: | 1.8% (69,327) |
| North Castle: | 5.1% (71) |
| New York: | 1.4% (54,876) |
| North Castle: | 4.4% (61) |
| New York: | 3.0% (117,238) |
| North Castle: | 3.6% (50) |
| New York: | 1.1% (41,934) |
| North Castle: | 3.6% (50) |
| New York: | 2.4% (94,595) |
| North Castle: | 3.4% (47) |
| New York: | 0.3% (10,672) |
| North Castle: | 2.7% (37) |
| New York: | 2.4% (93,187) |
| North Castle: | 2.6% (36) |
| New York: | 2.5% (97,933) |
| North Castle: | 2.5% (34) |
| New York: | 3.6% (139,226) |
| North Castle: | 2.3% (32) |
| New York: | 3.2% (125,475) |
| North Castle: | 2.2% (30) |
| New York: | 1.9% (72,408) |
| North Castle: | 1.8% (25) |
| New York: | 4.2% (161,189) |
| North Castle: | 1.7% (24) |
| New York: | 0.5% (20,310) |
| North Castle: | 1.6% (22) |
| New York: | 0.3% (12,209) |
| North Castle: | 1.5% (21) |
| New York: | 1.1% (43,753) |
| North Castle: | 1.5% (21) |
| New York: | 0.4% (17,323) |
Place of birth for U.S.-born residents:
- This state: 7,552
- Other state: 1,813
- Northeast: 953
- Midwest: 343
- South: 356
- West: 161
66% of North Castle residents lived in the same house 5 years ago.
Out of people who lived in different houses, 64% lived in this county.
Out of people who lived in different counties, 58% lived in New York.
Education attainment for males 25 years and older:
- No schooling: 32
- Nursery to 4th grade: 9
- 5th and 6th grade: 51
- 7th and 8th grade: 32
- 9th grade: 15
- 10th grade: 16
- 11th grade: 40
- 12th grade, no diploma: 97
- High school graduate (or equivalency): 446
- Less than 1 year of college: 201
- Some college more than 1 year, no degree: 360
- Associate degree: 159
- Bachelor's degree: 950
- Master's degree: 580
- Professional school degree: 373
- Doctorate degree: 104

Education attainment for females 25 years and older:
- No schooling: 26
- Nursery to 4th grade: 18
- 5th and 6th grade: 33
- 7th and 8th grade: 29
- 9th grade: 6
- 10th grade: 29
- 11th grade: 31
- 12th grade, no diploma: 80
- High school graduate (or equivalency): 659
- Less than 1 year of college: 191
- Some college more than 1 year, no degree: 284
- Associate degree: 233
- Bachelor's degree: 1,064
- Master's degree: 777
- Professional school degree: 135
- Doctorate degree: 65


Housing units in structures:
- One, detached: 3,260
- One, attached: 119
- Two: 205
- 3 or 4: 65
- 5 to 9: 12
- 10 to 19: 6
- 20 to 49: 14
- 50 or more: 25
Housing units lacking complete kitchen facilities: 0.2%

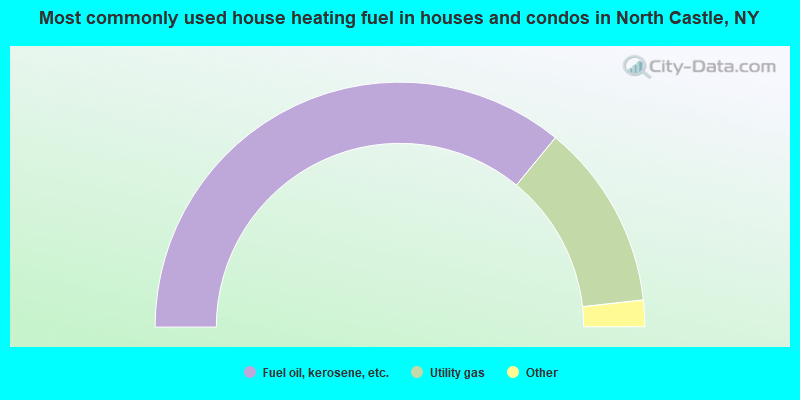
- 71.9%Fuel oil, kerosene, etc.
- 24.6%Utility gas
- 2.7%Electricity
- 0.8%Bottled, tank, or LP gas
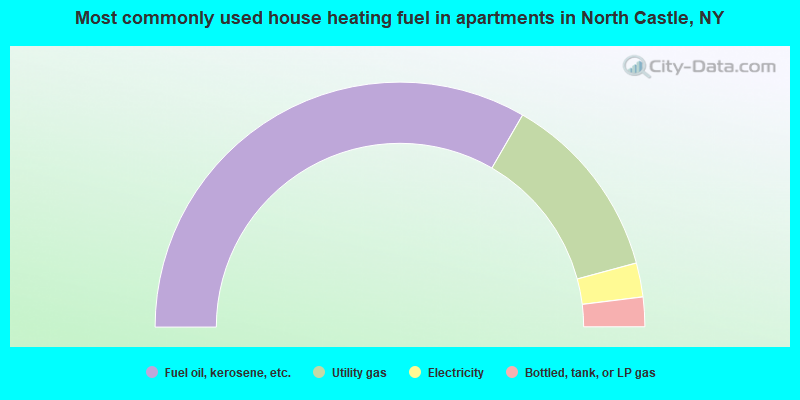
- 66.7%Fuel oil, kerosene, etc.
- 24.9%Utility gas
- 4.5%Electricity
- 3.9%Bottled, tank, or LP gas
Private vs. public school enrollment:
| Here: | 11.4% |
| New York: | 14.0% |
| Here: | 8.3% |
| New York: | 13.2% |
| Here: | 52.3% |
| New York: | 38.2% |


