Sparks, NV (Nevada) Houses and Residents
| Sparks: | $488,500 |
| Nevada: | $434,700 |
Mean price in 2022:
Detached houses: $557,504
Here: $557,504 State: $549,327 Townhouses or other attached units: $309,581
Here: $309,581 State: $328,893 In 3-to-4-unit structures: $279,264
Here: $279,264 State: $295,216 In 5-or-more-unit structures: $294,918
Here: $294,918 State: $297,847 Mobile homes: $209,840
Here: $209,840 State: $159,995 Occupied boats, RVs, vans, etc.: $21,421
Here: $21,421 State: $92,244
Total population: 94,708 (Urban population: 65,980, Rural population: 552 (all nonfarm))
Houses: 46,344 (42,946 occupied: 26,850 owner occupied, 16,096 renter occupied)
| % of renters here: | 37% |
| State: | 40% |
Housing density: 1,937 houses/condos per square mile
Median price asked for vacant for-sale houses and condos in 2022: $398,661.
Median contract rent in 2022: $1,448 (lower quartile is $1,116, upper quartile is $1,922)
Median rent asked for vacant for-rent units in 2022: $1,544
Median gross rent in Sparks, NV in 2022: $1,596
Housing units in Sparks with a mortgage: 19,321 (1,704 second mortgage, 0 home equity loan, 1,206 both second mortgage and home equity loan)
Houses without a mortgage: 525
Median household income for houses/condos with a mortgage: $106,115
Median household income for apartments without a mortgage: $86,316
Median monthly housing costs: $1,540
Compare current foreclosures in Sparks, NV:
| Photo | Address | Area | Beds / Baths | Price | Details |
|---|---|---|---|---|---|

|
#1
Richard Springs Blvd
Sparks, NV 89436
|
2,110 sq. feet
|
3 baths 3 beds |
show details | |

|
#2
Rancho Mirage Dr
Sparks, NV 89436
|
1,673 sq. feet
|
2 baths 3 beds |
show details | |

|
#3
Rockin Robin Dr
Sparks, NV 89441
|
1,334 sq. feet
|
2 baths 3 beds |
show details | |

|
#4
Big Dipper Ct
Sparks, NV 89436
|
2,107 sq. feet
|
2 baths 4 beds |
show details | |

|
#5
Santa Rosa Ave
Sparks, NV 89436
|
2,532 sq. feet
|
3 baths 4 beds |
show details | |

|
#6
Vintage Hills Pkwy
Sparks, NV 89436
|
2,998 sq. feet
|
3 baths 5 beds |
show details | |

|
#7
Knoll View Way
Sparks, NV 89436
|
1,404 sq. feet
|
2 baths 3 beds |
show details | |

|
#8
Rancho Via Dr
Sparks, NV 89434
|
1,902 sq. feet
|
2 baths 3 beds |
show details | |

|
#9
E H St
Sparks, NV 89431
|
1,460 sq. feet
|
2 baths 3 beds |
show details | |

|
#10
Magical Dr
Sparks, NV 89436
|
2,158 sq. feet
|
2 baths 4 beds |
show details |
| Photo | Address | Area | Beds / Baths | Price | Details |
|---|---|---|---|---|---|

|
#11
Cerritos Cir
Sparks, NV 89436
|
1,440 sq. feet
|
2 baths 3 beds |
show details | |

|
#12
Rizzo Dr
Sparks, NV 89434
|
1,210 sq. feet
|
2 baths 3 beds |
show details | |

|
#13
Manchester Way
Sparks, NV 89431
|
1,059 sq. feet
|
1 baths 2 beds |
show details | |

|
#14
Bluehaven Dr
Sparks, NV 89434
|
1,376 sq. feet
|
2 baths 3 beds |
show details | |

|
#15
Cobra Dr
Sparks, NV 89436
|
3,582 sq. feet
|
3 baths 5 beds |
show details | |

|
#16
Teel St
Sparks, NV 89431
|
1,406 sq. feet
|
2 baths 4 beds |
show details | |

|
#17
Grand Island Dr
Sparks, NV 89436
|
2,029 sq. feet
|
2 baths 3 beds |
show details | |

|
#18
Carlene Ct
Sparks, NV 89436
|
1,572 sq. feet
|
2 baths 3 beds |
show details | |

|
#19
Baxter Way
Sparks, NV 89431
|
1,176 sq. feet
|
2 baths 3 beds |
show details | |

|
#20
Marracco Dr
Sparks, NV 89434
|
2,128 sq. feet
|
3 baths 4 beds |
show details |
| Photo | Address | Area | Beds / Baths | Price | Details |
|---|---|---|---|---|---|

|
#21
Pride Dr
Sparks, NV 89436
|
2,703 sq. feet
|
2 baths 3 beds |
show details | |

|
#22
San Pedro St
Sparks, NV 89436
|
2,315 sq. feet
|
3 baths 4 beds |
show details | |

|
#23
Canyon Point Ct
Sparks, NV 89436
|
1,286 sq. feet
|
2 baths 3 beds |
show details | |

|
#24
Camino Real Dr
Sparks, NV 89434
|
1,902 sq. feet
|
2 baths 3 beds |
show details | |

|
#25
Tequilla Ct
Sparks, NV 89441
|
1,614 sq. feet
|
2 baths 3 beds |
show details | |

|
#26
Laguna Way
Sparks, NV 89434
|
1,469 sq. feet
|
2 baths 3 beds |
show details | |

|
#27
Stone View Dr
Sparks, NV 89436
|
1,735 sq. feet
|
2 baths 3 beds |
show details | |

|
#28
Delaware Ct
Sparks, NV 89431
|
1,638 sq. feet
|
2 baths 4 beds |
show details | |

|
#29
Rancho Mirage Dr
Sparks, NV 89436
|
1,673 sq. feet
|
2 baths 3 beds |
show details | |

|
#30
Alta Vista Dr
Sparks, NV 89434
|
1,212 sq. feet
|
2 baths 3 beds |
show details |
| Photo | Address | Area | Beds / Baths | Price | Details |
|---|---|---|---|---|---|

|
#31
Saltern Way
Sparks, NV 89431
|
1,435 sq. feet
|
2 baths 3 beds |
show details | |

|
#32
Deep Creek Ct
Sparks, NV 89434
|
2,152 sq. feet
|
3 baths 4 beds |
show details | |

|
#33
Betsy St
Sparks, NV 89431
|
869 sq. feet
|
1 baths 2 beds |
show details | |

|
#34
Antreka Ct
Sparks, NV 89436
|
1,502 sq. feet
|
2 baths 3 beds |
show details | |

|
#35
Colina Ct
Sparks, NV 89436
|
1,715 sq. feet
|
2 baths 4 beds |
show details | |

|
#36
High Desert Dr
Sparks, NV 89436
|
3,023 sq. feet
|
3 baths 6 beds |
show details | |

|
#37
7th St
Sparks, NV 89431
|
2,336 sq. feet
|
2 baths 4 beds |
show details | |

|
#38
Dawn Cir
Sparks, NV 89431
|
1,617 sq. feet
|
2 baths 3 beds |
show details | |

|
#39
E Greenbrae Dr
Sparks, NV 89431
|
1,196 sq. feet
|
1 baths 4 beds |
show details | |

|
#40
Foxford Way
Sparks, NV 89436
|
1,882 sq. feet
|
2 baths 3 beds |
show details |
| Photo | Address | Area | Beds / Baths | Price | Details |
|---|---|---|---|---|---|

|
#41
Breaker Way
Sparks, NV 89431
|
1,398 sq. feet
|
2 baths 4 beds |
show details | |

|
#42
Ten Mile Dr
Sparks, NV 89436
|
1,973 sq. feet
|
3 baths 4 beds |
show details | |

|
#43
Grasswood Dr
Sparks, NV 89436
|
1,598 sq. feet
|
2 baths 3 beds |
show details | |

|
#44
Veronica Ave
Sparks, NV 89436
|
1,502 sq. feet
|
2 baths 3 beds |
show details | |

|
#45
Burnside Dr
Sparks, NV 89434
|
1,508 sq. feet
|
2 baths 3 beds |
show details | |

|
#46
Loma Verde Dr
Sparks, NV 89436
|
2,174 sq. feet
|
3 baths 4 beds |
show details | |

|
#47
Monte Verde Way
Sparks, NV 89434
|
1,616 sq. feet
|
2 baths 3 beds |
show details | |

|
#48
Garfield Ct
Sparks, NV 89431
|
869 sq. feet
|
1 baths 2 beds |
show details | |

|
#49
4th St
Sparks, NV 89431
|
1,208 sq. feet
|
2 baths 3 beds |
show details | |

|
Check over 1 million property listings on Foreclosure.com!
|
browse all offers | |||

Latest news about housing in Sparks, NV collected exclusively by city-data.com from local newspapers, TV, and radio stations

 | Rental homes, condos, apartments in Reno-Sparks (10 replies) |
| Moving to Reno/Sparks. Need living advice (Apartments?) (11 replies) |
| Sparks/Reno apartments - Aviana at Tuscany (7 replies) |
| Northwest Bound! (400 replies) |
| Apartments in Reno/Sparks (7 replies) |
| Reno/Sparks Real Estate Report by area (49 replies) |

Median year apartment built: 1991
Household type by relationship:
Households: 109,227- Male householders: 21,342 (5,737 living alone), Female householders: 21,604 (6,083 living alone)
18,586 spouses (18,586 opposite-sex spouses), 4,296 unmarried partners, (4,221 opposite-sex unmarried partners), 29,913 children (27,870 natural, 770 adopted, 1,273 stepchildren), 2,818 grandchildren, 1,879 brothers or sisters, 2,359 parents, 0 foster children, 1,912 other relatives, 4,177 non-relatives
- In group quarters: 341
Size of family households: 11,600 2-persons, 6,303 3-persons, 5,848 4-persons, 1,958 5-persons, 1,122 6-persons, 441 7-or-more-persons.
Size of nonfamily households: 11,820 1-person, 2,893 2-persons, 702 3-persons, 259 4-persons.
14,800 married couples with children.
6,063 single-parent households (2,305 men, 3,758 women).
73.9% of residents of Sparks speak English at home.
21.8% of residents speak Spanish at home (64% speak English very well, 18% speak English well, 11% speak English not well, 7% don't speak English at all).
0.9% of residents speak other Indo-European language at home (65% speak English very well, 23% speak English well, 11% speak English not well).
3.5% of residents speak Asian or Pacific Island language at home (69% speak English very well, 23% speak English well, 5% speak English not well, 3% don't speak English at all).
0.3% of residents speak other language at home (52% speak English very well, 7% speak English well, 41% speak English not well).
Foreign born population: 15,329 (14.0%)
(49.8% of them are naturalized citizens)
| Here: | 6.1 |
| State: | 6.0 |
| Here: | 4.0 |
| State: | 4.2 |

- Bedrooms in owner-occupied houses and condos in Sparks, Nevada
- 289no bedroom
- 3411 bedroom
- 3,7292 bedrooms
- 12,0153 bedrooms
- 8,5314 bedrooms
- 1,9455+ bedrooms

- Bedrooms in renter-occupied apartments in Sparks, Nevada
- 1,542no bedroom
- 3,2291 bedroom
- 7,1622 bedrooms
- 3,5873 bedrooms
- 5764 bedrooms
- 05+ bedrooms

- Cars and other vehicles available in Sparks in owner-occupied houses/condos
- 776no vehicle
- 6,7951 vehicle
- 11,2102 vehicles
- 4,7833 vehicles
- 2,7234 vehicles
- 5635+ vehicles

- Cars and other vehicles available in Sparks in renter-occupied apartments
- 1,906no vehicle
- 6,4451 vehicle
- 5,7392 vehicles
- 1,8273 vehicles
- 1394 vehicles
- 405+ vehicles

- Rooms in owner-occupied houses in Sparks, Nevada
- 1921 room
- 1512 rooms
- 9373 rooms
- 3,3014 rooms
- 4,9225 rooms
- 6,2086 rooms
- 4,8617 rooms
- 2,6168 rooms
- 3,6629+ rooms

- Rooms in renter-occupied apartments in Sparks, Nevada
- 1,3081 room
- 1,8902 rooms
- 2,8033 rooms
- 4,0624 rooms
- 2,9145 rooms
- 1,6836 rooms
- 8287 rooms
- 2458 rooms
- 3639+ rooms


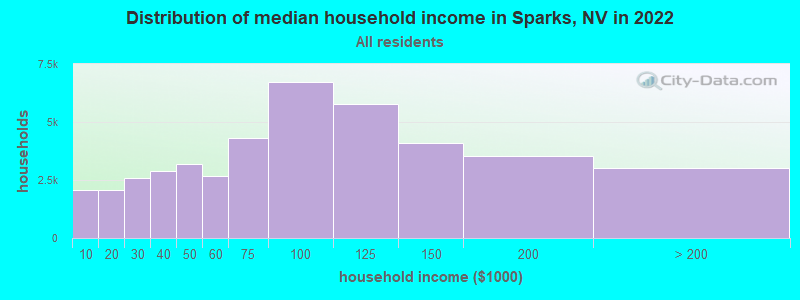
Sparks, NV household income distribution

- 2,065Less than $10,000
- 2,080$10,000 to $19,999
- 2,593$20,000 to $29,999
- 2,902$30,000 to $39,999
- 3,203$40,000 to $49,999
- 2,683$50,000 to $59,999
- 4,289$60,000 to $74,999
- 6,718$75,000 to $99,999
- 5,772$100,000 to $124,999
- 4,095$125,000 to $149,999
- 3,515$150,000 to $199,999
- 3,031$200,000 or more
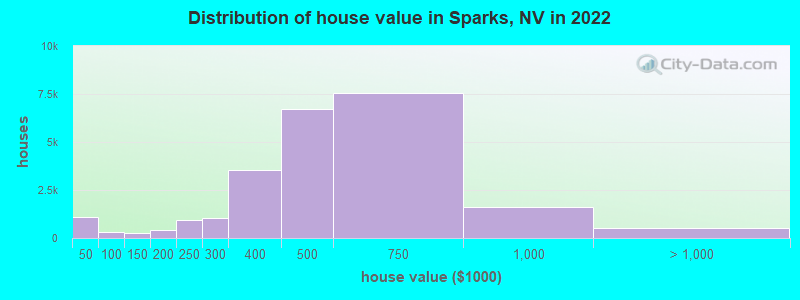
Home value of owner - occupied houses in 2022 in Sparks, NV
-
- 442Less than $10,000
- 32$10,000 to $14,999
- 346$15,000 to $19,999
- 65$20,000 to $24,999
- 49$25,000 to $29,999
- 76$30,000 to $34,999
- 28$35,000 to $39,999
- 73$40,000 to $49,999
- 122$50,000 to $59,999
- 30$60,000 to $69,999
- 9$70,000 to $79,999
- 46$80,000 to $89,999
- 42$90,000 to $99,999
- 208$100,000 to $124,999
- 36$125,000 to $149,999
- 168$150,000 to $174,999
- 235$175,000 to $199,999
- 928$200,000 to $249,999
- 1,034$250,000 to $299,999
- 3,536$300,000 to $399,999
- 6,706$400,000 to $499,999
- 7,529$500,000 to $749,999
- 1,621$750,000 to $999,999
- 250$1,000,000 to $1,499,999
- 11$1,500,000 to $1,999,999
- 252$2,000,000 or more
Rent paid by renters in 2022 in Sparks, NV
-
- 34$150 to $199
- 172$200 to $249
- 60$250 to $299
- 17$300 to $349
- 8$350 to $399
- 70$400 to $449
- 34$450 to $499
- 22$500 to $549
- 40$550 to $599
- 142$600 to $649
- 159$650 to $699
- 188$700 to $749
- 209$750 to $799
- 642$800 to $899
- 1,036$900 to $999
- 3,013$1,000 to $1,249
- 2,682$1,250 to $1,499
- 4,951$1,500 to $1,999
- 1,530$2,000 to $2,499
- 817$2,500 to $2,999
- 12$3,000 to $3,499
- 266$3,500 or more
- 433No cash rent

Percentage of workers working in this county: 89.7%
Number of people working at home: 5,899 (10.6% of all workers)
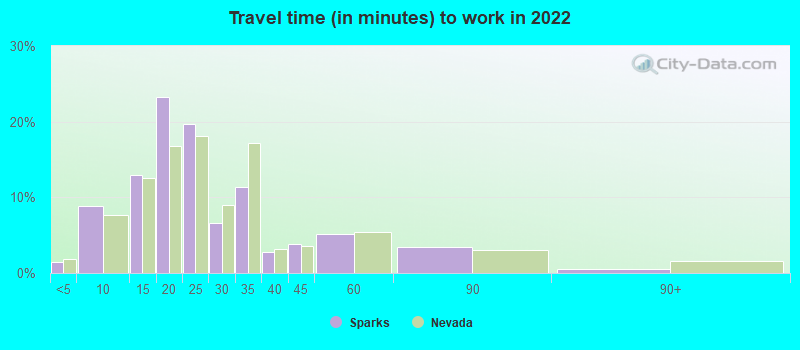
Travel time to work (commute)
- Less than 5 minutes: 582
- 5 to 9 minutes: 3,209
- 10 to 14 minutes: 6,572
- 15 to 19 minutes: 10,303
- 20 to 24 minutes: 9,088
- 25 to 29 minutes: 4,876
- 30 to 34 minutes: 7,798
- 35 to 39 minutes: 1,385
- 40 to 44 minutes: 1,098
- 45 to 59 minutes: 2,500
- 60 to 89 minutes: 1,402
- 90 or more minutes: 876
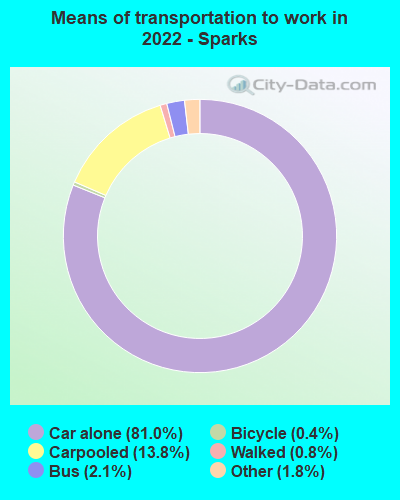
Means of transportation to work:
- Drove a car alone: 37,350 (71.8%)
- Carpooled: 6,371 (12.3%)
- Bus: 968 (1.9%)
- Taxi: 833 (1.6%)
- Bicycle: 189 (0.4%)
- Walked: 374 (0.7%)
- Worked at home: 5,899 (11.3%)
- Unemployment by race in 2022
- Unemployment rate for White non-Hispanic residents
- 3.7%Males
- 1.7%Females
- Unemployment rate for Black residents
- 14.7%Males
- 3.2%Females
- Unemployment rate for American Indian and Alaska Native residents
- 16.4%Males
- 6.0%Females
- Unemployment rate for Asian residents
- 0.6%Males
- 2.6%Females
- Unemployment rate for other race residents
- 3.3%Males
- 12.9%Females
- Unemployment rate for two or more race residents
- 4.6%Males
- 6.6%Females
- Unemployment rate for Hispanic or Latino residents
- 4.3%Males
- 2.8%Females

- Year of entry for the foreign-born population in Sparks, Nevada
- 3,3862010 or later
- 4,2672000 to 2009
- 3,9441990 to 1999
- 3,1221980 to 1989
- 1,3151970 to 1979
- 1,157Before 1970

First ancestries reported:
- English: 4,575 (7.9%)
- German: 3,261 (5.6%)
- American: 2,712 (4.7%)
- European: 2,569 (4.4%)
- Italian: 2,300 (4.0%)
- Irish: 2,165 (3.7%)
- Norwegian: 954 (1.7%)
- French: 669 (1.2%)
- Scottish: 475 (0.8%)
- Polish: 447 (0.8%)
- Nigerian: 300 (0.5%)
- Dutch: 275 (0.5%)
- Danish: 250 (0.4%)
- Northern European: 245 (0.4%)
- Scotch-Irish: 237 (0.4%)
- Scandinavian: 159 (0.3%)
- French Canadian: 157 (0.3%)
- Swedish: 154 (0.3%)
- Ukrainian: 150 (0.3%)
- British: 149 (0.3%)
- Canadian: 129 (0.2%)
- Russian: 127 (0.2%)
- Greek: 112 (0.2%)
- Portuguese: 105 (0.2%)
- Eastern European: 102 (0.2%)
- Finnish: 76 (0.1%)
- Basque: 72 (0.1%)
- Iranian: 72 (0.1%)
- Haitian: 64 (0.1%)
- Welsh: 59 (0.1%)
- African: 58 (0.1%)
- Austrian: 47 (0.08%)
- Hungarian: 46 (0.08%)
- Ghanaian: 43 (0.07%)
- Romanian: 37 (0.06%)
- Swiss: 37 (0.06%)
- Yugoslavian: 31 (0.05%)
- Czech: 23 (0.04%)
- South African: 23 (0.04%)
- Lithuanian: 21 (0.04%)
- Slovak: 18 (0.03%)
- Assyrian: 16 (0.03%)
- Armenian: 14 (0.02%)
- Serbian: 14 (0.02%)
- Latvian: 14 (0.02%)
- Slavic: 13 (0.02%)
- Lebanese: 12 (0.02%)
- Czechoslovakian: 11 (0.02%)
- Turkish: 11 (0.02%)
- Belgian: 10 (0.02%)
- Ethiopian: 9 (0.02%)
- Brazilian: 6 (0.01%)
- Arab: 4 (0.01%)
Most common places of birth for foreign-born residents (%):
| Sparks: | 50.8% (8,918) |
| Nevada: | 36.8% (218,248) |
| Sparks: | 14.4% (2,536) |
| Nevada: | 15.5% (91,628) |
| Sparks: | 5.6% (976) |
| Nevada: | 4.0% (23,923) |
| Sparks: | 3.8% (669) |
| Nevada: | 2.4% (14,384) |
| Sparks: | 2.1% (369) |
| Nevada: | 4.2% (24,711) |
| Sparks: | 2.0% (359) |
| Nevada: | 2.0% (11,718) |
| Sparks: | 1.8% (318) |
| Nevada: | 0.1% (599) |
| Sparks: | 1.7% (303) |
| Nevada: | 1.9% (11,407) |
Place of birth for U.S.-born residents:
- This state: 39,753
- Other state: 52,245
- Northeast: 4,667
- Midwest: 7,097
- South: 5,801
- West: 34,680
86.5% of Sparks residents lived in the same house 1 years ago.
Out of people who lived in different houses, 42.4% lived in this county.
Out of people who lived in different counties, 17.4% lived in Nevada.
| Sparks: | 86.5% |
| State average: | 86.4% |
Education attainment for males 25 years and older:
- No schooling: 574
- Nursery to 4th grade: 189
- 5th and 6th grade: 275
- 7th and 8th grade: 338
- 9th grade: 658
- 10th grade: 463
- 11th grade: 125
- 12th grade, no diploma: 1,074
- High school graduate (or equivalency): 10,279
- Less than 1 year of college: 3,555
- Some college more than 1 year, no degree: 6,962
- Associate degree: 3,236
- Bachelor's degree: 6,529
- Master's degree: 1,788
- Professional school degree: 300
- Doctorate degree: 194

Education attainment for females 25 years and older:
- No schooling: 1,256
- Nursery to 4th grade: 485
- 5th and 6th grade: 100
- 7th and 8th grade: 583
- 9th grade: 458
- 10th grade: 388
- 11th grade: 109
- 12th grade, no diploma: 914
- High school graduate (or equivalency): 10,221
- Less than 1 year of college: 3,327
- Some college more than 1 year, no degree: 6,666
- Associate degree: 4,351
- Bachelor's degree: 5,764
- Master's degree: 3,770
- Professional school degree: 269
- Doctorate degree: 373


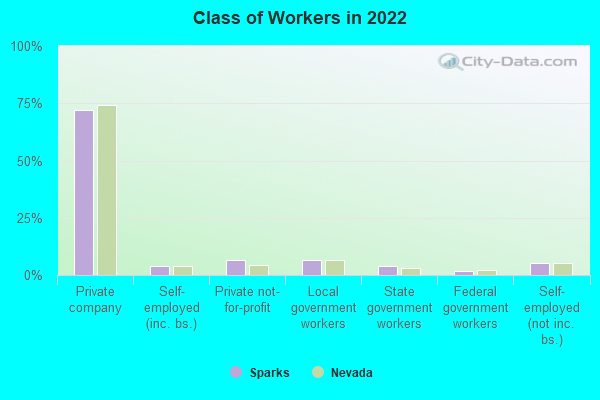
Housing units in structures:
- One, detached: 30,010
- One, attached: 2,413
- Two: 513
- 3 or 4: 2,218
- 5 to 9: 2,980
- 10 to 19: 3,092
- 20 to 49: 1,456
- 50 or more: 3,130
- Mobile homes: 324
- Boats, RVs, vans, etc.: 208
Median worth of mobile homes: $187,500
Housing units lacking complete kitchen facilities in 2022: 1.9%
House/condo owner moved in on average 8 years ago
Renter moved in on average 2 years ago

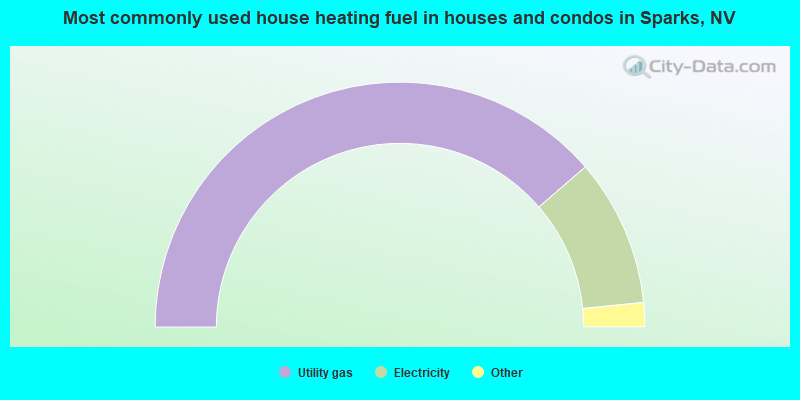
- 77.4%Utility gas
- 19.5%Electricity
- 1.9%Bottled, tank, or LP gas
- 0.5%Fuel oil, kerosene, etc.
- 0.3%No fuel used
- 0.2%Wood
- 0.2%Solar energy
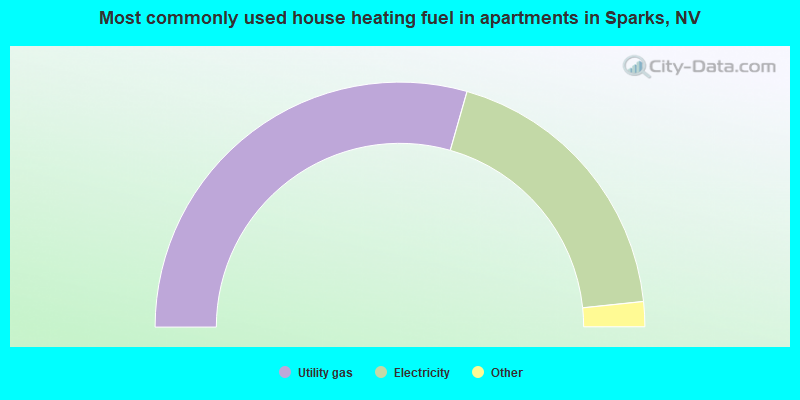
- 58.9%Utility gas
- 37.9%Electricity
- 1.6%Bottled, tank, or LP gas
- 0.8%No fuel used
- 0.7%Fuel oil, kerosene, etc.
- 0.2%Other fuel
Private vs. public school enrollment:
| Here: | 7.8% |
| Nevada: | 12.9% |
| Here: | 3.0% |
| Nevada: | 6.9% |
| Here: | 22.7% |
| Nevada: | 16.0% |


