Jump to a detailed profile or search site with Google Custom Search

Staten Island, NY (New York) Houses and Residents

Estimated median house or condo value in 2022: $632,900 (it was $216,600 in 2000)
Staten Island:

$632,900
New York:

$400,400
Lower value quartile - upper value quartile: $488,700 - $799,700

Total population: 481,026 (Urban population: 443,728, Rural population: 0)

Houses: 163,993 (156,341 occupied: 99,732 owner occupied, 56,609 renter occupied)

% of renters here:

36%
State:

46%

Housing density: 2,804 houses/condos per square mile

Median price asked for vacant for-sale houses and condos in 2022 in this county: $255,508.

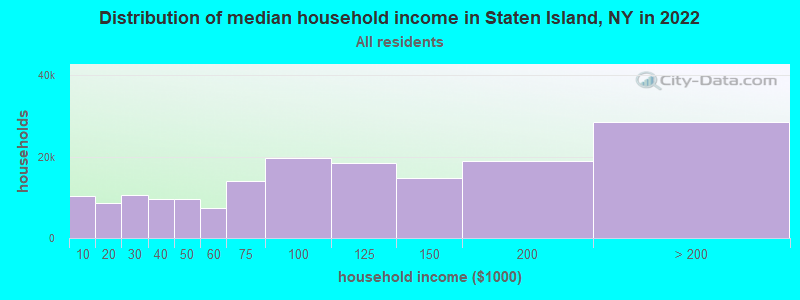
Median contract rent in 2022: $1,516 (lower quartile is $1,007, upper quartile is $1,904)


Median rent asked for vacant for-rent units in 2022: $1,532


Median gross rent in Staten Island, NY in 2022: $1,669

Housing units in Staten Island with a mortgage: 57,986 (4,499 second mortgage, 5,623 home equity loan, 160 both second mortgage and home equity loan)
Houses without a mortgage: 19,289

Compare current foreclosures in Staten Island, NY:

Check out more offers in Staten Island, NY.
Powered by Foreclosure.com


Staten Island, New York Age and Sex of Residents

Household type by relationship:

Households: 460,892
  • In family households: 405,089 (76,763 male householders, 41,788 female householders)
    86,273 spouses, 154,934 children (148,489 natural, 2,476 adopted, 3,969 stepchildren), 8,483 grandchildren, 6,551 brothers or sisters, 8,229 parents, foster children, 8,126 other relatives, 9,060 non-relatives
  • In nonfamily households: 55,803 (21,140 male householders (17,112 living alone)), 25,825 female householders (22,895 living alone)), 8,838 nonrelatives
  • In group quarters: 7,838 (3,862 institutionalized population)

80,293 married couples with children.
23,460 single-parent households (3,680 men, 19,780 women).

74.0% of residents of Staten Island speak English at home.
9.0% of residents speak Spanish at home (63% speak English very well, 20% speak English well, 14% speak English not well, 4% don't speak English at all).
10.9% of residents speak other Indo-European language at home (65% speak English very well, 24% speak English well, 9% speak English not well, 2% don't speak English at all).
4.0% of residents speak Asian or Pacific Island language at home (52% speak English very well, 28% speak English well, 16% speak English not well, 4% don't speak English at all).
2.2% of residents speak other language at home (71% speak English very well, 20% speak English well, 8% speak English not well, 1% don't speak English at all).

Foreign born population: 127,780 (26.0%)
(68.9% of them are naturalized citizens)

Median number of rooms in houses and condos:
Here:

6.1
State:

6.3

Median number of rooms in apartments
Here:

4.1
State:

3.8

Owner-occupied Renter-occupied
Bedrooms in owner-occupied houses and condos in Staten Island, New York
  • Bedrooms in owner-occupied houses and condos in Staten Island, New York
  • 264no bedroom
  • 4,2601 bedroom
  • 17,0922 bedrooms
  • 55,9393 bedrooms
  • 16,9804 bedrooms
  • 5,1975+ bedrooms
Bedrooms in renter-occupied apartments in Staten Island, New York
  • Bedrooms in renter-occupied apartments in Staten Island, New York
  • 3,756no bedroom
  • 21,3541 bedroom
  • 19,5312 bedrooms
  • 10,2963 bedrooms
  • 1,3434 bedrooms
  • 3295+ bedrooms
Owner-occupied Renter-occupied
Cars and other vehicles available in Staten Island in owner-occupied houses/condos
  • Cars and other vehicles available in Staten Island in owner-occupied houses/condos
  • 7,288no vehicle
  • 34,7961 vehicle
  • 43,3622 vehicles
  • 11,0173 vehicles
  • 2,6594 vehicles
  • 6105+ vehicles
Cars and other vehicles available in Staten Island in renter-occupied apartments
  • Cars and other vehicles available in Staten Island in renter-occupied apartments
  • 21,403no vehicle
  • 24,9871 vehicle
  • 8,8372 vehicles
  • 1,0063 vehicles
  • 1604 vehicles
  • 2165+ vehicles
Owner-occupied Renter-occupied
Rooms in owner-occupied houses in Staten Island, New York
  • Rooms in owner-occupied houses in Staten Island, New York
  • 1471 room
  • 6012 rooms
  • 3,2283 rooms
  • 6,5564 rooms
  • 15,3045 rooms
  • 29,8606 rooms
  • 19,4467 rooms
  • 10,9938 rooms
  • 13,5979+ rooms
Rooms in renter-occupied apartments in Staten Island, New York
  • Rooms in renter-occupied apartments in Staten Island, New York
  • 2,9531 room
  • 5,4242 rooms
  • 15,8263 rooms
  • 14,9584 rooms
  • 8,8175 rooms
  • 5,5466 rooms
  • 1,8397 rooms
  • 5618 rooms
  • 6859+ rooms
Year house built
Breakdown of mean house values by ages of householders
Owners and renters by unit type in Staten Island, NY
  • Staten Island, NY household income distribution

  • Distribution of median household income in Staten Island, NY in 2022
  • 10,330Less than $10,000
  • 8,667$10,000 to $19,999
  • 10,468$20,000 to $29,999
  • 9,462$30,000 to $39,999
  • 9,677$40,000 to $49,999
  • 7,389$50,000 to $59,999
  • 13,896$60,000 to $74,999
  • 19,655$75,000 to $99,999
  • 18,418$100,000 to $124,999
  • 14,648$125,000 to $149,999
  • 18,850$150,000 to $199,999
  • 28,486$200,000 or more

Percentage of workers working in this county: 55.5%
Number of people working at home: 23,286 (10.2% of all workers)

Travel time to work (commute)

  • Less than 5 minutes: 2,400
  • 5 to 9 minutes: 9,327
  • 10 to 14 minutes: 17,849
  • 15 to 19 minutes: 18,197
  • 20 to 24 minutes: 18,075
  • 25 to 29 minutes: 5,996
  • 30 to 34 minutes: 20,396
  • 35 to 39 minutes: 3,619
  • 40 to 44 minutes: 8,344
  • 45 to 59 minutes: 20,042
  • 60 to 89 minutes: 37,768
  • 90 or more minutes: 25,926

Means of transportation to work:

  • Drove a car alone: 103,856 (54.3%)
  • Carpooled: 23,084 (12.1%)
  • Bus or trolley bus: 36,678 (19.2%)
  • Streetcar or trolley car: 89 (0.0%)
  • Subway or elevated: 4,894 (2.6%)
  • Railroad: 1,705 (0.9%)
  • Ferryboat: 10,109 (5.3%)
  • Taxi: 715 (0.4%)
  • Motorcycle: 114 (0.1%)
  • Bicycle: 364 (0.2%)
  • Walked: 5,545 (2.9%)
  • Other means: 786 (0.4%)
  • Worked at home: 3,206 (1.7%)
Class of Workers in 2000
Year of entry for the foreign-born population in Staten Island, New York
  • Year of entry for the foreign-born population in Staten Island, New York
  • 12,7991995 to March 2000
  • 13,2811990 to 1994
  • 10,7291985 to 1989
  • 7,6731980 to 1984
  • 6,0831975 to 1979
  • 6,5411970 to 1974
  • 5,1471965 to 1969
  • 10,404Before 1965

Most common places of birth for foreign-born residents (%):

Italy
Staten Island:

11.3% (8,245)
New York:

3.8% (147,729)

Mexico
Staten Island:

6.7% (4,890)
New York:

4.2% (161,189)

Philippines
Staten Island:

5.2% (3,799)
New York:

1.9% (72,408)

India
Staten Island:

4.8% (3,499)
New York:

3.0% (117,238)

Russia
Staten Island:

4.8% (3,452)
New York:

2.4% (94,595)

China, excluding Hong Kong and Taiwan
Staten Island:

3.9% (2,828)
New York:

6.0% (233,766)

Korea
Staten Island:

3.7% (2,710)
New York:

2.5% (97,933)

Other Eastern Europe
Staten Island:

3.7% (2,654)
New York:

1.4% (53,825)

Ukraine
Staten Island:

3.1% (2,220)
New York:

2.1% (82,238)

Poland
Staten Island:

2.8% (2,058)
New York:

2.4% (93,187)

Other Western Africa
Staten Island:

2.8% (2,042)
New York:

0.5% (17,599)

Egypt
Staten Island:

2.7% (1,981)
New York:

0.5% (19,907)

Yugoslavia
Staten Island:

2.5% (1,794)
New York:

0.7% (25,688)

Nigeria
Staten Island:

2.0% (1,433)
New York:

0.5% (18,889)

Colombia
Staten Island:

1.9% (1,366)
New York:

2.9% (111,727)

Pakistan
Staten Island:

1.8% (1,325)
New York:

1.3% (51,055)

Trinidad and Tobago
Staten Island:

1.8% (1,286)
New York:

2.5% (98,473)

Dominican Republic
Staten Island:

1.8% (1,285)
New York:

10.5% (408,086)

Hong Kong
Staten Island:

1.7% (1,258)
New York:

1.0% (37,496)

Jamaica
Staten Island:

1.6% (1,191)
New York:

5.9% (226,470)

Other South Central Asia
Staten Island:

1.6% (1,152)
New York:

0.6% (23,797)

Place of birth for U.S.-born residents:

  • This state: 335,402
  • Other state: 26,543
  • Northeast: 13,141
  • Midwest: 3,067
  • South: 8,306
  • West: 2,029

65% of Staten Island residents lived in the same house 5 years ago.
   Out of people who lived in different houses, 59% lived in this county.
   Out of people who lived in different counties, 83% lived in New York.

Education attainment for males 25 years and older:

  • No schooling: 1,771
  • Nursery to 4th grade: 585
  • 5th and 6th grade: 1,642
  • 7th and 8th grade: 3,087
  • 9th grade: 2,357
  • 10th grade: 3,341
  • 11th grade: 3,699
  • 12th grade, no diploma: 6,993
  • High school graduate (or equivalency): 43,032
  • Less than 1 year of college: 9,196
  • Some college more than 1 year, no degree: 19,957
  • Associate degree: 7,646
  • Bachelor's degree: 21,553
  • Master's degree: 7,772
  • Professional school degree: 3,756
  • Doctorate degree: 1,018
Educational Attainment for Males

Education attainment for females 25 years and older:

  • No schooling: 2,035
  • Nursery to 4th grade: 732
  • 5th and 6th grade: 2,187
  • 7th and 8th grade: 4,311
  • 9th grade: 2,564
  • 10th grade: 3,729
  • 11th grade: 4,194
  • 12th grade, no diploma: 7,936
  • High school graduate (or equivalency): 55,813
  • Less than 1 year of college: 9,954
  • Some college more than 1 year, no degree: 18,319
  • Associate degree: 10,601
  • Bachelor's degree: 19,964
  • Master's degree: 11,118
  • Professional school degree: 2,355
  • Doctorate degree: 578
Educational Attainment for Females
Staten Island marital status for males
Staten Island marital status for females

Housing units in structures:

  • One, detached: 55,398
  • One, attached: 39,674
  • Two: 37,788
  • 3 or 4: 8,154
  • 5 to 9: 3,953
  • 10 to 19: 2,693
  • 20 to 49: 4,680
  • 50 or more: 11,319
  • Mobile homes: 278
  • Boats, RVs, vans, etc.: 56

Median worth of mobile homes: $145,815

Housing units lacking complete plumbing facilities: 0.5%

Housing units lacking complete kitchen facilities: 0.6%
Year householders moved into residence in Staten Island
Houses and condos Apartments
Most commonly used house heating fuel in houses and condos in Staten Island, NY
  • 85.6%Utility gas
  • 11.9%Fuel oil, kerosene, etc.
  • 1.3%Electricity
  • 1.0%Bottled, tank, or LP gas
  • 0.1%Other fuel
Most commonly used house heating fuel in apartments in Staten Island, NY
  • 72.7%Utility gas
  • 17.6%Fuel oil, kerosene, etc.
  • 6.0%Electricity
  • 1.7%Bottled, tank, or LP gas
  • 1.0%Other fuel
  • 1.0%No fuel used

Private vs. public school enrollment:

Students in private schools in grades 1 to 8 (elementary and middle school): 12,354
Here:

23.3%
New York:

14.0%

Students in private schools in grades 9 to 12 (high school): 6,972
Here:

26.7%
New York:

13.2%

Students in private undergraduate colleges: 8,844
Here:

38.9%
New York:

38.2%
School Enrollment by Level of School for Male Students
School Enrollment by Level of School for Female Students
Age and Sex of Sensory-Disabled Noninstitutionalized Residents
Age and Sex of Physically-Disabled Noninstitutionalized Residents
Age and Sex of Mentally-Disabled Noninstitutionalized Residents
Age and Sex of Self-Care Disabled Noninstitutionalized Residents
Age and Sex of Go-Outside-Home Disabled Noninstitutionalized Residents
Age and Sex of Noninstitutionalized Residents with Employment Disability