Van Wert, OH (Ohio) Houses and Residents
| Van Wert: | $110,791 |
| Ohio: | $204,100 |
Mean price in 2022:
Detached houses: $139,562
Here: $139,562 State: $254,366 Townhouses or other attached units: $163,234
Here: $163,234 State: $225,733 In 2-unit structures: $112,690
Here: $112,690 State: $144,384 Mobile homes: $215,877
Here: $215,877 State: $62,719
Total population: 10,768 (Urban population: 10,386 (all inside urban clusters), Rural population: 325 (all nonfarm))
Houses: 4,939 (4,520 occupied: 3,071 owner occupied, 1,496 renter occupied)
| % of renters here: | 33% |
| State: | 33% |
Housing density: 833 houses/condos per square mile
Median price asked for vacant for-sale houses and condos in 2022: $62,752.
Median contract rent in 2022: $556 (lower quartile is $469, upper quartile is $687)
Median rent asked for vacant for-rent units in 2022: $702
Median gross rent in Van Wert, OH in 2022: $753
Housing units in Van Wert with a mortgage: 1,808 (161 second mortgage, 16 home equity loan, 87 both second mortgage and home equity loan)
Houses without a mortgage: 49
Median household income for houses/condos with a mortgage: $71,167
Median household income for apartments without a mortgage: $55,102
Median monthly housing costs: $705
Compare current foreclosures near Van Wert, OH:
| Photo | Address | Area | Beds / Baths | Price | Details |
|---|---|---|---|---|---|

|
#1
S Vine St
Van Wert, OH 45891
|
1,204 sq. feet
|
2 baths 2 beds |
show details | |

|
#2
N Jefferson St
Van Wert, OH 45891
|
2,716 sq. feet
|
2 baths 3 beds |
show details | |

|
#3
Wolfcale Rd
Van Wert, OH 45891
|
2,135 sq. feet
|
1 baths 3 beds |
show details | |

|
#4
High St
Van Wert, OH 45891
|
1,212 sq. feet
|
2 baths 3 beds |
show details | |

|
#5
Lincoln Hwy
Van Wert, OH 45891
|
1,760 sq. feet
|
1 baths 4 beds |
show details | |

|
#6
W Main St
Van Wert, OH 45891
|
1,501 sq. feet
|
1 baths 3 beds |
show details | |

|
#7
Sibley St
Van Wert, OH 45891
|
1,680 sq. feet
|
1 baths 3 beds |
show details | |

|
#8
S Walnut St
Van Wert, OH 45891
|
- sq. feet
|
- baths - beds |
show details | |

|
#9
Jennings Rd
Van Wert, OH 45891
|
- sq. feet
|
- baths - beds |
show details | |

|
#10
Middle Point Rd
Van Wert, OH 45891
|
- sq. feet
|
1 baths - beds |
show details |
| Photo | Address | Area | Beds / Baths | Price | Details |
|---|---|---|---|---|---|

|
#11
N Walnut St
Van Wert, OH 45891
|
- sq. feet
|
- baths - beds |
show details | |

|
#12
E 6th St
Delphos, OH 45833
|
1,486 sq. feet
|
1 baths 3 beds |
show details | |

|
#13
W 2nd St
Delphos, OH 45833
|
2,324 sq. feet
|
2 baths 4 beds |
show details | |

|
#14
S Canal St
Spencerville, OH 45887
|
1,836 sq. feet
|
1 baths 3 beds |
show details | |

|
#15
Rockford West Rd
Rockford, OH 45882
|
1,858 sq. feet
|
1 baths 1 beds |
show details | |

|
#16
N College St
Spencerville, OH 45887
|
1,396 sq. feet
|
1 baths 3 beds |
show details | |

|
#17
E 2nd St
Spencerville, OH 45887
|
1,344 sq. feet
|
1 baths 3 beds |
show details | |

|
#18
S Elizabeth St
Spencerville, OH 45887
|
2,367 sq. feet
|
1 baths 3 beds |
show details | |

|
#19
Primrose Pl
Spencerville, OH 45887
|
1,040 sq. feet
|
1 baths 3 beds |
show details | |

|
#20
E Hoffman St
Ohio City, OH 45874
|
1,068 sq. feet
|
1 baths 3 beds |
show details |
| Photo | Address | Area | Beds / Baths | Price | Details |
|---|---|---|---|---|---|

|
#21
Road 87
Paulding, OH 45879
|
1,180 sq. feet
|
1 baths 3 beds |
show details | |

|
#22
Leis Rd
Spencerville, OH 45887
|
1,152 sq. feet
|
1 baths 3 beds |
show details | |

|
#23
Eastridge Dr
Decatur, IN 46733
|
- sq. feet
|
- baths - beds |
show details | |

|
#24
Front St
Ohio City, OH 45874
|
- sq. feet
|
- baths - beds |
show details | |

|
#25
Harrison St
Cloverdale, OH 45827
|
- sq. feet
|
- baths - beds |
show details | |

|
#26
S Clay St # 14
Delphos, OH 45833
|
- sq. feet
|
- baths - beds |
show details | |

|
#27
Western St
Delphos, OH 45833
|
- sq. feet
|
- baths - beds |
show details | |

|
#28
E Jackson St
Middle Point, OH 45863
|
- sq. feet
|
- baths - beds |
show details | |

|
#29
Van Wert Paulding Rd
Convoy, OH 45832
|
- sq. feet
|
- baths - beds |
show details | |

|
#30
Northbrook Ct
Decatur, IN 46733
|
- sq. feet
|
- baths - beds |
show details |
| Photo | Address | Area | Beds / Baths | Price | Details |
|---|---|---|---|---|---|

|
#31
E Hoffman St
Ohio City, OH 45874
|
- sq. feet
|
- baths - beds |
show details | |

|
Check over 1 million property listings on Foreclosure.com!
|
browse all offers | |||


 | orient state institution-1964 need info. (85 replies) |
| Lima Ohio Questions (17 replies) |
| Favorite Smaller Ohio City (41 replies) |
| Help with TV/Radio Reception (22 replies) |
| Moving to Bowling Green, OH (17 replies) |

Median year apartment built: 1960
Household type by relationship:
Households: 10,810- Male householders: 1,992 (593 living alone), Female householders: 2,485 (869 living alone)
1,808 spouses (1,805 opposite-sex spouses), 497 unmarried partners, (497 opposite-sex unmarried partners), 3,184 children (2,967 natural, 6 adopted, 210 stepchildren), 120 grandchildren, 45 brothers or sisters, 80 parents, 0 foster children, 84 other relatives, 251 non-relatives
- In group quarters: 258
Size of family households: 1,235 2-persons, 723 3-persons, 554 4-persons, 184 5-persons, 90 6-persons, 25 7-or-more-persons.
Size of nonfamily households: 1,509 1-person, 212 2-persons, 19 3-persons, 5 4-persons.
1,211 married couples with children.
1,144 single-parent households (301 men, 843 women).
96.8% of residents of Van Wert speak English at home.
2.8% of residents speak Spanish at home (79% speak English very well, 14% speak English well, 8% speak English not well).
0.2% of residents speak other Indo-European language at home (100% speak English very well).
Foreign born population: 124 (1.1%)
(40.3% of them are naturalized citizens)
| Here: | 6.9 |
| State: | 6.7 |
| Here: | 4.7 |
| State: | 4.4 |

- Bedrooms in owner-occupied houses and condos in Van Wert, Ohio
- 0no bedroom
- 31 bedroom
- 6152 bedrooms
- 1,6983 bedrooms
- 5354 bedrooms
- 2215+ bedrooms

- Bedrooms in renter-occupied apartments in Van Wert, Ohio
- 78no bedroom
- 3081 bedroom
- 5632 bedrooms
- 4143 bedrooms
- 864 bedrooms
- 485+ bedrooms

- Cars and other vehicles available in Van Wert in owner-occupied houses/condos
- 54no vehicle
- 9971 vehicle
- 1,1712 vehicles
- 4743 vehicles
- 2784 vehicles
- 985+ vehicles

- Cars and other vehicles available in Van Wert in renter-occupied apartments
- 263no vehicle
- 6371 vehicle
- 3652 vehicles
- 1913 vehicles
- 414 vehicles
- 05+ vehicles

- Rooms in owner-occupied houses in Van Wert, Ohio
- 01 room
- 02 rooms
- 353 rooms
- 1634 rooms
- 3965 rooms
- 6616 rooms
- 6857 rooms
- 3198 rooms
- 8139+ rooms

- Rooms in renter-occupied apartments in Van Wert, Ohio
- 521 room
- 162 rooms
- 2633 rooms
- 3864 rooms
- 1875 rooms
- 3506 rooms
- 1017 rooms
- 808 rooms
- 609+ rooms


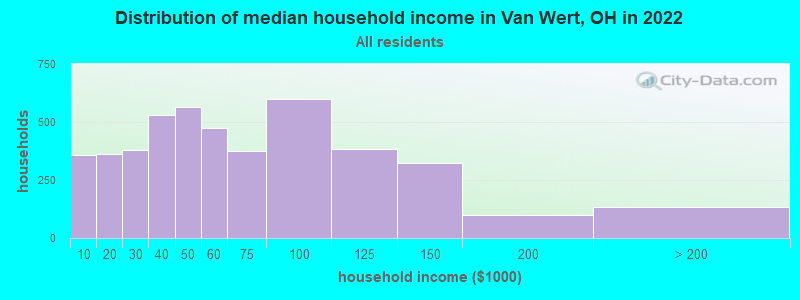
Van Wert, OH household income distribution

- 356Less than $10,000
- 362$10,000 to $19,999
- 381$20,000 to $29,999
- 532$30,000 to $39,999
- 565$40,000 to $49,999
- 475$50,000 to $59,999
- 374$60,000 to $74,999
- 597$75,000 to $99,999
- 382$100,000 to $124,999
- 323$125,000 to $149,999
- 97$150,000 to $199,999
- 135$200,000 or more
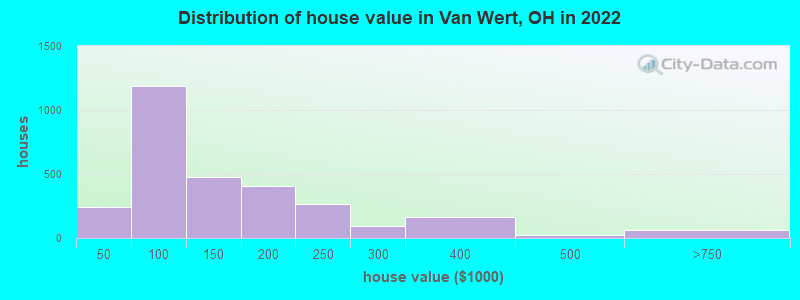
Home value of owner - occupied houses in 2022 in Van Wert, OH
-
- 61Less than $10,000
- 28$10,000 to $14,999
- 25$15,000 to $19,999
- 18$20,000 to $24,999
- 1$25,000 to $29,999
- 14$30,000 to $34,999
- 90$40,000 to $49,999
- 137$50,000 to $59,999
- 181$60,000 to $69,999
- 250$70,000 to $79,999
- 330$80,000 to $89,999
- 197$90,000 to $99,999
- 235$100,000 to $124,999
- 240$125,000 to $149,999
- 306$150,000 to $174,999
- 97$175,000 to $199,999
- 262$200,000 to $249,999
- 92$250,000 to $299,999
- 164$300,000 to $399,999
- 23$400,000 to $499,999
- 63$500,000 to $749,999
Rent paid by renters in 2022 in Van Wert, OH
-
- 23Less than $100
- 34$200 to $249
- 6$250 to $299
- 18$300 to $349
- 86$350 to $399
- 124$400 to $449
- 182$450 to $499
- 228$500 to $549
- 121$550 to $599
- 192$600 to $649
- 124$650 to $699
- 112$700 to $749
- 96$750 to $799
- 49$800 to $899
- 43No cash rent


Percentage of workers working in this county: 79.2%
Number of people working at home: 175 (3.4% of all workers)
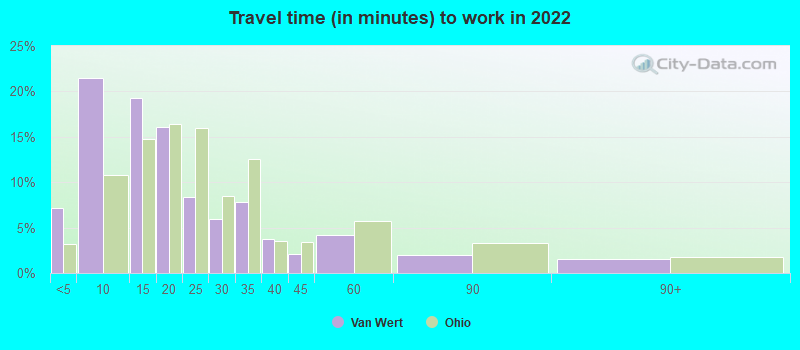
Travel time to work (commute)
- Less than 5 minutes: 502
- 5 to 9 minutes: 1,692
- 10 to 14 minutes: 1,021
- 15 to 19 minutes: 296
- 20 to 24 minutes: 159
- 25 to 29 minutes: 190
- 30 to 34 minutes: 188
- 35 to 39 minutes: 119
- 40 to 44 minutes: 173
- 45 to 59 minutes: 161
- 60 to 89 minutes: 188
- 90 or more minutes: 62
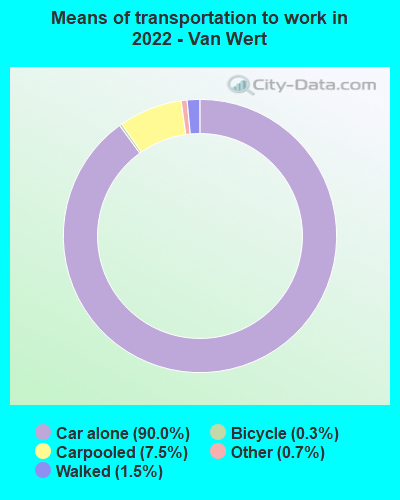
Means of transportation to work:
- Drove a car alone: 7,010 (84.8%)
- Carpooled: 625 (7.6%)
- Taxi: 64 (0.8%)
- Bicycle: 27 (0.3%)
- Walked: 119 (1.4%)
- Worked at home: 175 (2.1%)

- Unemployment by race in 2022
- Unemployment rate for White non-Hispanic residents
- 3.3%Males
- 3.0%Females
- Unemployment rate for Black residents
- 49.8%Females
- Unemployment rate for two or more race residents
- 12.6%Males
- Unemployment rate for Hispanic or Latino residents
- 5.8%Males

- Year of entry for the foreign-born population in Van Wert, Ohio
- 752010 or later
- 192000 to 2009
- 61990 to 1999
- 121980 to 1989
- 131970 to 1979
- 39Before 1970

First ancestries reported:
- German: 1,874 (40.9%)
- American: 624 (13.6%)
- English: 613 (13.4%)
- Irish: 238 (5.2%)
- European: 181 (3.9%)
- Hungarian: 67 (1.5%)
- Scottish: 57 (1.2%)
- Italian: 46 (1.0%)
- Welsh: 40 (0.9%)
- Norwegian: 21 (0.5%)
- Scotch-Irish: 20 (0.4%)
- Polish: 19 (0.4%)
- African: 12 (0.3%)
- Swiss: 11 (0.2%)
- French Canadian: 7 (0.2%)
- French: 6 (0.1%)
- Ghanaian: 6 (0.1%)
- British: 4 (0.09%)
- Swedish: 4 (0.09%)
- Celtic: 3 (0.07%)
Most common places of birth for foreign-born residents (%):
| Van Wert: | 52.4% (65) |
| Ohio: | 7.8% (44,796) |
| Van Wert: | 17.7% (22) |
| Ohio: | 0.8% (4,549) |
| Van Wert: | 7.3% (9) |
| Ohio: | 2.6% (14,988) |
| Van Wert: | 6.5% (8) |
| Ohio: | 3.1% (17,818) |
| Van Wert: | 6.5% (8) |
| Ohio: | 0.2% (1,360) |
| Van Wert: | 4.0% (5) |
| Ohio: | 0.6% (3,210) |
| Van Wert: | 2.4% (3) |
| Ohio: | 1.8% (10,561) |
Place of birth for U.S.-born residents:
- This state: 8,359
- Other state: 2,280
- Northeast: 193
- Midwest: 1,450
- South: 489
- West: 145
89.6% of Van Wert residents lived in the same house 1 years ago.
Out of people who lived in different houses, 39.3% lived in this county.
Out of people who lived in different counties, 76.2% lived in Ohio.
| Van Wert: | 89.6% |
| State average: | 87.8% |
Education attainment for males 25 years and older:
- No schooling: 46
- Nursery to 4th grade: 0
- 5th and 6th grade: 0
- 7th and 8th grade: 41
- 9th grade: 14
- 10th grade: 32
- 11th grade: 51
- 12th grade, no diploma: 47
- High school graduate (or equivalency): 1,457
- Less than 1 year of college: 350
- Some college more than 1 year, no degree: 449
- Associate degree: 179
- Bachelor's degree: 411
- Master's degree: 188
- Professional school degree: 36
- Doctorate degree: 32

Education attainment for females 25 years and older:
- No schooling: 21
- Nursery to 4th grade: 7
- 5th and 6th grade: 0
- 7th and 8th grade: 17
- 9th grade: 42
- 10th grade: 33
- 11th grade: 142
- 12th grade, no diploma: 96
- High school graduate (or equivalency): 1,669
- Less than 1 year of college: 257
- Some college more than 1 year, no degree: 452
- Associate degree: 541
- Bachelor's degree: 315
- Master's degree: 348
- Professional school degree: 22
- Doctorate degree: 2


Housing units in structures:
- One, detached: 3,925
- One, attached: 46
- Two: 236
- 3 or 4: 245
- 5 to 9: 145
- 10 to 19: 107
- 20 to 49: 83
- 50 or more: 42
- Mobile homes: 105
Housing units lacking complete kitchen facilities in 2022: 4.2%
House/condo owner moved in on average 14 years ago
Renter moved in on average 5 years ago

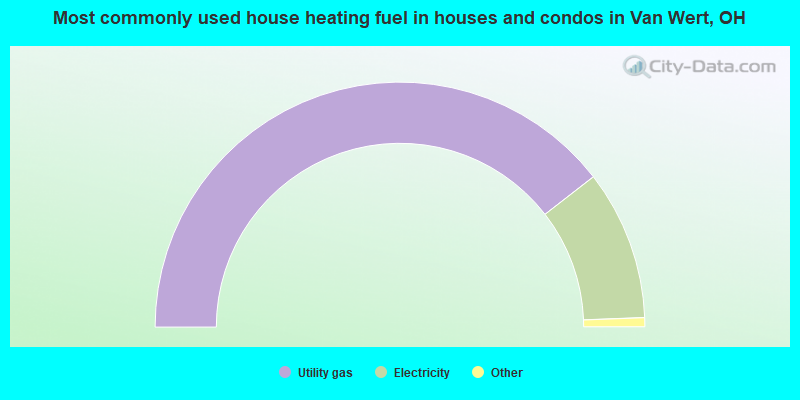
- 79.0%Utility gas
- 19.8%Electricity
- 0.8%Fuel oil, kerosene, etc.
- 0.2%Wood
- 0.1%Bottled, tank, or LP gas
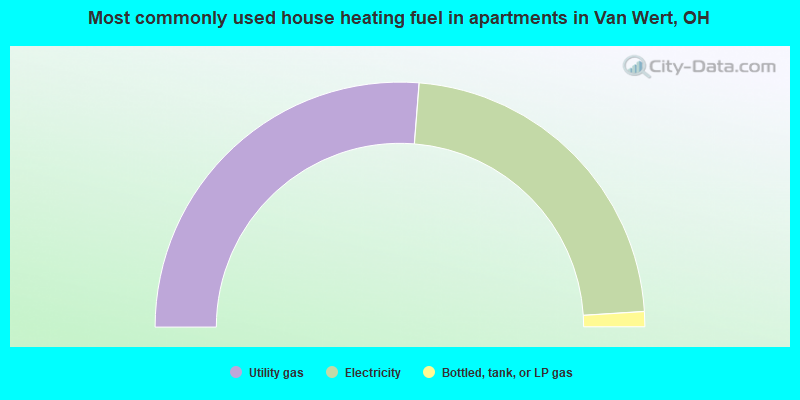
- 52.5%Utility gas
- 45.5%Electricity
- 2.0%Bottled, tank, or LP gas
Private vs. public school enrollment:
| Here: | 5.9% |
| Ohio: | 16.0% |
| Here: | 4.7% |
| Ohio: | 13.1% |
| Here: | 6.7% |
| Ohio: | 22.3% |


