Boston, Tennessee (TN) income map, earnings map, and wages data
The median household income in Boston, TN in 2022 was $106,977, which was 39.0% greater than the median annual income of $65,254 across the entire state of Tennessee. Compared to the median income of $57,185 in 2000 this represents an increase of 46.5%. The per capita income in 2022 was $42,719, which means an increase of 48.2% compared to 2000 when it was $22,131.
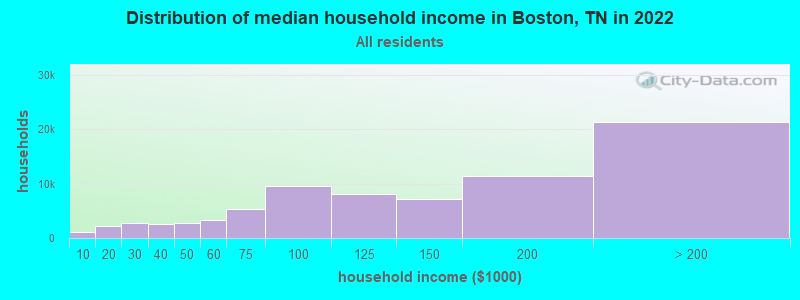
Income statistics for all residents
Median household income in Boston, TN in 2022:| Boston: | $106,978 |
| Tennessee: | $65,254 |
Change in median household income between 2000 and 2022:| Boston, Tennessee: | +87.1% |
| State: | +79.5% |
Number of households with income < $10k:| Boston: | 1.5% (1,155) |
| Tennessee: | 5.4% (154,793) |
Number of households with income $10k - 20k:| Boston: | 2.8% (2,158) |
| Tennessee: | 8.0% (228,599) |
Number of households with income $20k - 30k:| Boston: | 3.5% (2,739) |
| State: | 7.9% (224,908) |
Number of households with income $30k - 40k:| Boston: | 3.4% (2,608) |
| Tennessee: | 8.6% (244,297) |
Number of households with income $40k - 50k:| Boston: | 3.5% (2,693) |
| State: | 8.4% (238,949) |
Number of households with income $50k - 60k:| Boston: | 4.2% (3,240) |
| State: | 7.7% (218,438) |
Number of households with income $60k - 75k:| Boston: | 7.0% (5,421) |
| State: | 10.3% (294,172) |
Number of households with income $75k - 100k:| Boston: | 12.2% (9,493) |
| Tennessee: | 13.3% (377,310) |
Number of households with income $100k - 125k:| Boston: | 10.5% (8,128) |
| Tennessee: | 9.5% (269,124) |
Number of households with income $125k - 150k:| Boston: | 9.2% (7,149) |
| Tennessee: | 6.3% (178,328) |
Number of households with income $150k - 200k:| Boston: | 14.7% (11,431) |
| Tennessee: | 7.2% (204,030) |
Number of households with income > $200k:| Boston: | 27.5% (21,367) |
| State: | 7.5% (213,736) |
Aggregate household income in Boston in 2022: $1,632,466,179
Median family income in Boston in 2022:| Boston: | $112,135 |
| State: | $80,910 |
Median non-family income in Boston in 2022:| Boston: | $55,212 |
| State: | $40,285 |
Change in median non-family income between 2000 and 2022:| Boston, Tennessee: | +76.2% |
| State: | +91.5% |
Median per capita income in Boston in 2022:| Boston: | $42,719 |
| State: | $36,704 |
Change in median per capita income between 2000 and 2022:| Boston, Tennessee: | +93.0% |
| State: | +89.3% |
Income statistics for White residents
Median household income in Boston, TN in 2022:| Boston: | $105,991 |
| State: | $69,826 |
Change in median household income between 2000 and 2022:| Boston, Tennessee: | +83.3% |
| Tennessee: | +82.9% |
Number of households with income < $10k:| Boston: | 1.5% (994) |
| Tennessee: | 4.6% (100,279) |
Number of households with income $10k - 20k:| Boston: | 3.0% (1,951) |
| State: | 7.6% (165,031) |
Number of households with income $20k - 30k:| Boston: | 3.3% (2,169) |
| State: | 7.4% (160,229) |
Number of households with income $30k - 40k:| Boston: | 3.5% (2,303) |
| State: | 8.1% (174,784) |
Number of households with income $40k - 50k:| Boston: | 3.5% (2,268) |
| State: | 7.8% (169,622) |
Number of households with income $50k - 60k:| Boston: | 4.4% (2,864) |
| State: | 7.6% (165,508) |
Number of households with income $60k - 75k:| Boston: | 6.7% (4,415) |
| State: | 10.3% (223,937) |
Number of households with income $75k - 100k:| Boston: | 11.7% (7,656) |
| State: | 13.5% (292,688) |
Number of households with income $100k - 125k:| Boston: | 10.8% (7,104) |
| State: | 10.1% (219,251) |
Number of households with income $125k - 150k:| Boston: | 9.2% (6,035) |
| Tennessee: | 6.6% (142,574) |
Number of households with income $150k - 200k:| Boston: | 14.7% (9,625) |
| State: | 7.7% (166,039) |
Number of households with income > $200k:| Boston: | 27.8% (18,229) |
| State: | 8.5% (184,546) |
Aggregate household income in Boston in 2022: $1,309,396,806
Median family income in Boston in 2022:| Boston: | $112,229 |
| Tennessee: | $86,015 |
Number of families with income < $10k:| Boston: | 3.6% (111) |
| State: | 3.1% (43,751) |
Number of families with income $10k - 20k:| Boston: | 2.5% (76) |
| Tennessee: | 3.5% (49,925) |
Number of families with income $20k - 30k:| Boston: | 4.1% (126) |
| State: | 5.0% (70,431) |
Number of families with income $30k - 40k:| Boston: | 5.1% (156) |
| Tennessee: | 6.6% (93,498) |
Number of families with income $40k - 50k:| Boston: | 4.9% (149) |
| Tennessee: | 6.8% (96,726) |
Number of families with income $50k - 60k:| Boston: | 11.2% (341) |
| State: | 7.2% (101,879) |
Number of families with income $60k - 75k:| Boston: | 13.8% (423) |
| State: | 10.7% (151,997) |
Number of families with income $75k - 100k:| Boston: | 22.0% (672) |
| State: | 15.4% (218,373) |
Number of families with income $100k - 125k:| Boston: | 9.1% (277) |
| State: | 12.6% (178,761) |
Number of families with income $125k - 150k:| Boston: | 5.3% (162) |
| State: | 8.2% (116,575) |
Number of families with income $150k - 200k:| Boston: | 5.9% (180) |
| State: | 9.9% (141,123) |
Number of families with income > $200k:| Boston: | 12.7% (387) |
| Tennessee: | 11.2% (159,431) |
Median non-family income in Boston in 2022:| Boston: | $53,051 |
| Tennessee: | $41,178 |
Change in median non-family income between 2000 and 2022:| Boston, Tennessee: | +69.5% |
| Tennessee: | +91.1% |
Median per capita income in Boston in 2022:| Boston: | $43,540 |
| State: | $40,126 |
Change in median per capita income between 2000 and 2022:| Boston, Tennessee: | +95.5% |
| Tennessee: | +92.6% |
Income statistics for Black or African American residents
Median household income in Boston, TN in 2022:| Boston: | $105,426 |
| State: | $49,531 |
Change in median household income between 2000 and 2022:| Boston, Tennessee: | +124.5% |
| Tennessee: | +82.3% |
Number of households with income < $10k:| Boston: | 9.1% (34,604) |
| State: | 9.1% (39,909) |
Number of households with income $10k - 20k:| Boston: | 10.5% (40,028) |
| State: | 10.5% (46,276) |
Number of households with income $20k - 30k:| Boston: | 10.2% (39,045) |
| State: | 10.2% (45,072) |
Number of households with income $30k - 40k:| Boston: | 10.0% (37,958) |
| Tennessee: | 10.0% (43,885) |
Number of households with income $40k - 50k:| Boston: | 10.7% (40,964) |
| State: | 10.7% (47,267) |
Number of households with income $50k - 60k:| Boston: | 7.7% (29,317) |
| State: | 7.7% (33,868) |
Number of households with income $60k - 75k:| Boston: | 10.5% (40,036) |
| State: | 10.5% (46,247) |
Number of households with income $75k - 100k:| Boston: | 12.6% (47,972) |
| State: | 12.6% (55,465) |
Number of households with income $100k - 125k:| Boston: | 6.7% (25,491) |
| State: | 6.7% (29,515) |
Number of households with income $125k - 150k:| Boston: | 4.8% (18,422) |
| State: | 4.8% (21,306) |
Number of households with income $150k - 200k:| Boston: | 4.6% (17,601) |
| Tennessee: | 4.6% (20,425) |
Number of households with income > $200k:| Boston: | 2.5% (9,641) |
| State: | 2.5% (11,183) |
Aggregate household income in Boston in 2022: $24,882,914
Median family income in Boston in 2022:| Boston: | $107,711 |
| State: | $61,153 |
Number of families with income < $10k:| Boston: | 0.3% (1) |
| Tennessee: | 7.9% (20,476) |
Number of families with income $10k - 20k:| Boston: | 1.1% (4) |
| Tennessee: | 6.0% (15,530) |
Number of families with income $20k - 30k:| Boston: | 0.4% (2) |
| Tennessee: | 8.6% (22,263) |
Number of families with income $30k - 40k:| Boston: | 1.6% (6) |
| Tennessee: | 9.3% (24,089) |
Number of families with income $40k - 50k:| Boston: | 9.1% (34) |
| State: | 10.2% (26,463) |
Number of families with income $50k - 60k:| Boston: | 5.7% (21) |
| State: | 6.9% (17,798) |
Number of families with income $60k - 75k:| Boston: | 1.4% (5) |
| State: | 11.6% (30,015) |
Number of families with income $75k - 100k:| Boston: | 8.1% (30) |
| State: | 14.7% (38,065) |
Number of families with income $100k - 125k:| Boston: | 1.1% (4) |
| State: | 8.8% (22,648) |
Number of families with income $150k - 200k:| Boston: | 65.5% (242) |
| State: | 6.4% (16,520) |
Number of families with income > $200k:| Boston: | 5.6% (21) |
| State: | 3.4% (8,711) |
Median non-family income in Boston in 2022:| Boston: | $70,956 |
| Tennessee: | $35,793 |
Change in median non-family income between 2000 and 2022:| Boston, Tennessee: | +121.7% |
| Tennessee: | +104.3% |
Median per capita income in Boston in 2022:| Boston: | $34,187 |
| State: | $27,306 |
Change in median per capita income between 2000 and 2022:| Boston, Tennessee: | +46.0% |
| State: | +105.3% |
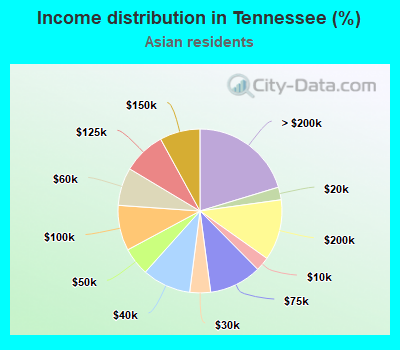
Income statistics for Asian residents
Median household income in Boston, TN in 2022:| Boston: | $50,222 |
| State: | $94,814 |
Change in median household income between 2000 and 2022:| Boston, Tennessee: | +115.7% |
| Tennessee: | +108.4% |
Number of households with income < $10k:| Boston: | 2.8% (623) |
| State: | 2.8% (1,217) |
Number of households with income $10k - 20k:| Boston: | 2.5% (559) |
| State: | 2.5% (1,093) |
Number of households with income $20k - 30k:| Boston: | 4.1% (919) |
| State: | 4.1% (1,796) |
Number of households with income $30k - 40k:| Boston: | 9.6% (2,153) |
| Tennessee: | 9.6% (4,208) |
Number of households with income $40k - 50k:| Boston: | 5.5% (1,240) |
| State: | 5.5% (2,423) |
Number of households with income $50k - 60k:| Boston: | 7.5% (1,677) |
| Tennessee: | 7.5% (3,277) |
Number of households with income $60k - 75k:| Boston: | 10.3% (2,313) |
| State: | 10.3% (4,520) |
Number of households with income $75k - 100k:| Boston: | 9.0% (2,009) |
| State: | 9.0% (3,926) |
Number of households with income $100k - 125k:| Boston: | 8.4% (1,893) |
| State: | 8.4% (3,699) |
Number of households with income $125k - 150k:| Boston: | 8.0% (1,785) |
| State: | 8.0% (3,488) |
Number of households with income $150k - 200k:| Boston: | 12.0% (2,693) |
| State: | 12.0% (5,262) |
Number of households with income > $200k:| Boston: | 20.3% (4,556) |
| State: | 20.3% (8,903) |
Aggregate household income in Boston in 2022: $5,056,431
Median family income in Boston in 2022:| Boston: | $47,665 |
| State: | $118,868 |
Median per capita income in Boston in 2022:| Boston: | $28,934 |
| Tennessee: | $46,931 |
Income statistics for Hispanic or Latino residents
Median household income in Boston, TN in 2022:| Boston: | $126,138 |
| State: | $58,385 |
Change in median household income between 2000 and 2022:| Boston, Tennessee: | +46.7% |
| Tennessee: | +82.3% |
Number of households with income < $10k:| Boston: | 7.2% (11,526) |
| State: | 7.2% (8,567) |
Number of households with income $10k - 20k:| Boston: | 6.4% (10,286) |
| Tennessee: | 6.4% (7,670) |
Number of households with income $20k - 30k:| Boston: | 9.4% (15,048) |
| State: | 9.4% (11,247) |
Number of households with income $30k - 40k:| Boston: | 10.1% (16,170) |
| State: | 10.1% (12,072) |
Number of households with income $40k - 50k:| Boston: | 10.0% (16,028) |
| State: | 10.0% (11,947) |
Number of households with income $50k - 60k:| Boston: | 8.0% (12,832) |
| State: | 8.0% (9,569) |
Number of households with income $60k - 75k:| Boston: | 10.3% (16,497) |
| State: | 10.3% (12,315) |
Number of households with income $75k - 100k:| Boston: | 15.3% (24,588) |
| State: | 15.3% (18,285) |
Number of households with income $100k - 125k:| Boston: | 8.3% (13,330) |
| Tennessee: | 8.3% (9,886) |
Number of households with income $125k - 150k:| Boston: | 5.9% (9,502) |
| State: | 5.9% (7,066) |
Number of households with income $150k - 200k:| Boston: | 4.9% (7,813) |
| State: | 4.9% (5,822) |
Number of households with income > $200k:| Boston: | 4.5% (7,163) |
| State: | 4.5% (5,337) |
Aggregate household income in Boston in 2022: $31,156,282
Median family income in Boston in 2022:| Boston: | $158,769 |
| Tennessee: | $64,014 |
Number of families with income < $10k:| Boston: | 3.8% (7) |
| State: | 6.5% (5,773) |
Number of families with income $10k - 20k:| Boston: | 2.8% (5) |
| State: | 5.4% (4,773) |
Number of families with income $20k - 30k:| Boston: | 3.8% (7) |
| State: | 9.2% (8,233) |
Number of families with income $30k - 40k:| Boston: | 6.5% (12) |
| State: | 9.6% (8,514) |
Number of families with income $40k - 50k:| Boston: | 7.1% (13) |
| State: | 8.8% (7,850) |
Number of families with income $50k - 60k:| Boston: | 9.8% (19) |
| State: | 7.9% (7,017) |
Number of families with income $60k - 75k:| Boston: | 16.5% (31) |
| Tennessee: | 10.8% (9,605) |
Number of families with income $75k - 100k:| Boston: | 27.2% (52) |
| Tennessee: | 16.6% (14,820) |
Number of families with income $100k - 125k:| Boston: | 8.7% (17) |
| State: | 8.4% (7,480) |
Number of families with income $125k - 150k:| Boston: | 6.1% (12) |
| State: | 6.3% (5,594) |
Number of families with income $150k - 200k:| Boston: | 3.8% (7) |
| State: | 5.4% (4,817) |
Number of families with income > $200k:| Boston: | 3.8% (7) |
| State: | 5.1% (4,577) |
Median per capita income in Boston in 2022:| Boston: | $30,470 |
| State: | $21,276 |
Change in median per capita income between 2000 and 2022:| Boston, Tennessee: | +132.8% |
| State: | +76.0% |
Income statistics for American Indian and Alaska Native residents
Aggregate household income in Boston in 2022: $234,520
Median per capita income in Boston in 2022:| Boston: | $13,494 |
| State: | $25,981 |
Change in median per capita income between 2000 and 2022:| Boston, Tennessee: | +41.0% |
| Tennessee: | +40.2% |
Income statistics for Multirace residents
Median household income in Boston, TN in 2022:| Boston: | $170,082 |
| State: | $57,741 |
Change in median household income between 2000 and 2022:| Boston, Tennessee: | +106.4% |
| Tennessee: | +87.1% |
Number of households with income < $10k:| Boston: | 6.7% (13,176) |
| State: | 6.7% (9,867) |
Number of households with income $10k - 20k:| Boston: | 8.6% (16,844) |
| State: | 8.6% (12,639) |
Number of households with income $20k - 30k:| Boston: | 9.2% (18,026) |
| State: | 9.2% (13,555) |
Number of households with income $30k - 40k:| Boston: | 10.3% (20,203) |
| State: | 10.3% (15,117) |
Number of households with income $40k - 50k:| Boston: | 9.4% (18,434) |
| Tennessee: | 9.4% (13,829) |
Number of households with income $50k - 60k:| Boston: | 7.5% (14,629) |
| State: | 7.5% (10,969) |
Number of households with income $60k - 75k:| Boston: | 9.2% (18,032) |
| State: | 9.2% (13,568) |
Number of households with income $75k - 100k:| Boston: | 12.6% (24,738) |
| Tennessee: | 12.6% (18,516) |
Number of households with income $100k - 125k:| Boston: | 8.6% (16,918) |
| State: | 8.6% (12,656) |
Number of households with income $125k - 150k:| Boston: | 5.9% (11,570) |
| State: | 5.9% (8,674) |
Number of households with income $150k - 200k:| Boston: | 7.2% (14,079) |
| State: | 7.2% (10,611) |
Number of households with income > $200k:| Boston: | 4.7% (9,258) |
| Tennessee: | 4.8% (6,986) |
Aggregate household income in Boston in 2022: $63,441,179
Median family income in Boston in 2022:| Boston: | $186,027 |
| State: | $70,058 |
Number of families with income $50k - 60k:| Boston: | 20.9% (85) |
| State: | 6.9% (6,630) |
Number of families with income $75k - 100k:| Boston: | 79.1% (322) |
| State: | 15.0% (14,413) |
Median non-family income in Boston in 2022:| Boston: | $54,454 |
| Tennessee: | $39,395 |
Median per capita income in Boston in 2022:| Boston: | $32,742 |
| State: | $24,436 |
Change in median per capita income between 2000 and 2022:| Boston, Tennessee: | +90.3% |
| State: | +84.3% |
Income statistics for other residents
Number of households with income < $10k:| Boston: | 5.7% (6) |
| State: | 6.8% (2,986) |
Number of households with income $10k - 20k:| Boston: | 4.8% (5) |
| State: | 6.3% (2,777) |
Number of households with income $20k - 30k:| Boston: | 8.6% (9) |
| State: | 9.2% (4,034) |
Number of households with income $30k - 40k:| Boston: | 14.3% (15) |
| Tennessee: | 13.2% (5,819) |
Number of households with income $40k - 50k:| Boston: | 10.5% (11) |
| Tennessee: | 11.9% (5,244) |
Number of households with income $50k - 60k:| Boston: | 8.6% (9) |
| Tennessee: | 7.3% (3,232) |
Number of households with income $60k - 75k:| Boston: | 9.5% (10) |
| State: | 12.2% (5,384) |
Number of households with income $75k - 100k:| Boston: | 12.4% (13) |
| Tennessee: | 13.1% (5,771) |
Number of households with income $100k - 125k:| Boston: | 11.4% (12) |
| State: | 7.8% (3,429) |
Number of households with income $125k - 150k:| Boston: | 4.8% (5) |
| State: | 4.3% (1,881) |
Number of households with income $150k - 200k:| Boston: | 3.8% (4) |
| Tennessee: | 3.4% (1,486) |
Number of households with income > $200k:| Boston: | 5.7% (6) |
| State: | 4.6% (2,040) |
Aggregate household income in Boston in 2022: $8,433,249
Median family income in Boston in 2022:| Boston: | $194,801 |
| Tennessee: | $60,601 |
Number of families with income $30k - 40k:| Boston: | 8.3% (11) |
| State: | 10.7% (3,625) |
Number of families with income $75k - 100k:| Boston: | 91.7% (126) |
| State: | 16.5% (5,571) |
Median per capita income in Boston in 2022:| Boston: | $72,838 |
| State: | $21,430 |