Branford, Connecticut (CT) income map, earnings map, and wages data
The median household income in Branford, CT in 2022 was $98,159, which was 9.9% greater than the median annual income of $88,429 across the entire state of Connecticut. Compared to the median income of $58,009 in 2000 this represents an increase of 40.9%. The per capita income in 2022 was $59,088, which means an increase of 45.3% compared to 2000 when it was $32,301.
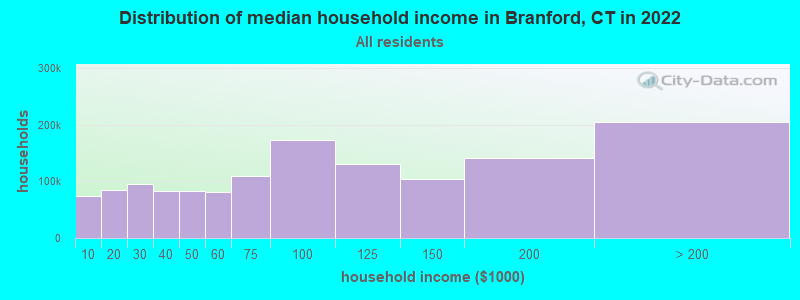
Income statistics for all residents
Median household income in Branford, CT in 2022:| Branford: | $98,159 |
| State: | $88,429 |
Change in median household income between 2000 and 2022:| Branford, Connecticut: | +69.2% |
| State: | +64.0% |
Number of households with income < $10k:| Branford: | 5.2% (39,982) |
| State: | 5.1% (72,746) |
Number of households with income $10k - 20k:| Branford: | 5.8% (45,085) |
| State: | 5.7% (81,643) |
Number of households with income $20k - 30k:| Branford: | 6.6% (51,033) |
| State: | 6.5% (92,844) |
Number of households with income $30k - 40k:| Branford: | 5.9% (45,799) |
| State: | 5.9% (83,934) |
Number of households with income $40k - 50k:| Branford: | 5.9% (45,505) |
| Connecticut: | 5.8% (83,025) |
Number of households with income $50k - 60k:| Branford: | 5.8% (44,620) |
| Connecticut: | 5.7% (81,788) |
Number of households with income $60k - 75k:| Branford: | 8.1% (62,519) |
| State: | 8.1% (115,651) |
Number of households with income $75k - 100k:| Branford: | 12.6% (97,640) |
| State: | 12.6% (180,173) |
Number of households with income $100k - 125k:| Branford: | 9.8% (76,012) |
| State: | 9.9% (141,231) |
Number of households with income $125k - 150k:| Branford: | 7.8% (60,703) |
| State: | 7.9% (112,826) |
Number of households with income $150k - 200k:| Branford: | 10.7% (83,037) |
| State: | 10.8% (154,641) |
Number of households with income > $200k:| Branford: | 16.0% (124,052) |
| Connecticut: | 16.3% (233,133) |
Aggregate household income in Branford in 2022: $39,174,261,092
Median family income in Branford in 2022:| Branford: | $124,144 |
| State: | $115,183 |
Median non-family income in Branford in 2022:| Branford: | $61,275 |
| State: | $50,964 |
Change in median non-family income between 2000 and 2022:| Branford, Connecticut: | +71.5% |
| State: | +65.1% |
Median per capita income in Branford in 2022:| Branford: | $59,088 |
| State: | $51,581 |
Change in median per capita income between 2000 and 2022:| Branford, Connecticut: | +82.9% |
| Connecticut: | +79.3% |
Income statistics for White residents
Median household income in Branford, CT in 2022:| Branford: | $97,509 |
| Connecticut: | $96,890 |
Change in median household income between 2000 and 2022:| Branford, Connecticut: | +69.4% |
| Connecticut: | +68.5% |
Number of households with income < $10k:| Branford: | 4.2% (21,327) |
| Connecticut: | 4.2% (42,265) |
Number of households with income $10k - 20k:| Branford: | 4.9% (24,520) |
| State: | 4.8% (48,323) |
Number of households with income $20k - 30k:| Branford: | 5.8% (29,160) |
| Connecticut: | 5.7% (57,716) |
Number of households with income $30k - 40k:| Branford: | 5.4% (26,993) |
| State: | 5.3% (53,827) |
Number of households with income $40k - 50k:| Branford: | 5.3% (26,880) |
| State: | 5.3% (53,301) |
Number of households with income $50k - 60k:| Branford: | 5.6% (27,975) |
| Connecticut: | 5.5% (55,690) |
Number of households with income $60k - 75k:| Branford: | 7.9% (39,977) |
| State: | 8.0% (80,329) |
Number of households with income $75k - 100k:| Branford: | 12.7% (64,059) |
| State: | 12.7% (128,070) |
Number of households with income $100k - 125k:| Branford: | 10.0% (50,301) |
| State: | 10.0% (101,210) |
Number of households with income $125k - 150k:| Branford: | 8.0% (40,383) |
| State: | 8.0% (81,250) |
Number of households with income $150k - 200k:| Branford: | 11.8% (59,380) |
| Connecticut: | 11.8% (119,527) |
Number of households with income > $200k:| Branford: | 18.4% (92,957) |
| State: | 18.6% (187,875) |
Aggregate household income in Branford in 2022: $28,593,352,856
Median family income in Branford in 2022:| Branford: | $128,238 |
| Connecticut: | $128,955 |
Number of families with income < $10k:| Branford: | 2.4% (155) |
| Connecticut: | 1.9% (11,537) |
Number of families with income $10k - 20k:| Branford: | 1.7% (110) |
| State: | 1.8% (11,289) |
Number of families with income $20k - 30k:| Branford: | 2.9% (187) |
| State: | 3.0% (18,506) |
Number of families with income $30k - 40k:| Branford: | 3.0% (194) |
| State: | 2.9% (18,160) |
Number of families with income $40k - 50k:| Branford: | 4.0% (257) |
| State: | 3.9% (24,550) |
Number of families with income $50k - 60k:| Branford: | 4.3% (275) |
| Connecticut: | 4.3% (26,723) |
Number of families with income $60k - 75k:| Branford: | 7.9% (506) |
| State: | 7.1% (44,075) |
Number of families with income $75k - 100k:| Branford: | 14.4% (923) |
| Connecticut: | 12.5% (77,679) |
Number of families with income $100k - 125k:| Branford: | 10.4% (667) |
| State: | 11.1% (69,086) |
Number of families with income $125k - 150k:| Branford: | 9.9% (634) |
| Connecticut: | 9.6% (59,616) |
Number of families with income $150k - 200k:| Branford: | 15.4% (987) |
| Connecticut: | 15.7% (97,890) |
Number of families with income > $200k:| Branford: | 23.4% (1,495) |
| State: | 26.3% (163,417) |
Median non-family income in Branford in 2022:| Branford: | $61,682 |
| Connecticut: | $54,067 |
Change in median non-family income between 2000 and 2022:| Branford, Connecticut: | +73.7% |
| State: | +68.7% |
Median per capita income in Branford in 2022:| Branford: | $63,146 |
| State: | $59,916 |
Change in median per capita income between 2000 and 2022:| Branford, Connecticut: | +92.1% |
| State: | +90.2% |
Income statistics for Black or African American residents
Median household income in Branford, CT in 2022:| Branford: | $107,138 |
| State: | $61,803 |
Change in median household income between 2000 and 2022:| Branford, Connecticut: | +60.9% |
| State: | +76.1% |
Number of households with income < $10k:| Branford: | 6.8% (18,008) |
| State: | 6.8% (9,494) |
Number of households with income $10k - 20k:| Branford: | 7.9% (20,870) |
| Connecticut: | 7.9% (11,003) |
Number of households with income $20k - 30k:| Branford: | 10.8% (28,536) |
| Connecticut: | 10.8% (15,045) |
Number of households with income $30k - 40k:| Branford: | 8.2% (21,815) |
| State: | 8.2% (11,501) |
Number of households with income $40k - 50k:| Branford: | 7.4% (19,756) |
| State: | 7.4% (10,416) |
Number of households with income $50k - 60k:| Branford: | 7.5% (19,980) |
| Connecticut: | 7.5% (10,534) |
Number of households with income $60k - 75k:| Branford: | 8.0% (21,327) |
| State: | 8.0% (11,244) |
Number of households with income $75k - 100k:| Branford: | 9.6% (25,359) |
| State: | 9.6% (13,370) |
Number of households with income $100k - 125k:| Branford: | 10.2% (27,017) |
| State: | 10.2% (14,244) |
Number of households with income $125k - 150k:| Branford: | 8.0% (21,331) |
| State: | 8.0% (11,246) |
Number of households with income $150k - 200k:| Branford: | 7.7% (20,346) |
| State: | 7.7% (10,727) |
Number of households with income > $200k:| Branford: | 7.9% (21,027) |
| Connecticut: | 7.9% (11,086) |
Aggregate household income in Branford in 2022: $63,440,467
Median family income in Branford in 2022:| Branford: | $204,901 |
| Connecticut: | $87,228 |
Number of families with income $20k - 30k:| Branford: | 1.8% (4) |
| State: | 6.0% (5,015) |
Number of families with income $40k - 50k:| Branford: | 3.6% (9) |
| State: | 6.6% (5,531) |
Number of families with income $60k - 75k:| Branford: | 9.7% (24) |
| State: | 8.2% (6,861) |
Number of families with income $75k - 100k:| Branford: | 9.6% (24) |
| State: | 12.7% (10,598) |
Number of families with income $100k - 125k:| Branford: | 23.5% (59) |
| State: | 11.4% (9,482) |
Number of families with income $150k - 200k:| Branford: | 51.9% (131) |
| State: | 11.4% (9,497) |
Median non-family income in Branford in 2022:| Branford: | $103,237 |
| Connecticut: | $38,608 |
Change in median non-family income between 2000 and 2022:| Branford, Connecticut: | +77.0% |
| State: | +77.0% |
Median per capita income in Branford in 2022:| Branford: | $67,345 |
| Connecticut: | $36,289 |
Change in median per capita income between 2000 and 2022:| Branford, Connecticut: | +115.2% |
| State: | +117.5% |
Income statistics for Asian residents
Median household income in Branford, CT in 2022:| Branford: | $164,232 |
| State: | $110,568 |
Change in median household income between 2000 and 2022:| Branford, Connecticut: | +110.1% |
| Connecticut: | +79.5% |
Number of households with income < $10k:| Branford: | 7.1% (5,388) |
| Connecticut: | 7.1% (4,245) |
Number of households with income $10k - 20k:| Branford: | 3.5% (2,649) |
| Connecticut: | 3.5% (2,087) |
Number of households with income $20k - 30k:| Branford: | 4.1% (3,128) |
| State: | 4.1% (2,464) |
Number of households with income $30k - 40k:| Branford: | 4.1% (3,146) |
| Connecticut: | 4.1% (2,478) |
Number of households with income $40k - 50k:| Branford: | 3.3% (2,517) |
| State: | 3.3% (1,983) |
Number of households with income $50k - 60k:| Branford: | 3.9% (2,955) |
| Connecticut: | 3.9% (2,328) |
Number of households with income $60k - 75k:| Branford: | 7.0% (5,367) |
| State: | 7.0% (4,228) |
Number of households with income $75k - 100k:| Branford: | 11.5% (8,772) |
| Connecticut: | 11.5% (6,911) |
Number of households with income $100k - 125k:| Branford: | 10.2% (7,777) |
| State: | 10.2% (6,127) |
Number of households with income $125k - 150k:| Branford: | 8.5% (6,447) |
| State: | 8.5% (5,079) |
Number of households with income $150k - 200k:| Branford: | 12.4% (9,436) |
| State: | 12.4% (7,434) |
Number of households with income > $200k:| Branford: | 24.4% (18,609) |
| State: | 24.4% (14,661) |
Aggregate household income in Branford in 2022: $100,287,608
Median family income in Branford in 2022:| Branford: | $158,514 |
| State: | $134,548 |
Number of families with income < $10k:| Branford: | 5.2% (21) |
| Connecticut: | 4.3% (1,875) |
Number of families with income $10k - 20k:| Branford: | 0.6% (3) |
| Connecticut: | 1.6% (700) |
Number of families with income $20k - 30k:| Branford: | 1.3% (5) |
| State: | 3.8% (1,682) |
Number of families with income $30k - 40k:| Branford: | 2.5% (10) |
| State: | 3.8% (1,652) |
Number of families with income $40k - 50k:| Branford: | 1.3% (5) |
| State: | 2.0% (863) |
Number of families with income $50k - 60k:| Branford: | 9.3% (38) |
| State: | 3.7% (1,635) |
Number of families with income $60k - 75k:| Branford: | 6.2% (25) |
| State: | 6.0% (2,651) |
Number of families with income $75k - 100k:| Branford: | 18.5% (75) |
| Connecticut: | 11.0% (4,844) |
Number of families with income $100k - 125k:| Branford: | 9.4% (38) |
| Connecticut: | 10.5% (4,621) |
Number of families with income $125k - 150k:| Branford: | 14.0% (57) |
| State: | 8.2% (3,588) |
Number of families with income $150k - 200k:| Branford: | 31.7% (129) |
| Connecticut: | 14.2% (6,237) |
Median non-family income in Branford in 2022:| Branford: | $194,801 |
| State: | $63,785 |
Change in median non-family income between 2000 and 2022:| Branford, Connecticut: | +148.6% |
| State: | +77.9% |
Median per capita income in Branford in 2022:| Branford: | $50,059 |
| Connecticut: | $55,295 |
Change in median per capita income between 2000 and 2022:| Branford, Connecticut: | +103.6% |
| Connecticut: | +97.8% |
Income statistics for Hispanic or Latino residents
Median household income in Branford, CT in 2022:| Branford: | $62,574 |
| Connecticut: | $60,275 |
Change in median household income between 2000 and 2022:| Branford, Connecticut: | +67.8% |
| Connecticut: | +87.9% |
Number of households with income < $10k:| Branford: | 8.7% (21,607) |
| State: | 8.7% (18,584) |
Number of households with income $10k - 20k:| Branford: | 9.1% (22,363) |
| State: | 9.1% (19,235) |
Number of households with income $20k - 30k:| Branford: | 8.9% (22,078) |
| Connecticut: | 8.9% (18,989) |
Number of households with income $30k - 40k:| Branford: | 7.5% (18,564) |
| State: | 7.5% (15,967) |
Number of households with income $40k - 50k:| Branford: | 8.7% (21,469) |
| State: | 8.7% (18,466) |
Number of households with income $50k - 60k:| Branford: | 6.9% (17,098) |
| State: | 6.9% (14,706) |
Number of households with income $60k - 75k:| Branford: | 8.9% (21,960) |
| State: | 8.9% (18,888) |
Number of households with income $75k - 100k:| Branford: | 13.5% (33,332) |
| Connecticut: | 13.5% (28,669) |
Number of households with income $100k - 125k:| Branford: | 8.2% (20,270) |
| Connecticut: | 8.2% (17,434) |
Number of households with income $125k - 150k:| Branford: | 6.5% (15,989) |
| State: | 6.5% (13,752) |
Number of households with income $150k - 200k:| Branford: | 6.6% (16,410) |
| Connecticut: | 6.6% (14,114) |
Number of households with income > $200k:| Branford: | 6.4% (15,847) |
| Connecticut: | 6.4% (13,630) |
Aggregate household income in Branford in 2022: $90,258,103
Median family income in Branford in 2022:| Branford: | $83,535 |
| Connecticut: | $68,336 |
Number of families with income < $10k:| Branford: | 5.4% (78) |
| State: | 5.2% (7,456) |
Number of families with income $10k - 20k:| Branford: | 5.5% (79) |
| Connecticut: | 6.0% (8,616) |
Number of families with income $20k - 30k:| Branford: | 9.7% (140) |
| State: | 8.9% (12,680) |
Number of families with income $30k - 40k:| Branford: | 7.5% (107) |
| Connecticut: | 8.5% (12,090) |
Number of families with income $40k - 50k:| Branford: | 9.0% (129) |
| State: | 8.8% (12,624) |
Number of families with income $50k - 60k:| Branford: | 8.9% (127) |
| State: | 8.4% (11,924) |
Number of families with income $60k - 75k:| Branford: | 9.4% (135) |
| Connecticut: | 8.9% (12,677) |
Number of families with income $75k - 100k:| Branford: | 16.7% (240) |
| State: | 14.3% (20,457) |
Number of families with income $100k - 125k:| Branford: | 7.3% (105) |
| State: | 8.2% (11,720) |
Number of families with income $125k - 150k:| Branford: | 8.2% (118) |
| State: | 8.2% (11,729) |
Number of families with income $150k - 200k:| Branford: | 6.5% (93) |
| State: | 7.1% (10,096) |
Number of families with income > $200k:| Branford: | 5.9% (84) |
| State: | 7.4% (10,622) |
Median non-family income in Branford in 2022:| Branford: | $47,547 |
| Connecticut: | $36,714 |
Change in median non-family income between 2000 and 2022:| Branford, Connecticut: | +73.9% |
| State: | +90.0% |
Median per capita income in Branford in 2022:| Branford: | $31,727 |
| State: | $28,507 |
Change in median per capita income between 2000 and 2022:| Branford, Connecticut: | +80.3% |
| State: | +117.2% |
Income statistics for American Indian and Alaska Native residents
Median household income in Branford, CT in 2022:| Branford: | $34,879 |
| Connecticut: | $41,848 |
Change in median household income between 2000 and 2022:| Branford, Connecticut: | +12.9% |
| State: | +12.9% |
Number of households with income < $10k:| Branford: | 8.4% (87,874) |
| State: | 10.2% (340) |
Number of households with income $10k - 20k:| Branford: | 9.4% (98,066) |
| Connecticut: | 8.5% (283) |
Number of households with income $20k - 30k:| Branford: | 8.5% (88,702) |
| State: | 9.4% (314) |
Number of households with income $30k - 40k:| Branford: | 9.1% (95,033) |
| State: | 10.1% (337) |
Number of households with income $40k - 50k:| Branford: | 8.3% (87,171) |
| Connecticut: | 13.4% (447) |
Number of households with income $50k - 60k:| Branford: | 7.8% (82,195) |
| Connecticut: | 3.1% (104) |
Number of households with income $60k - 75k:| Branford: | 9.8% (102,452) |
| State: | 5.6% (188) |
Number of households with income $75k - 100k:| Branford: | 12.6% (132,249) |
| State: | 13.4% (447) |
Number of households with income $100k - 125k:| Branford: | 9.4% (98,896) |
| State: | 9.5% (317) |
Number of households with income $125k - 150k:| Branford: | 5.6% (59,208) |
| State: | 3.9% (131) |
Number of households with income $150k - 200k:| Branford: | 6.0% (62,417) |
| State: | 6.3% (212) |
Number of households with income > $200k:| Branford: | 5.2% (54,025) |
| Connecticut: | 6.8% (228) |
Aggregate household income in Branford in 2022: $808,190
Median family income in Branford in 2022:| Branford: | $3,415 |
| State: | $57,217 |
Median non-family income in Branford in 2022:| Branford: | $70,338 |
| State: | $40,310 |
Change in median non-family income between 2000 and 2022:| Branford, Connecticut: | +125.1% |
| State: | +125.1% |
Median per capita income in Branford in 2022:| Branford: | $15,630 |
| State: | $25,355 |
Change in median per capita income between 2000 and 2022:| Branford, Connecticut: | +45.9% |
| Connecticut: | +39.4% |
Income statistics for Multirace residents
Median household income in Branford, CT in 2022:| Branford: | $82,633 |
| State: | $77,277 |
Change in median household income between 2000 and 2022:| Branford, Connecticut: | +119.4% |
| Connecticut: | +113.6% |
Number of households with income < $10k:| Branford: | 6.0% (7,760) |
| State: | 6.0% (7,457) |
Number of households with income $10k - 20k:| Branford: | 8.1% (10,551) |
| Connecticut: | 8.1% (10,139) |
Number of households with income $20k - 30k:| Branford: | 7.0% (9,055) |
| State: | 7.0% (8,702) |
Number of households with income $30k - 40k:| Branford: | 6.9% (8,893) |
| State: | 6.9% (8,546) |
Number of households with income $40k - 50k:| Branford: | 7.0% (9,066) |
| State: | 7.0% (8,712) |
Number of households with income $50k - 60k:| Branford: | 5.9% (7,629) |
| Connecticut: | 5.9% (7,331) |
Number of households with income $60k - 75k:| Branford: | 8.5% (11,066) |
| State: | 8.5% (10,634) |
Number of households with income $75k - 100k:| Branford: | 14.1% (18,315) |
| State: | 14.1% (17,600) |
Number of households with income $100k - 125k:| Branford: | 9.9% (12,886) |
| Connecticut: | 9.9% (12,383) |
Number of households with income $125k - 150k:| Branford: | 7.2% (9,283) |
| State: | 7.2% (8,921) |
Number of households with income $150k - 200k:| Branford: | 8.8% (11,366) |
| Connecticut: | 8.8% (10,922) |
Number of households with income > $200k:| Branford: | 10.6% (13,785) |
| State: | 10.6% (13,247) |
Aggregate household income in Branford in 2022: $73,685,830
Median family income in Branford in 2022:| Branford: | $81,988 |
| State: | $84,255 |
Number of families with income < $10k:| Branford: | 6.2% (15) |
| State: | 3.6% (3,027) |
Number of families with income $10k - 20k:| Branford: | 21.9% (53) |
| State: | 4.8% (4,079) |
Number of families with income $20k - 30k:| Branford: | 12.3% (30) |
| State: | 6.9% (5,812) |
Number of families with income $30k - 40k:| Branford: | 9.2% (23) |
| State: | 6.8% (5,759) |
Number of families with income $40k - 50k:| Branford: | 19.1% (47) |
| Connecticut: | 6.9% (5,792) |
Number of families with income $50k - 60k:| Branford: | 9.4% (23) |
| Connecticut: | 7.6% (6,420) |
Number of families with income $60k - 75k:| Branford: | 21.9% (53) |
| Connecticut: | 7.8% (6,550) |
Median non-family income in Branford in 2022:| Branford: | $67,205 |
| Connecticut: | $44,462 |
Change in median non-family income between 2000 and 2022:| Branford, Connecticut: | +81.0% |
| Connecticut: | +97.6% |
Median per capita income in Branford in 2022:| Branford: | $30,040 |
| State: | $32,794 |
Change in median per capita income between 2000 and 2022:| Branford, Connecticut: | +95.5% |
| State: | +117.2% |
Income statistics for other residents
Number of households with income < $10k:| Branford: | 9.0% (11,251) |
| Connecticut: | 9.0% (8,596) |
Number of households with income $10k - 20k:| Branford: | 10.2% (12,791) |
| State: | 10.2% (9,773) |
Number of households with income $20k - 30k:| Branford: | 9.1% (11,375) |
| State: | 9.1% (8,691) |
Number of households with income $30k - 40k:| Branford: | 7.8% (9,747) |
| Connecticut: | 7.8% (7,447) |
Number of households with income $40k - 50k:| Branford: | 8.2% (10,287) |
| State: | 8.2% (7,860) |
Number of households with income $50k - 60k:| Branford: | 6.0% (7,535) |
| Connecticut: | 6.0% (5,757) |
Number of households with income $60k - 75k:| Branford: | 9.3% (11,704) |
| State: | 9.3% (8,942) |
Number of households with income $75k - 100k:| Branford: | 14.3% (17,931) |
| State: | 14.3% (13,700) |
Number of households with income $100k - 125k:| Branford: | 7.2% (9,039) |
| State: | 7.2% (6,906) |
Number of households with income $125k - 150k:| Branford: | 6.5% (8,134) |
| State: | 6.5% (6,215) |
Number of households with income $150k - 200k:| Branford: | 6.1% (7,676) |
| State: | 6.1% (5,865) |
Number of households with income > $200k:| Branford: | 6.3% (7,938) |
| Connecticut: | 6.3% (6,065) |
Median per capita income in Branford in 2022:| Branford: | $37,929 |
| State: | $29,353 |