De Witt, New York (NY) income map, earnings map, and wages data
The median household income in De Witt, NY in 2022 was $81,239, which was 2.1% greater than the median annual income of $79,557 across the entire state of New York. Compared to the median income of $46,759 in 2000 this represents an increase of 42.4%. The per capita income in 2022 was $54,479, which means an increase of 46.4% compared to 2000 when it was $29,198.
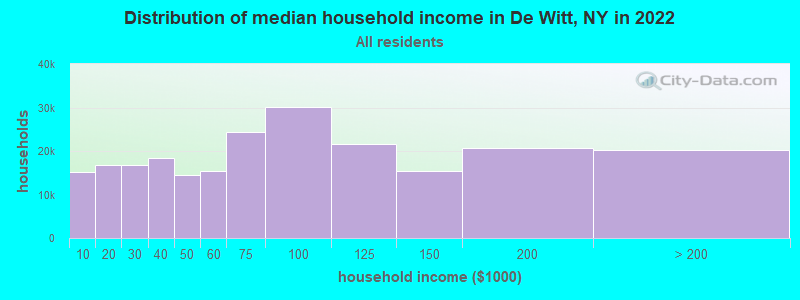
Income statistics for all residents
Median household income in De Witt, NY in 2022:| De Witt: | $81,240 |
| State: | $79,557 |
Change in median household income between 2000 and 2022:| De Witt, New York: | +73.7% |
| New York: | +83.3% |
Number of households with income < $10k:| De Witt: | 6.6% (15,170) |
| State: | 6.8% (527,598) |
Number of households with income $10k - 20k:| De Witt: | 7.3% (16,802) |
| State: | 7.4% (574,940) |
Number of households with income $20k - 30k:| De Witt: | 7.4% (16,880) |
| State: | 6.7% (517,718) |
Number of households with income $30k - 40k:| De Witt: | 8.0% (18,306) |
| State: | 6.5% (506,674) |
Number of households with income $40k - 50k:| De Witt: | 6.3% (14,407) |
| State: | 6.1% (470,439) |
Number of households with income $50k - 60k:| De Witt: | 6.7% (15,346) |
| New York: | 5.8% (454,042) |
Number of households with income $60k - 75k:| De Witt: | 10.6% (24,355) |
| State: | 8.5% (657,508) |
Number of households with income $75k - 100k:| De Witt: | 13.1% (30,087) |
| State: | 11.6% (899,824) |
Number of households with income $100k - 125k:| De Witt: | 9.4% (21,571) |
| State: | 9.3% (723,825) |
Number of households with income $125k - 150k:| De Witt: | 6.7% (15,439) |
| New York: | 7.1% (552,420) |
Number of households with income $150k - 200k:| De Witt: | 9.0% (20,665) |
| New York: | 9.4% (727,051) |
Number of households with income > $200k:| De Witt: | 8.9% (20,306) |
| State: | 15.0% (1,162,269) |
Aggregate household income in De Witt in 2022: $6,051,123,349
Median family income in De Witt in 2022:| De Witt: | $109,481 |
| State: | $99,066 |
Median non-family income in De Witt in 2022:| De Witt: | $50,596 |
| New York: | $50,181 |
Change in median non-family income between 2000 and 2022:| De Witt, New York: | +87.2% |
| New York: | +85.4% |
Median per capita income in De Witt in 2022:| De Witt: | $54,479 |
| State: | $47,421 |
Change in median per capita income between 2000 and 2022:| De Witt, New York: | +86.6% |
| State: | +102.7% |
Income statistics for White residents
Median household income in De Witt, NY in 2022:| De Witt: | $82,307 |
| State: | $89,408 |
Change in median household income between 2000 and 2022:| De Witt, New York: | +75.2% |
| State: | +85.5% |
Number of households with income < $10k:| De Witt: | 5.3% (9,081) |
| State: | 4.8% (225,550) |
Number of households with income $10k - 20k:| De Witt: | 6.3% (10,832) |
| New York: | 6.1% (289,425) |
Number of households with income $20k - 30k:| De Witt: | 6.1% (10,480) |
| State: | 5.9% (280,254) |
Number of households with income $30k - 40k:| De Witt: | 7.4% (12,662) |
| New York: | 6.1% (288,263) |
Number of households with income $40k - 50k:| De Witt: | 6.4% (11,047) |
| State: | 5.9% (278,079) |
Number of households with income $50k - 60k:| De Witt: | 6.5% (11,144) |
| New York: | 5.7% (267,554) |
Number of households with income $60k - 75k:| De Witt: | 11.1% (19,042) |
| New York: | 8.4% (398,344) |
Number of households with income $75k - 100k:| De Witt: | 13.7% (23,647) |
| New York: | 11.8% (554,841) |
Number of households with income $100k - 125k:| De Witt: | 10.0% (17,144) |
| New York: | 10.0% (469,794) |
Number of households with income $125k - 150k:| De Witt: | 7.5% (12,920) |
| State: | 7.6% (360,467) |
Number of households with income $150k - 200k:| De Witt: | 9.8% (16,877) |
| State: | 10.1% (477,078) |
Number of households with income > $200k:| De Witt: | 10.0% (17,148) |
| New York: | 17.6% (829,233) |
Aggregate household income in De Witt in 2022: $4,797,446,829
Median family income in De Witt in 2022:| De Witt: | $112,483 |
| New York: | $115,170 |
Number of families with income < $10k:| De Witt: | 1.1% (83) |
| State: | 2.5% (68,851) |
Number of families with income $10k - 20k:| De Witt: | 1.5% (109) |
| New York: | 3.0% (83,127) |
Number of families with income $20k - 30k:| De Witt: | 2.1% (154) |
| State: | 3.5% (97,578) |
Number of families with income $30k - 40k:| De Witt: | 3.5% (261) |
| State: | 4.1% (114,108) |
Number of families with income $40k - 50k:| De Witt: | 3.8% (281) |
| State: | 4.7% (130,902) |
Number of families with income $50k - 60k:| De Witt: | 2.7% (201) |
| State: | 4.9% (135,118) |
Number of families with income $60k - 75k:| De Witt: | 5.0% (375) |
| State: | 7.8% (216,254) |
Number of families with income $75k - 100k:| De Witt: | 11.7% (876) |
| State: | 12.4% (342,382) |
Number of families with income $100k - 125k:| De Witt: | 10.1% (750) |
| State: | 11.4% (314,917) |
Number of families with income $125k - 150k:| De Witt: | 12.2% (910) |
| State: | 9.4% (260,489) |
Number of families with income $150k - 200k:| De Witt: | 17.8% (1,329) |
| State: | 13.2% (365,586) |
Number of families with income > $200k:| De Witt: | 28.6% (2,136) |
| State: | 23.2% (642,319) |
Median non-family income in De Witt in 2022:| De Witt: | $54,225 |
| State: | $54,783 |
Change in median non-family income between 2000 and 2022:| De Witt, New York: | +97.8% |
| State: | +87.9% |
Median per capita income in De Witt in 2022:| De Witt: | $59,080 |
| New York: | $57,640 |
Change in median per capita income between 2000 and 2022:| De Witt, New York: | +95.4% |
| State: | +111.6% |
Income statistics for Black or African American residents
Median household income in De Witt, NY in 2022:| De Witt: | $49,083 |
| New York: | $57,898 |
Change in median household income between 2000 and 2022:| De Witt, New York: | +64.8% |
| State: | +84.6% |
Number of households with income < $10k:| De Witt: | 15.2% (4,622) |
| State: | 12.0% (128,500) |
Number of households with income $10k - 20k:| De Witt: | 11.7% (3,564) |
| State: | 10.0% (107,541) |
Number of households with income $20k - 30k:| De Witt: | 17.1% (5,201) |
| New York: | 8.4% (90,192) |
Number of households with income $30k - 40k:| De Witt: | 11.2% (3,388) |
| New York: | 7.4% (79,579) |
Number of households with income $40k - 50k:| De Witt: | 5.6% (1,701) |
| State: | 6.8% (72,491) |
Number of households with income $50k - 60k:| De Witt: | 8.4% (2,560) |
| State: | 6.7% (71,309) |
Number of households with income $60k - 75k:| De Witt: | 7.4% (2,238) |
| New York: | 8.9% (95,050) |
Number of households with income $75k - 100k:| De Witt: | 7.9% (2,402) |
| State: | 11.5% (123,569) |
Number of households with income $100k - 125k:| De Witt: | 7.7% (2,349) |
| State: | 8.1% (86,632) |
Number of households with income $125k - 150k:| De Witt: | 1.4% (423) |
| State: | 6.0% (64,788) |
Number of households with income $150k - 200k:| De Witt: | 3.7% (1,115) |
| New York: | 7.2% (76,644) |
Number of households with income > $200k:| De Witt: | 2.6% (792) |
| New York: | 7.0% (75,062) |
Aggregate household income in De Witt in 2022: $49,492,123
Median family income in De Witt in 2022:| De Witt: | $76,100 |
| State: | $72,528 |
Number of families with income < $10k:| De Witt: | 2.2% (15) |
| State: | 8.6% (54,100) |
Number of families with income $10k - 20k:| De Witt: | 3.4% (22) |
| State: | 6.6% (41,506) |
Number of families with income $20k - 30k:| De Witt: | 3.5% (23) |
| State: | 7.0% (44,139) |
Number of families with income $30k - 40k:| De Witt: | 8.7% (57) |
| State: | 6.9% (43,353) |
Number of families with income $40k - 50k:| De Witt: | 0.5% (3) |
| State: | 6.6% (41,419) |
Number of families with income $50k - 60k:| De Witt: | 7.4% (48) |
| New York: | 6.3% (39,748) |
Number of families with income $60k - 75k:| De Witt: | 2.1% (13) |
| State: | 9.2% (57,626) |
Number of families with income $75k - 100k:| De Witt: | 9.5% (62) |
| State: | 12.6% (78,986) |
Number of families with income $100k - 125k:| De Witt: | 6.5% (43) |
| State: | 9.8% (61,670) |
Number of families with income $125k - 150k:| De Witt: | 5.0% (32) |
| State: | 7.5% (47,050) |
Number of families with income $150k - 200k:| De Witt: | 43.9% (287) |
| New York: | 9.4% (59,260) |
Number of families with income > $200k:| De Witt: | 7.2% (47) |
| New York: | 9.3% (58,575) |
Median non-family income in De Witt in 2022:| De Witt: | $15,290 |
| New York: | $37,265 |
Change in median non-family income between 2000 and 2022:| De Witt, New York: | +71.2% |
| State: | +81.7% |
Median per capita income in De Witt in 2022:| De Witt: | $37,306 |
| New York: | $31,947 |
Change in median per capita income between 2000 and 2022:| De Witt, New York: | +111.1% |
| New York: | +106.1% |
Income statistics for Asian residents
Median household income in De Witt, NY in 2022:| De Witt: | $90,340 |
| State: | $89,947 |
Change in median household income between 2000 and 2022:| De Witt, New York: | +67.4% |
| State: | +98.1% |
Number of households with income < $10k:| De Witt: | 12.8% (986) |
| State: | 6.9% (42,537) |
Number of households with income $10k - 20k:| De Witt: | 9.6% (742) |
| State: | 7.3% (44,745) |
Number of households with income $20k - 30k:| De Witt: | 5.9% (458) |
| New York: | 6.2% (38,249) |
Number of households with income $30k - 40k:| De Witt: | 8.7% (671) |
| State: | 5.5% (33,993) |
Number of households with income $40k - 50k:| De Witt: | 4.3% (334) |
| New York: | 4.8% (29,795) |
Number of households with income $50k - 60k:| De Witt: | 13.8% (1,067) |
| State: | 5.2% (32,100) |
Number of households with income $60k - 75k:| De Witt: | 11.3% (873) |
| New York: | 7.3% (44,615) |
Number of households with income $75k - 100k:| De Witt: | 9.5% (729) |
| New York: | 10.8% (66,687) |
Number of households with income $100k - 125k:| De Witt: | 2.4% (187) |
| New York: | 8.2% (50,233) |
Number of households with income $125k - 150k:| De Witt: | 7.9% (608) |
| State: | 7.2% (44,299) |
Number of households with income $150k - 200k:| De Witt: | 6.8% (521) |
| State: | 10.4% (63,837) |
Number of households with income > $200k:| De Witt: | 6.9% (529) |
| State: | 20.1% (123,891) |
Aggregate household income in De Witt in 2022: $47,173,863
Median family income in De Witt in 2022:| De Witt: | $140,515 |
| State: | $98,136 |
Number of families with income < $10k:| De Witt: | 3.0% (15) |
| State: | 4.1% (18,020) |
Number of families with income $10k - 20k:| De Witt: | 1.1% (6) |
| State: | 5.2% (22,725) |
Number of families with income $20k - 30k:| De Witt: | 1.3% (7) |
| State: | 6.4% (27,990) |
Number of families with income $40k - 50k:| De Witt: | 3.8% (19) |
| State: | 5.2% (22,750) |
Number of families with income $50k - 60k:| De Witt: | 10.2% (51) |
| State: | 5.5% (24,015) |
Number of families with income $60k - 75k:| De Witt: | 1.4% (7) |
| New York: | 7.6% (33,120) |
Number of families with income $75k - 100k:| De Witt: | 8.8% (45) |
| New York: | 10.7% (46,726) |
Number of families with income $100k - 125k:| De Witt: | 17.2% (87) |
| State: | 8.6% (37,796) |
Number of families with income $125k - 150k:| De Witt: | 3.4% (17) |
| New York: | 7.3% (31,893) |
Number of families with income $150k - 200k:| De Witt: | 5.1% (26) |
| State: | 11.0% (48,177) |
Number of families with income > $200k:| De Witt: | 44.6% (226) |
| New York: | 22.2% (97,322) |
Median non-family income in De Witt in 2022:| De Witt: | $36,773 |
| New York: | $63,573 |
Change in median non-family income between 2000 and 2022:| De Witt, New York: | +104.3% |
| State: | +101.1% |
Median per capita income in De Witt in 2022:| De Witt: | $39,339 |
| State: | $46,726 |
Change in median per capita income between 2000 and 2022:| De Witt, New York: | +29.6% |
| State: | +126.6% |
Income statistics for Hispanic or Latino residents
Median household income in De Witt, NY in 2022:| De Witt: | $92,304 |
| New York: | $60,468 |
Number of households with income < $10k:| De Witt: | 7.9% (965) |
| New York: | 9.9% (127,185) |
Number of households with income $10k - 20k:| De Witt: | 13.2% (1,609) |
| State: | 10.7% (136,699) |
Number of households with income $20k - 30k:| De Witt: | 7.2% (883) |
| State: | 8.1% (102,991) |
Number of households with income $30k - 40k:| De Witt: | 12.8% (1,562) |
| New York: | 7.8% (100,149) |
Number of households with income $40k - 50k:| De Witt: | 3.9% (472) |
| State: | 6.9% (87,760) |
Number of households with income $50k - 60k:| De Witt: | 4.0% (482) |
| New York: | 6.3% (80,968) |
Number of households with income $60k - 75k:| De Witt: | 8.5% (1,030) |
| New York: | 8.7% (110,631) |
Number of households with income $75k - 100k:| De Witt: | 12.6% (1,541) |
| State: | 11.2% (142,787) |
Number of households with income $100k - 125k:| De Witt: | 9.9% (1,206) |
| State: | 8.2% (104,850) |
Number of households with income $125k - 150k:| De Witt: | 6.4% (775) |
| State: | 6.3% (80,274) |
Number of households with income $150k - 200k:| De Witt: | 6.4% (780) |
| State: | 7.4% (95,117) |
Number of households with income > $200k:| De Witt: | 7.2% (883) |
| State: | 8.6% (109,514) |
Aggregate household income in De Witt in 2022: $32,776,271
Median family income in De Witt in 2022:| De Witt: | $155,532 |
| State: | $68,770 |
Number of families with income < $10k:| De Witt: | 2.0% (7) |
| State: | 6.9% (58,565) |
Number of families with income $10k - 20k:| De Witt: | 12.7% (43) |
| State: | 7.0% (59,058) |
Number of families with income $20k - 30k:| De Witt: | 8.7% (30) |
| State: | 8.0% (68,048) |
Number of families with income $30k - 40k:| De Witt: | 7.6% (26) |
| New York: | 8.4% (70,668) |
Number of families with income $40k - 50k:| De Witt: | 1.9% (7) |
| New York: | 7.4% (62,941) |
Number of families with income $50k - 60k:| De Witt: | 4.8% (16) |
| State: | 6.6% (55,592) |
Number of families with income $60k - 75k:| De Witt: | 4.5% (15) |
| State: | 9.3% (78,564) |
Number of families with income $75k - 100k:| De Witt: | 14.5% (50) |
| State: | 12.6% (106,685) |
Number of families with income $100k - 125k:| De Witt: | 9.3% (32) |
| New York: | 9.4% (79,139) |
Number of families with income $125k - 150k:| De Witt: | 11.4% (39) |
| State: | 6.9% (58,255) |
Number of families with income $150k - 200k:| De Witt: | 7.0% (24) |
| State: | 8.3% (69,877) |
Number of families with income > $200k:| De Witt: | 15.7% (54) |
| State: | 9.3% (78,555) |
Median non-family income in De Witt in 2022:| De Witt: | $107,727 |
| State: | $34,000 |
Median per capita income in De Witt in 2022:| De Witt: | $33,810 |
| State: | $29,761 |
Change in median per capita income between 2000 and 2022:| De Witt, New York: | +138.6% |
| State: | +132.7% |
Income statistics for American Indian and Alaska Native residents
Median household income in De Witt, NY in 2022:| De Witt: | $129,968 |
| State: | $63,208 |
Change in median household income between 2000 and 2022:| De Witt, New York: | +103.9% |
| State: | +110.1% |
Number of households with income < $10k:| De Witt: | 8.6% (3,806) |
| State: | 8.6% (3,559) |
Number of households with income $10k - 20k:| De Witt: | 6.0% (2,643) |
| State: | 5.9% (2,455) |
Number of households with income $20k - 30k:| De Witt: | 8.2% (3,614) |
| State: | 8.2% (3,393) |
Number of households with income $30k - 40k:| De Witt: | 11.9% (5,262) |
| New York: | 11.9% (4,918) |
Number of households with income $40k - 50k:| De Witt: | 6.4% (2,826) |
| State: | 6.5% (2,682) |
Number of households with income $50k - 60k:| De Witt: | 6.0% (2,660) |
| State: | 6.1% (2,516) |
Number of households with income $60k - 75k:| De Witt: | 9.9% (4,372) |
| State: | 10.0% (4,125) |
Number of households with income $75k - 100k:| De Witt: | 13.4% (5,913) |
| State: | 13.3% (5,517) |
Number of households with income $100k - 125k:| De Witt: | 8.4% (3,691) |
| New York: | 8.4% (3,463) |
Number of households with income $125k - 150k:| De Witt: | 7.0% (3,104) |
| State: | 7.0% (2,887) |
Number of households with income $150k - 200k:| De Witt: | 10.0% (4,423) |
| State: | 9.9% (4,106) |
Number of households with income > $200k:| De Witt: | 4.2% (1,869) |
| State: | 4.2% (1,744) |
Aggregate household income in De Witt in 2022: $1,778,012
Median family income in De Witt in 2022:| De Witt: | $86,656 |
| State: | $69,721 |
Number of families with income $10k - 20k:| De Witt: | 1.3% (1) |
| New York: | 2.6% (761) |
Number of families with income $20k - 30k:| De Witt: | 9.4% (4) |
| State: | 6.2% (1,790) |
Number of families with income $75k - 100k:| De Witt: | 89.3% (35) |
| State: | 14.9% (4,311) |
Median non-family income in De Witt in 2022:| De Witt: | $116,772 |
| State: | $33,910 |
Change in median non-family income between 2000 and 2022:| De Witt, New York: | +83.2% |
| State: | +89.9% |
Median per capita income in De Witt in 2022:| De Witt: | $15,701 |
| New York: | $25,837 |
Change in median per capita income between 2000 and 2022:| De Witt, New York: | +67.7% |
| New York: | +99.6% |
Income statistics for Multirace residents
Median household income in De Witt, NY in 2022:| De Witt: | $137,462 |
| State: | $73,557 |
Change in median household income between 2000 and 2022:| De Witt, New York: | +141.7% |
| New York: | +123.9% |
Number of households with income < $10k:| De Witt: | 8.9% (2,151) |
| New York: | 8.9% (57,924) |
Number of households with income $10k - 20k:| De Witt: | 11.6% (2,797) |
| State: | 8.7% (56,590) |
Number of households with income $20k - 30k:| De Witt: | 7.5% (1,810) |
| New York: | 7.1% (46,287) |
Number of households with income $30k - 40k:| De Witt: | 6.9% (1,675) |
| New York: | 6.9% (45,132) |
Number of households with income $40k - 50k:| De Witt: | 6.1% (1,462) |
| State: | 5.8% (37,946) |
Number of households with income $50k - 60k:| De Witt: | 4.8% (1,164) |
| State: | 5.6% (36,410) |
Number of households with income $60k - 75k:| De Witt: | 9.6% (2,326) |
| State: | 7.8% (50,819) |
Number of households with income $75k - 100k:| De Witt: | 13.0% (3,142) |
| New York: | 11.7% (76,024) |
Number of households with income $100k - 125k:| De Witt: | 9.6% (2,311) |
| New York: | 9.3% (60,635) |
Number of households with income $125k - 150k:| De Witt: | 5.4% (1,309) |
| State: | 6.2% (40,533) |
Number of households with income $150k - 200k:| De Witt: | 9.7% (2,338) |
| State: | 8.6% (56,409) |
Number of households with income > $200k:| De Witt: | 6.8% (1,631) |
| State: | 13.4% (87,442) |
Aggregate household income in De Witt in 2022: $42,230,989
Median family income in De Witt in 2022:| De Witt: | $137,925 |
| New York: | $85,788 |
Number of families with income < $10k:| De Witt: | 2.5% (8) |
| State: | 6.2% (24,976) |
Number of families with income $10k - 20k:| De Witt: | 7.1% (24) |
| New York: | 5.6% (22,512) |
Number of families with income $20k - 30k:| De Witt: | 2.6% (9) |
| State: | 6.6% (26,534) |
Number of families with income $50k - 60k:| De Witt: | 5.2% (18) |
| State: | 5.5% (22,002) |
Number of families with income $60k - 75k:| De Witt: | 7.8% (26) |
| State: | 7.6% (30,653) |
Number of families with income $75k - 100k:| De Witt: | 31.7% (108) |
| State: | 12.9% (51,995) |
Number of families with income $100k - 125k:| De Witt: | 16.6% (57) |
| State: | 10.7% (43,036) |
Number of families with income $150k - 200k:| De Witt: | 26.6% (91) |
| New York: | 9.4% (37,771) |
Median non-family income in De Witt in 2022:| De Witt: | $102,380 |
| State: | $46,403 |
Median per capita income in De Witt in 2022:| De Witt: | $32,728 |
| State: | $36,931 |
Income statistics for other residents
Number of households with income < $10k:| De Witt: | 10.5% (51) |
| State: | 10.3% (69,252) |
Number of households with income $10k - 20k:| De Witt: | 10.3% (50) |
| New York: | 11.0% (73,890) |
Number of households with income $20k - 30k:| De Witt: | 7.8% (38) |
| New York: | 8.8% (59,096) |
Number of households with income $30k - 40k:| De Witt: | 7.4% (36) |
| New York: | 8.1% (54,418) |
Number of households with income $40k - 50k:| De Witt: | 7.4% (36) |
| State: | 7.3% (49,042) |
Number of households with income $50k - 60k:| De Witt: | 5.6% (27) |
| New York: | 6.5% (43,945) |
Number of households with income $60k - 75k:| De Witt: | 9.3% (45) |
| State: | 9.5% (64,087) |
Number of households with income $75k - 100k:| De Witt: | 11.3% (55) |
| State: | 10.9% (73,094) |
Number of households with income $100k - 125k:| De Witt: | 8.8% (43) |
| State: | 7.9% (53,055) |
Number of households with income $125k - 150k:| De Witt: | 5.3% (26) |
| State: | 5.9% (39,446) |
Number of households with income $150k - 200k:| De Witt: | 9.1% (44) |
| New York: | 7.2% (48,653) |
Number of households with income > $200k:| De Witt: | 7.2% (35) |
| New York: | 6.6% (44,703) |
Aggregate household income in De Witt in 2022: $13,687,468
Median family income in De Witt in 2022:| De Witt: | $308,072 |
| State: | $63,465 |
Number of families with income $40k - 50k:| De Witt: | 3.5% (10) |
| State: | 7.8% (36,771) |
Number of families with income $75k - 100k:| De Witt: | 10.4% (30) |
| State: | 12.5% (58,659) |
Number of families with income $150k - 200k:| De Witt: | 86.2% (248) |
| New York: | 7.9% (37,167) |
Median non-family income in De Witt in 2022:| De Witt: | $28,808 |
| State: | $26,983 |
Change in median non-family income between 2000 and 2022:| De Witt, New York: | +77.3% |
| State: | +66.4% |
Median per capita income in De Witt in 2022:| De Witt: | $88,356 |
| State: | $26,975 |