East Shasta, California (CA) income map, earnings map, and wages data
The median household income in East Shasta, CA in 2022 was $63,028, which was 45.3% less than the median annual income of $91,551 across the entire state of California. Compared to the median income of $31,696 in 2000 this represents an increase of 49.7%. The per capita income in 2022 was $33,283, which means an increase of 49.7% compared to 2000 when it was $16,730.
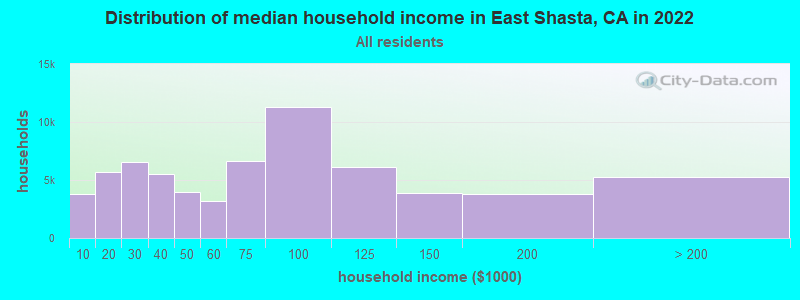
Income statistics for all residents
Median household income in East Shasta, CA in 2022:| East Shasta: | $63,028 |
| State: | $91,551 |
Change in median household income between 2000 and 2022:| East Shasta, California: | +98.9% |
| State: | +92.8% |
Number of households with income < $10k:| East Shasta: | 5.7% (3,779) |
| California: | 4.8% (654,370) |
Number of households with income $10k - 20k:| East Shasta: | 8.7% (5,714) |
| State: | 5.8% (789,493) |
Number of households with income $20k - 30k:| East Shasta: | 10.0% (6,549) |
| State: | 5.7% (778,318) |
Number of households with income $30k - 40k:| East Shasta: | 8.3% (5,483) |
| California: | 5.8% (783,170) |
Number of households with income $40k - 50k:| East Shasta: | 6.1% (3,983) |
| State: | 5.8% (781,352) |
Number of households with income $50k - 60k:| East Shasta: | 4.9% (3,207) |
| California: | 5.6% (760,175) |
Number of households with income $60k - 75k:| East Shasta: | 10.2% (6,680) |
| State: | 8.2% (1,104,699) |
Number of households with income $75k - 100k:| East Shasta: | 17.2% (11,308) |
| State: | 12.0% (1,627,633) |
Number of households with income $100k - 125k:| East Shasta: | 9.3% (6,139) |
| State: | 10.0% (1,358,619) |
Number of households with income $125k - 150k:| East Shasta: | 6.0% (3,921) |
| State: | 7.6% (1,027,455) |
Number of households with income $150k - 200k:| East Shasta: | 5.7% (3,760) |
| California: | 10.6% (1,439,811) |
Number of households with income > $200k:| East Shasta: | 7.9% (5,216) |
| State: | 18.0% (2,445,491) |
Aggregate household income in East Shasta in 2022: $383,962,057
Median family income in East Shasta in 2022:| East Shasta: | $77,376 |
| State: | $104,823 |
Median non-family income in East Shasta in 2022:| East Shasta: | $29,352 |
| California: | $59,348 |
Change in median non-family income between 2000 and 2022:| East Shasta, California: | +88.5% |
| State: | +85.3% |
Median per capita income in East Shasta in 2022:| East Shasta: | $33,284 |
| California: | $46,661 |
Change in median per capita income between 2000 and 2022:| East Shasta, California: | +98.9% |
| California: | +105.5% |
Income statistics for White residents
Median household income in East Shasta, CA in 2022:| East Shasta: | $65,425 |
| California: | $100,917 |
Change in median household income between 2000 and 2022:| East Shasta, California: | +101.7% |
| State: | +96.8% |
Number of households with income < $10k:| East Shasta: | 5.1% (2,773) |
| State: | 4.4% (284,109) |
Number of households with income $10k - 20k:| East Shasta: | 8.3% (4,566) |
| California: | 5.3% (340,330) |
Number of households with income $20k - 30k:| East Shasta: | 10.7% (5,846) |
| State: | 5.3% (343,145) |
Number of households with income $30k - 40k:| East Shasta: | 7.7% (4,221) |
| State: | 5.1% (330,146) |
Number of households with income $40k - 50k:| East Shasta: | 6.1% (3,338) |
| California: | 5.2% (335,310) |
Number of households with income $50k - 60k:| East Shasta: | 4.8% (2,639) |
| State: | 5.1% (326,299) |
Number of households with income $60k - 75k:| East Shasta: | 9.9% (5,441) |
| California: | 7.6% (487,640) |
Number of households with income $75k - 100k:| East Shasta: | 17.4% (9,538) |
| California: | 11.5% (736,578) |
Number of households with income $100k - 125k:| East Shasta: | 9.9% (5,429) |
| California: | 10.1% (648,782) |
Number of households with income $125k - 150k:| East Shasta: | 5.9% (3,254) |
| State: | 7.8% (499,671) |
Number of households with income $150k - 200k:| East Shasta: | 5.6% (3,040) |
| State: | 11.4% (729,603) |
Number of households with income > $200k:| East Shasta: | 8.5% (4,672) |
| State: | 21.2% (1,364,246) |
Aggregate household income in East Shasta in 2022: $307,835,538
Median family income in East Shasta in 2022:| East Shasta: | $80,513 |
| State: | $125,379 |
Number of families with income < $10k:| East Shasta: | 2.5% (40) |
| State: | 2.2% (87,079) |
Number of families with income $10k - 20k:| East Shasta: | 3.9% (62) |
| California: | 2.5% (97,716) |
Number of families with income $20k - 30k:| East Shasta: | 7.8% (125) |
| California: | 3.5% (137,295) |
Number of families with income $30k - 40k:| East Shasta: | 10.1% (163) |
| State: | 3.9% (152,947) |
Number of families with income $40k - 50k:| East Shasta: | 7.7% (123) |
| State: | 4.3% (169,197) |
Number of families with income $50k - 60k:| East Shasta: | 3.2% (51) |
| California: | 4.5% (176,192) |
Number of families with income $60k - 75k:| East Shasta: | 9.2% (149) |
| California: | 7.0% (274,752) |
Number of families with income $75k - 100k:| East Shasta: | 27.0% (435) |
| State: | 11.3% (445,632) |
Number of families with income $100k - 125k:| East Shasta: | 8.4% (135) |
| State: | 10.7% (423,630) |
Number of families with income $125k - 150k:| East Shasta: | 2.8% (45) |
| State: | 9.1% (357,408) |
Number of families with income $150k - 200k:| East Shasta: | 7.9% (127) |
| California: | 13.5% (532,693) |
Number of families with income > $200k:| East Shasta: | 9.5% (152) |
| State: | 27.6% (1,086,948) |
Median non-family income in East Shasta in 2022:| East Shasta: | $29,889 |
| State: | $62,819 |
Change in median non-family income between 2000 and 2022:| East Shasta, California: | +89.2% |
| State: | +84.4% |
Median per capita income in East Shasta in 2022:| East Shasta: | $37,288 |
| State: | $61,706 |
Change in median per capita income between 2000 and 2022:| East Shasta, California: | +108.7% |
| California: | +122.7% |
Income statistics for Black or African American residents
Number of households with income < $10k:| East Shasta: | 9.0% (1,007) |
| State: | 9.0% (73,219) |
Number of households with income $10k - 20k:| East Shasta: | 10.6% (1,192) |
| State: | 10.6% (86,666) |
Number of households with income $20k - 30k:| East Shasta: | 7.1% (794) |
| California: | 7.1% (57,719) |
Number of households with income $30k - 40k:| East Shasta: | 7.2% (808) |
| State: | 7.2% (58,714) |
Number of households with income $40k - 50k:| East Shasta: | 7.1% (799) |
| State: | 7.1% (58,075) |
Number of households with income $50k - 60k:| East Shasta: | 6.8% (760) |
| State: | 6.8% (55,229) |
Number of households with income $60k - 75k:| East Shasta: | 8.8% (989) |
| State: | 8.8% (71,895) |
Number of households with income $75k - 100k:| East Shasta: | 11.9% (1,333) |
| State: | 11.9% (96,893) |
Number of households with income $100k - 125k:| East Shasta: | 8.7% (973) |
| State: | 8.7% (70,729) |
Number of households with income $125k - 150k:| East Shasta: | 6.3% (704) |
| State: | 6.3% (51,211) |
Number of households with income $150k - 200k:| East Shasta: | 7.2% (807) |
| State: | 7.2% (58,687) |
Number of households with income > $200k:| East Shasta: | 9.3% (1,038) |
| State: | 9.3% (75,487) |
Median per capita income in East Shasta in 2022:| East Shasta: | $589 |
| State: | $36,708 |
Income statistics for Hispanic or Latino residents
Median household income in East Shasta, CA in 2022:| East Shasta: | $43,027 |
| State: | $75,698 |
Change in median household income between 2000 and 2022:| East Shasta, California: | +83.6% |
| State: | +107.2% |
Number of households with income < $10k:| East Shasta: | 11.6% (681) |
| State: | 4.3% (183,294) |
Number of households with income $10k - 20k:| East Shasta: | 7.9% (460) |
| State: | 6.0% (253,903) |
Number of households with income $20k - 30k:| East Shasta: | 7.2% (418) |
| California: | 6.8% (286,386) |
Number of households with income $30k - 40k:| East Shasta: | 8.0% (467) |
| State: | 7.4% (313,728) |
Number of households with income $40k - 50k:| East Shasta: | 12.4% (724) |
| State: | 7.4% (313,199) |
Number of households with income $50k - 60k:| East Shasta: | 5.2% (306) |
| California: | 7.2% (305,366) |
Number of households with income $60k - 75k:| East Shasta: | 14.4% (840) |
| California: | 10.3% (434,937) |
Number of households with income $75k - 100k:| East Shasta: | 10.5% (613) |
| State: | 14.4% (607,302) |
Number of households with income $100k - 125k:| East Shasta: | 4.6% (269) |
| State: | 10.6% (447,424) |
Number of households with income $125k - 150k:| East Shasta: | 6.1% (355) |
| State: | 7.5% (316,022) |
Number of households with income $150k - 200k:| East Shasta: | 6.0% (349) |
| State: | 9.2% (386,269) |
Number of households with income > $200k:| East Shasta: | 6.2% (364) |
| State: | 8.8% (372,651) |
Aggregate household income in East Shasta in 2022: $37,252,941
Median family income in East Shasta in 2022:| East Shasta: | $49,940 |
| California: | $77,589 |
Number of families with income < $10k:| East Shasta: | 10.7% (112) |
| State: | 3.9% (129,468) |
Number of families with income $10k - 20k:| East Shasta: | 6.6% (70) |
| California: | 4.6% (151,997) |
Number of families with income $20k - 30k:| East Shasta: | 16.0% (168) |
| State: | 6.6% (216,764) |
Number of families with income $30k - 40k:| East Shasta: | 16.1% (170) |
| California: | 7.6% (249,849) |
Number of families with income $40k - 50k:| East Shasta: | 13.4% (141) |
| State: | 7.7% (254,822) |
Number of families with income $50k - 60k:| East Shasta: | 7.7% (81) |
| State: | 7.4% (244,815) |
Number of families with income $60k - 75k:| East Shasta: | 8.4% (88) |
| State: | 10.5% (345,838) |
Number of families with income $75k - 100k:| East Shasta: | 10.8% (114) |
| State: | 14.9% (491,589) |
Number of families with income $100k - 125k:| East Shasta: | 4.2% (44) |
| State: | 10.7% (355,400) |
Number of families with income $125k - 150k:| East Shasta: | 0.9% (9) |
| State: | 7.8% (259,317) |
Number of families with income $150k - 200k:| East Shasta: | 3.2% (34) |
| State: | 9.3% (306,566) |
Number of families with income > $200k:| East Shasta: | 2.1% (22) |
| State: | 9.1% (299,984) |
Median non-family income in East Shasta in 2022:| East Shasta: | $82,073 |
| State: | $49,746 |
Change in median non-family income between 2000 and 2022:| East Shasta, California: | +41.4% |
| State: | +100.7% |
Median per capita income in East Shasta in 2022:| East Shasta: | $21,216 |
| State: | $27,240 |
Change in median per capita income between 2000 and 2022:| East Shasta, California: | +118.6% |
| State: | +133.3% |
Income statistics for American Indian and Alaska Native residents
Median household income in East Shasta, CA in 2022:| East Shasta: | $23,966 |
| California: | $76,752 |
Change in median household income between 2000 and 2022:| East Shasta, California: | +113.8% |
| State: | +110.0% |
Number of households with income < $10k:| East Shasta: | 5.4% (1,293) |
| California: | 5.4% (8,471) |
Number of households with income $10k - 20k:| East Shasta: | 6.0% (1,426) |
| State: | 6.0% (9,381) |
Number of households with income $20k - 30k:| East Shasta: | 5.6% (1,341) |
| California: | 5.5% (8,668) |
Number of households with income $30k - 40k:| East Shasta: | 8.2% (1,967) |
| State: | 8.3% (13,030) |
Number of households with income $40k - 50k:| East Shasta: | 7.0% (1,664) |
| State: | 6.9% (10,908) |
Number of households with income $50k - 60k:| East Shasta: | 7.1% (1,701) |
| State: | 7.1% (11,198) |
Number of households with income $60k - 75k:| East Shasta: | 9.6% (2,297) |
| California: | 9.6% (15,190) |
Number of households with income $75k - 100k:| East Shasta: | 14.0% (3,356) |
| State: | 14.1% (22,274) |
Number of households with income $100k - 125k:| East Shasta: | 11.3% (2,696) |
| State: | 11.2% (17,643) |
Number of households with income $125k - 150k:| East Shasta: | 8.3% (1,975) |
| State: | 8.3% (13,117) |
Number of households with income $150k - 200k:| East Shasta: | 8.8% (2,099) |
| California: | 8.8% (13,853) |
Number of households with income > $200k:| East Shasta: | 8.8% (2,108) |
| California: | 8.8% (13,925) |
Aggregate household income in East Shasta in 2022: $3,218,812
Median family income in East Shasta in 2022:| East Shasta: | $24,830 |
| State: | $81,108 |
Number of families with income < $10k:| East Shasta: | 40.0% (21) |
| State: | 5.0% (5,711) |
Number of families with income $10k - 20k:| East Shasta: | 10.4% (6) |
| State: | 3.7% (4,148) |
Number of families with income $20k - 30k:| East Shasta: | 10.2% (5) |
| State: | 4.3% (4,876) |
Number of families with income $40k - 50k:| East Shasta: | 18.9% (10) |
| State: | 7.8% (8,776) |
Number of families with income $50k - 60k:| East Shasta: | 20.4% (11) |
| State: | 6.9% (7,834) |
Median non-family income in East Shasta in 2022:| East Shasta: | $8,334 |
| State: | $51,296 |
Median per capita income in East Shasta in 2022:| East Shasta: | $22,626 |
| State: | $30,289 |
Income statistics for Multirace residents
Median household income in East Shasta, CA in 2022:| East Shasta: | $60,289 |
| California: | $83,153 |
Number of households with income < $10k:| East Shasta: | 6.9% (545) |
| State: | 4.2% (85,299) |
Number of households with income $10k - 20k:| East Shasta: | 9.5% (746) |
| State: | 6.1% (122,966) |
Number of households with income $20k - 30k:| East Shasta: | 7.1% (559) |
| State: | 6.4% (129,328) |
Number of households with income $30k - 40k:| East Shasta: | 12.5% (979) |
| State: | 6.4% (130,070) |
Number of households with income $40k - 50k:| East Shasta: | 6.2% (487) |
| California: | 6.5% (131,254) |
Number of households with income $50k - 60k:| East Shasta: | 3.8% (295) |
| State: | 6.5% (132,382) |
Number of households with income $60k - 75k:| East Shasta: | 12.8% (1,008) |
| State: | 9.4% (191,472) |
Number of households with income $75k - 100k:| East Shasta: | 16.3% (1,276) |
| California: | 13.3% (269,691) |
Number of households with income $100k - 125k:| East Shasta: | 7.1% (555) |
| State: | 10.2% (207,286) |
Number of households with income $125k - 150k:| East Shasta: | 6.6% (521) |
| California: | 7.8% (158,259) |
Number of households with income $150k - 200k:| East Shasta: | 7.1% (561) |
| California: | 10.3% (209,227) |
Number of households with income > $200k:| East Shasta: | 4.1% (319) |
| State: | 13.0% (263,210) |
Aggregate household income in East Shasta in 2022: $14,731,255
Median family income in East Shasta in 2022:| East Shasta: | $63,208 |
| State: | $87,642 |
Number of families with income < $10k:| East Shasta: | 22.2% (19) |
| State: | 3.2% (48,017) |
Number of families with income $20k - 30k:| East Shasta: | 47.3% (41) |
| State: | 6.1% (89,742) |
Number of families with income $40k - 50k:| East Shasta: | 30.5% (27) |
| State: | 6.8% (100,085) |
Median non-family income in East Shasta in 2022:| East Shasta: | $46,831 |
| California: | $56,558 |
Change in median non-family income between 2000 and 2022:| East Shasta, California: | +98.9% |
| State: | +100.2% |
Median per capita income in East Shasta in 2022:| East Shasta: | $17,709 |
| State: | $32,124 |
Change in median per capita income between 2000 and 2022:| East Shasta, California: | +94.3% |
| California: | +120.4% |
Income statistics for other residents
Number of households with income < $10k:| East Shasta: | 4.6% (86) |
| State: | 4.6% (93,035) |
Number of households with income $10k - 20k:| East Shasta: | 6.3% (117) |
| California: | 6.3% (126,222) |
Number of households with income $20k - 30k:| East Shasta: | 7.1% (131) |
| California: | 7.1% (142,656) |
Number of households with income $30k - 40k:| East Shasta: | 8.2% (152) |
| California: | 8.2% (165,018) |
Number of households with income $40k - 50k:| East Shasta: | 8.0% (149) |
| State: | 8.0% (161,732) |
Number of households with income $50k - 60k:| East Shasta: | 7.6% (141) |
| State: | 7.6% (152,152) |
Number of households with income $60k - 75k:| East Shasta: | 10.5% (194) |
| California: | 10.4% (209,951) |
Number of households with income $75k - 100k:| East Shasta: | 14.7% (273) |
| State: | 14.7% (296,102) |
Number of households with income $100k - 125k:| East Shasta: | 10.7% (198) |
| State: | 10.7% (214,281) |
Number of households with income $125k - 150k:| East Shasta: | 7.1% (132) |
| California: | 7.1% (143,092) |
Number of households with income $150k - 200k:| East Shasta: | 8.6% (159) |
| State: | 8.6% (172,215) |
Number of households with income > $200k:| East Shasta: | 6.7% (124) |
| State: | 6.7% (134,102) |
Aggregate household income in East Shasta in 2022: $9,394,842
Median family income in East Shasta in 2022:| East Shasta: | $65,673 |
| State: | $72,756 |
Number of families with income < $10k:| East Shasta: | 6.4% (9) |
| State: | 4.3% (69,090) |
Number of families with income $10k - 20k:| East Shasta: | 12.7% (17) |
| State: | 5.1% (82,116) |
Number of families with income $20k - 30k:| East Shasta: | 3.4% (5) |
| State: | 7.0% (112,854) |
Number of families with income $30k - 40k:| East Shasta: | 9.6% (13) |
| State: | 8.4% (135,938) |
Number of families with income $40k - 50k:| East Shasta: | 7.8% (10) |
| State: | 8.4% (135,353) |
Number of families with income $50k - 60k:| East Shasta: | 16.4% (22) |
| California: | 7.7% (124,826) |
Number of families with income $100k - 125k:| East Shasta: | 43.6% (58) |
| California: | 10.9% (176,716) |
Median per capita income in East Shasta in 2022:| East Shasta: | $15,658 |
| State: | $25,164 |
Change in median per capita income between 2000 and 2022:| East Shasta, California: | +59.6% |
| State: | +137.9% |