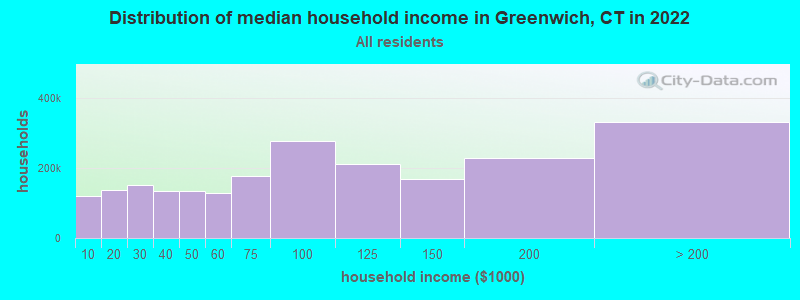
The median household income in Greenwich, CT in 2022 was $167,667, which was 47.3% greater than the median annual income of $88,429 across the entire state of Connecticut. Compared to the median income of $99,086 in 2000 this represents an increase of 40.9%. The per capita income in 2022 was $136,000, which means an increase of 45.3% compared to 2000 when it was $74,346.
Income statistics for all residents
Median household income in Greenwich, CT in 2022:
Greenwich:
$167,667
State:
$88,429
Change in median household income between 2000 and 2022:
Greenwich, Connecticut:
+69.2%
Connecticut:
+64.0%
Number of households with income < $10k:
Greenwich:
5.2% (68,294)
State:
5.1% (72,746)
Number of households with income $10k - 20k:
Greenwich:
5.8% (77,012)
State:
5.7% (81,643)
Number of households with income $20k - 30k:
Greenwich:
6.6% (87,170)
Connecticut:
6.5% (92,844)
Number of households with income $30k - 40k:
Greenwich:
5.9% (78,229)
State:
5.9% (83,934)
Number of households with income $40k - 50k:
Greenwich:
5.9% (77,728)
Connecticut:
5.8% (83,025)
Number of households with income $50k - 60k:
Greenwich:
5.8% (76,217)
State:
5.7% (81,788)
Number of households with income $60k - 75k:
Greenwich:
8.1% (106,789)
State:
8.1% (115,651)
Number of households with income $75k - 100k:
Greenwich:
12.6% (166,781)
State:
12.6% (180,173)
Number of households with income $100k - 125k:
Greenwich:
9.8% (129,837)
State:
9.9% (141,231)
Number of households with income $125k - 150k:
Greenwich:
7.8% (103,688)
State:
7.9% (112,826)
Number of households with income $150k - 200k:
Greenwich:
10.7% (141,836)
State:
10.8% (154,641)
Number of households with income > $200k:
Greenwich:
16.0% (211,894)
Connecticut:
16.3% (233,133)
Aggregate household income in Greenwich in 2022: $91,867,090,950
Median family income in Greenwich in 2022:
Greenwich:
$219,175
State:
$115,183
Median non-family income in Greenwich in 2022:
Greenwich:
$95,103
State:
$50,964
Change in median non-family income between 2000 and 2022:
Greenwich, Connecticut:
+71.5%
State:
+65.1%
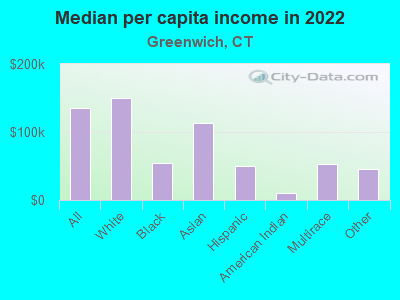
Median per capita income in Greenwich in 2022:
Greenwich:
$136,001
State:
$51,581
Change in median per capita income between 2000 and 2022:
Greenwich, Connecticut:
+82.9%
State:
+79.3%
Income statistics for White residents
Median household income in Greenwich, CT in 2022:
Greenwich:
$173,195
State:
$96,890
Change in median household income between 2000 and 2022:
Greenwich, Connecticut:
+69.4%
Connecticut:
+68.5%
Number of households with income < $10k:
Greenwich:
4.2% (37,881)
Connecticut:
4.2% (42,265)
Number of households with income $10k - 20k:
Greenwich:
4.9% (43,553)
State:
4.8% (48,323)
Number of households with income $20k - 30k:
Greenwich:
5.8% (51,795)
Connecticut:
5.7% (57,716)
Number of households with income $30k - 40k:
Greenwich:
5.4% (47,944)
State:
5.3% (53,827)
Number of households with income $40k - 50k:
Greenwich:
5.3% (47,745)
State:
5.3% (53,301)
Number of households with income $50k - 60k:
Greenwich:
5.6% (49,688)
State:
5.5% (55,690)
Number of households with income $60k - 75k:
Greenwich:
7.9% (71,008)
State:
8.0% (80,329)
Number of households with income $75k - 100k:
Greenwich:
12.7% (113,781)
State:
12.7% (128,070)
Number of households with income $100k - 125k:
Greenwich:
10.0% (89,345)
Connecticut:
10.0% (101,210)
Number of households with income $125k - 150k:
Greenwich:
8.0% (71,729)
State:
8.0% (81,250)
Number of households with income $150k - 200k:
Greenwich:
11.8% (105,470)
State:
11.8% (119,527)
Number of households with income > $200k:
Greenwich:
18.4% (165,109)
State:
18.6% (187,875)
Aggregate household income in Greenwich in 2022: $69,990,085,350
Median family income in Greenwich in 2022:
Greenwich:
$235,573
State:
$128,955
Number of families with income < $10k:
Greenwich:
0.9% (250)
State:
1.9% (11,537)
Number of families with income $10k - 20k:
Greenwich:
0.5% (150)
State:
1.8% (11,289)
Number of families with income $20k - 30k:
Greenwich:
0.6% (180)
State:
3.0% (18,506)
Number of families with income $30k - 40k:
Greenwich:
0.8% (244)
Connecticut:
2.9% (18,160)
Number of families with income $40k - 50k:
Greenwich:
1.0% (284)
State:
3.9% (24,550)
Number of families with income $50k - 60k:
Greenwich:
1.1% (316)
State:
4.3% (26,723)
Number of families with income $60k - 75k:
Greenwich:
1.7% (501)
State:
7.1% (44,075)
Number of families with income $75k - 100k:
Greenwich:
3.3% (939)
State:
12.5% (77,679)
Number of families with income $100k - 125k:
Greenwich:
4.2% (1,222)
State:
11.1% (69,086)
Number of families with income $125k - 150k:
Greenwich:
5.2% (1,510)
State:
9.6% (59,616)
Number of families with income $150k - 200k:
Greenwich:
11.0% (3,176)
Connecticut:
15.7% (97,890)
Number of families with income > $200k:
Greenwich:
69.6% (20,076)
State:
26.3% (163,417)
Median non-family income in Greenwich in 2022:
Greenwich:
$97,808
State:
$54,067
Change in median non-family income between 2000 and 2022:
Greenwich, Connecticut:
+73.7%
State:
+68.7%
Median per capita income in Greenwich in 2022:
Greenwich:
$150,412
State:
$59,916
Change in median per capita income between 2000 and 2022:
Greenwich, Connecticut:
+92.1%
State:
+90.2%
Income statistics for Black or African American residents
Median household income in Greenwich, CT in 2022:
Greenwich:
$51,980
Connecticut:
$61,803
Change in median household income between 2000 and 2022:
Greenwich, Connecticut:
+60.9%
State:
+76.1%
Number of households with income < $10k:
Greenwich:
6.8% (8,737)
Connecticut:
6.8% (9,494)
Number of households with income $10k - 20k:
Greenwich:
7.9% (10,125)
Connecticut:
7.9% (11,003)
Number of households with income $20k - 30k:
Greenwich:
10.8% (13,845)
State:
10.8% (15,045)
Number of households with income $30k - 40k:
Greenwich:
8.2% (10,583)
Connecticut:
8.2% (11,501)
Number of households with income $40k - 50k:
Greenwich:
7.4% (9,586)
State:
7.4% (10,416)
Number of households with income $50k - 60k:
Greenwich:
7.5% (9,694)
State:
7.5% (10,534)
Number of households with income $60k - 75k:
Greenwich:
8.0% (10,347)
State:
8.0% (11,244)
Number of households with income $75k - 100k:
Greenwich:
9.6% (12,304)
State:
9.6% (13,370)
Number of households with income $100k - 125k:
Greenwich:
10.2% (13,108)
State:
10.2% (14,244)
Number of households with income $125k - 150k:
Greenwich:
8.0% (10,349)
State:
8.0% (11,246)
Number of households with income $150k - 200k:
Greenwich:
7.7% (9,871)
State:
7.7% (10,727)
Number of households with income > $200k:
Greenwich:
7.9% (10,202)
State:
7.9% (11,086)
Aggregate household income in Greenwich in 2022: $138,235,895
Median family income in Greenwich in 2022:
Greenwich:
$84,435
State:
$87,228
Number of families with income < $10k:
Greenwich:
2.8% (14)
Connecticut:
3.8% (3,184)
Number of families with income $10k - 20k:
Greenwich:
0.6% (3)
State:
4.8% (4,026)
Number of families with income $20k - 30k:
Greenwich:
3.1% (15)
State:
6.0% (5,015)
Number of families with income $30k - 40k:
Greenwich:
9.3% (47)
State:
7.7% (6,445)
Number of families with income $40k - 50k:
Greenwich:
6.3% (31)
State:
6.6% (5,531)
Number of families with income $50k - 60k:
Greenwich:
0.6% (3)
State:
5.4% (4,480)
Number of families with income $60k - 75k:
Greenwich:
1.7% (9)
State:
8.2% (6,861)
Number of families with income $75k - 100k:
Greenwich:
4.8% (24)
State:
12.7% (10,598)
Number of families with income $125k - 150k:
Greenwich:
30.1% (151)
State:
11.2% (9,356)
Number of families with income > $200k:
Greenwich:
40.7% (204)
State:
10.8% (9,057)
Median non-family income in Greenwich in 2022:
Greenwich:
$44,983
State:
$38,608
Change in median non-family income between 2000 and 2022:
Greenwich, Connecticut:
+77.0%
State:
+77.0%
Median per capita income in Greenwich in 2022:
Greenwich:
$55,042
State:
$36,289
Change in median per capita income between 2000 and 2022:
Greenwich, Connecticut:
+115.2%
State:
+117.5%
Income statistics for Asian residents
Median household income in Greenwich, CT in 2022:
Greenwich:
$226,302
State:
$110,568
Change in median household income between 2000 and 2022:
Greenwich, Connecticut:
+110.1%
Connecticut:
+79.5%
Number of households with income < $10k:
Greenwich:
7.1% (7,425)
State:
7.1% (4,245)
Number of households with income $10k - 20k:
Greenwich:
3.5% (3,650)
State:
3.5% (2,087)
Number of households with income $20k - 30k:
Greenwich:
4.1% (4,310)
State:
4.1% (2,464)
Number of households with income $30k - 40k:
Greenwich:
4.1% (4,334)
State:
4.1% (2,478)
Number of households with income $40k - 50k:
Greenwich:
3.3% (3,469)
State:
3.3% (1,983)
Number of households with income $50k - 60k:
Greenwich:
3.9% (4,072)
State:
3.9% (2,328)
Number of households with income $60k - 75k:
Greenwich:
7.0% (7,395)
State:
7.0% (4,228)
Number of households with income $75k - 100k:
Greenwich:
11.5% (12,088)
State:
11.5% (6,911)
Number of households with income $100k - 125k:
Greenwich:
10.2% (10,716)
State:
10.2% (6,127)
Number of households with income $125k - 150k:
Greenwich:
8.5% (8,883)
Connecticut:
8.5% (5,079)
Number of households with income $150k - 200k:
Greenwich:
12.4% (13,002)
State:
12.4% (7,434)
Number of households with income > $200k:
Greenwich:
24.4% (25,643)
State:
24.4% (14,661)
Aggregate household income in Greenwich in 2022: $889,201,895
Median family income in Greenwich in 2022:
Greenwich:
$225,450
State:
$134,548
Number of families with income < $10k:
Greenwich:
2.3% (75)
Connecticut:
4.3% (1,875)
Number of families with income $10k - 20k:
Greenwich:
0.5% (17)
State:
1.6% (700)
Number of families with income $20k - 30k:
Greenwich:
1.0% (34)
State:
3.8% (1,682)
Number of families with income $30k - 40k:
Greenwich:
0.6% (21)
State:
3.8% (1,652)
Number of families with income $40k - 50k:
Greenwich:
0.7% (23)
Connecticut:
2.0% (863)
Number of families with income $50k - 60k:
Greenwich:
1.3% (43)
State:
3.7% (1,635)
Number of families with income $60k - 75k:
Greenwich:
2.0% (65)
Connecticut:
6.0% (2,651)
Number of families with income $75k - 100k:
Greenwich:
7.5% (250)
State:
11.0% (4,844)
Number of families with income $100k - 125k:
Greenwich:
7.1% (235)
State:
10.5% (4,621)
Number of families with income $125k - 150k:
Greenwich:
4.8% (158)
State:
8.2% (3,588)
Number of families with income $150k - 200k:
Greenwich:
14.8% (492)
State:
14.2% (6,237)
Number of families with income > $200k:
Greenwich:
57.4% (1,905)
Connecticut:
30.8% (13,522)
Median non-family income in Greenwich in 2022:
Greenwich:
$222,769
State:
$63,785
Change in median non-family income between 2000 and 2022:
Greenwich, Connecticut:
+148.6%
State:
+77.9%
Median per capita income in Greenwich in 2022:
Greenwich:
$112,850
Connecticut:
$55,295
Change in median per capita income between 2000 and 2022:
Greenwich, Connecticut:
+103.6%
Connecticut:
+97.8%
Income statistics for Hispanic or Latino residents
Median household income in Greenwich, CT in 2022:
Greenwich:
$82,149
Connecticut:
$60,275
Change in median household income between 2000 and 2022:
Greenwich, Connecticut:
+67.8%
State:
+87.9%
Number of households with income < $10k:
Greenwich:
8.7% (28,366)
State:
8.7% (18,584)
Number of households with income $10k - 20k:
Greenwich:
9.1% (29,359)
Connecticut:
9.1% (19,235)
Number of households with income $20k - 30k:
Greenwich:
8.9% (28,984)
State:
8.9% (18,989)
Number of households with income $30k - 40k:
Greenwich:
7.5% (24,371)
Connecticut:
7.5% (15,967)
Number of households with income $40k - 50k:
Greenwich:
8.7% (28,186)
State:
8.7% (18,466)
Number of households with income $50k - 60k:
Greenwich:
6.9% (22,447)
Connecticut:
6.9% (14,706)
Number of households with income $60k - 75k:
Greenwich:
8.9% (28,830)
State:
8.9% (18,888)
Number of households with income $75k - 100k:
Greenwich:
13.5% (43,759)
State:
13.5% (28,669)
Number of households with income $100k - 125k:
Greenwich:
8.2% (26,611)
State:
8.2% (17,434)
Number of households with income $125k - 150k:
Greenwich:
6.5% (20,991)
State:
6.5% (13,752)
Number of households with income $150k - 200k:
Greenwich:
6.6% (21,543)
State:
6.6% (14,114)
Number of households with income > $200k:
Greenwich:
6.4% (20,804)
State:
6.4% (13,630)
Aggregate household income in Greenwich in 2022: $806,579,168
Median family income in Greenwich in 2022:
Greenwich:
$82,380
State:
$68,336
Number of families with income < $10k:
Greenwich:
3.6% (108)
Connecticut:
5.2% (7,456)
Number of families with income $10k - 20k:
Greenwich:
3.4% (100)
State:
6.0% (8,616)
Number of families with income $20k - 30k:
Greenwich:
3.9% (117)
State:
8.9% (12,680)
Number of families with income $30k - 40k:
Greenwich:
4.1% (122)
State:
8.5% (12,090)
Number of families with income $40k - 50k:
Greenwich:
4.5% (134)
State:
8.8% (12,624)
Number of families with income $50k - 60k:
Greenwich:
4.8% (143)
State:
8.4% (11,924)
Number of families with income $60k - 75k:
Greenwich:
4.4% (131)
State:
8.9% (12,677)
Number of families with income $75k - 100k:
Greenwich:
8.0% (238)
State:
14.3% (20,457)
Number of families with income $100k - 125k:
Greenwich:
6.4% (189)
State:
8.2% (11,720)
Number of families with income $125k - 150k:
Greenwich:
9.6% (286)
State:
8.2% (11,729)
Number of families with income $150k - 200k:
Greenwich:
9.7% (288)
State:
7.1% (10,096)
Number of families with income > $200k:
Greenwich:
37.5% (1,115)
State:
7.4% (10,622)
Median non-family income in Greenwich in 2022:
Greenwich:
$39,124
State:
$36,714
Change in median non-family income between 2000 and 2022:
Greenwich, Connecticut:
+73.9%
Connecticut:
+90.0%
Median per capita income in Greenwich in 2022:
Greenwich:
$50,227
Connecticut:
$28,507
Change in median per capita income between 2000 and 2022:
Greenwich, Connecticut:
+80.3%
State:
+117.2%
Income statistics for American Indian and Alaska Native residents
Median household income in Greenwich, CT in 2022:
Greenwich:
$9,876
Connecticut:
$41,848
Change in median household income between 2000 and 2022:
Greenwich, Connecticut:
+12.9%
State:
+12.9%
Number of households with income < $10k:
Greenwich:
8.4% (24,881)
Connecticut:
10.2% (340)
Number of households with income $10k - 20k:
Greenwich:
9.4% (27,766)
State:
8.5% (283)
Number of households with income $20k - 30k:
Greenwich:
8.5% (25,115)
State:
9.4% (314)
Number of households with income $30k - 40k:
Greenwich:
9.1% (26,908)
State:
10.1% (337)
Number of households with income $40k - 50k:
Greenwich:
8.3% (24,681)
State:
13.4% (447)
Number of households with income $50k - 60k:
Greenwich:
7.8% (23,273)
State:
3.1% (104)
Number of households with income $60k - 75k:
Greenwich:
9.8% (29,009)
State:
5.6% (188)
Number of households with income $75k - 100k:
Greenwich:
12.6% (37,446)
State:
13.4% (447)
Number of households with income $100k - 125k:
Greenwich:
9.4% (28,002)
Connecticut:
9.5% (317)
Number of households with income $125k - 150k:
Greenwich:
5.6% (16,765)
State:
3.9% (131)
Number of households with income $150k - 200k:
Greenwich:
6.0% (17,673)
State:
6.3% (212)
Number of households with income > $200k:
Greenwich:
5.2% (15,297)
State:
6.8% (228)
Aggregate household income in Greenwich in 2022: $67,657
Median non-family income in Greenwich in 2022:
Greenwich:
$19,695
State:
$40,310
Change in median non-family income between 2000 and 2022:
Greenwich, Connecticut:
+125.1%
State:
+125.1%
Median per capita income in Greenwich in 2022:
Greenwich:
$9,709
State:
$25,355
Change in median per capita income between 2000 and 2022:
Greenwich, Connecticut:
+45.9%
Connecticut:
+39.4%
Income statistics for Multirace residents
Median household income in Greenwich, CT in 2022:
Greenwich:
$116,237
Connecticut:
$77,277
Change in median household income between 2000 and 2022:
Greenwich, Connecticut:
+119.4%
State:
+113.6%
Number of households with income < $10k:
Greenwich:
6.0% (10,916)
State:
6.0% (7,457)
Number of households with income $10k - 20k:
Greenwich:
8.1% (14,841)
State:
8.1% (10,139)
Number of households with income $20k - 30k:
Greenwich:
7.0% (12,738)
State:
7.0% (8,702)
Number of households with income $30k - 40k:
Greenwich:
6.9% (12,510)
State:
6.9% (8,546)
Number of households with income $40k - 50k:
Greenwich:
7.0% (12,752)
Connecticut:
7.0% (8,712)
Number of households with income $50k - 60k:
Greenwich:
5.9% (10,731)
State:
5.9% (7,331)
Number of households with income $60k - 75k:
Greenwich:
8.5% (15,566)
State:
8.5% (10,634)
Number of households with income $75k - 100k:
Greenwich:
14.1% (25,763)
State:
14.1% (17,600)
Number of households with income $100k - 125k:
Greenwich:
9.9% (18,126)
State:
9.9% (12,383)
Number of households with income $125k - 150k:
Greenwich:
7.2% (13,059)
State:
7.2% (8,921)
Number of households with income $150k - 200k:
Greenwich:
8.8% (15,988)
Connecticut:
8.8% (10,922)
Number of households with income > $200k:
Greenwich:
10.6% (19,391)
Connecticut:
10.6% (13,247)
Aggregate household income in Greenwich in 2022: $361,126,952
Median family income in Greenwich in 2022:
Greenwich:
$150,046
Connecticut:
$84,255
Number of families with income $10k - 20k:
Greenwich:
1.6% (31)
Connecticut:
4.8% (4,079)
Number of families with income $20k - 30k:
Greenwich:
3.1% (60)
State:
6.9% (5,812)
Number of families with income $30k - 40k:
Greenwich:
0.8% (15)
Connecticut:
6.8% (5,759)
Number of families with income $40k - 50k:
Greenwich:
1.7% (32)
State:
6.9% (5,792)
Number of families with income $50k - 60k:
Greenwich:
5.9% (114)
Connecticut:
7.6% (6,420)
Number of families with income $60k - 75k:
Greenwich:
2.2% (42)
State:
7.8% (6,550)
Number of families with income $75k - 100k:
Greenwich:
11.3% (220)
State:
14.5% (12,236)
Number of families with income $100k - 125k:
Greenwich:
11.5% (224)
Connecticut:
9.2% (7,787)
Number of families with income $125k - 150k:
Greenwich:
6.7% (130)
State:
8.9% (7,503)
Number of families with income $150k - 200k:
Greenwich:
24.8% (482)
State:
9.3% (7,818)
Number of families with income > $200k:
Greenwich:
30.4% (591)
State:
13.7% (11,603)
Median non-family income in Greenwich in 2022:
Greenwich:
$49,296
Connecticut:
$44,462
Change in median non-family income between 2000 and 2022:
Greenwich, Connecticut:
+81.0%
State:
+97.6%
Median per capita income in Greenwich in 2022:
Greenwich:
$53,104
Connecticut:
$32,794
Change in median per capita income between 2000 and 2022:
Greenwich, Connecticut:
+95.5%
Connecticut:
+117.2%
Income statistics for other residents
Number of households with income < $10k:
Greenwich:
9.0% (128)
Connecticut:
9.0% (8,596)
Number of households with income $10k - 20k:
Greenwich:
10.2% (145)
State:
10.2% (9,773)
Number of households with income $20k - 30k:
Greenwich:
9.1% (129)
Connecticut:
9.1% (8,691)
Number of households with income $30k - 40k:
Greenwich:
7.8% (111)
Connecticut:
7.8% (7,447)
Number of households with income $40k - 50k:
Greenwich:
8.2% (117)
State:
8.2% (7,860)
Number of households with income $50k - 60k:
Greenwich:
6.0% (86)
Connecticut:
6.0% (5,757)
Number of households with income $60k - 75k:
Greenwich:
9.3% (133)
State:
9.3% (8,942)
Number of households with income $75k - 100k:
Greenwich:
14.3% (204)
State:
14.3% (13,700)
Number of households with income $100k - 125k:
Greenwich:
7.2% (103)
State:
7.2% (6,906)
Number of households with income $125k - 150k:
Greenwich:
6.5% (92)
State:
6.5% (6,215)
Number of households with income $150k - 200k:
Greenwich:
6.1% (87)
Connecticut:
6.1% (5,865)
Number of households with income > $200k:
Greenwich:
6.3% (90)
Connecticut:
6.3% (6,065)
Aggregate household income in Greenwich in 2022: $199,660,189
Median family income in Greenwich in 2022:
Greenwich:
$93,847
State:
$67,610
Number of families with income < $10k:
Greenwich:
1.6% (11)
State:
5.0% (3,311)
Number of families with income $10k - 20k:
Greenwich:
1.3% (9)
Connecticut:
7.5% (4,961)
Number of families with income $20k - 30k:
Greenwich:
4.7% (32)
Connecticut:
8.7% (5,752)
Number of families with income $30k - 40k:
Greenwich:
6.5% (45)
State:
9.1% (5,996)
Number of families with income $40k - 50k:
Greenwich:
10.3% (71)
State:
9.1% (6,039)
Number of families with income $50k - 60k:
Greenwich:
3.0% (21)
State:
5.9% (3,868)
Number of families with income $75k - 100k:
Greenwich:
10.8% (75)
State:
15.7% (10,362)
Number of families with income $100k - 125k:
Greenwich:
8.4% (58)
Connecticut:
6.8% (4,502)
Number of families with income $125k - 150k:
Greenwich:
18.1% (125)
State:
9.0% (5,971)
Number of families with income $150k - 200k:
Greenwich:
35.3% (243)
State:
6.6% (4,339)
Median non-family income in Greenwich in 2022:
Greenwich:
$40,457
Connecticut:
$34,285
Change in median non-family income between 2000 and 2022:
Greenwich, Connecticut:
+83.6%
State:
+83.6%
Median per capita income in Greenwich in 2022:
Greenwich:
$45,060
State:
$29,353
Discuss Greenwich, Connecticut (CT) on our hugely popular Connecticut forum.