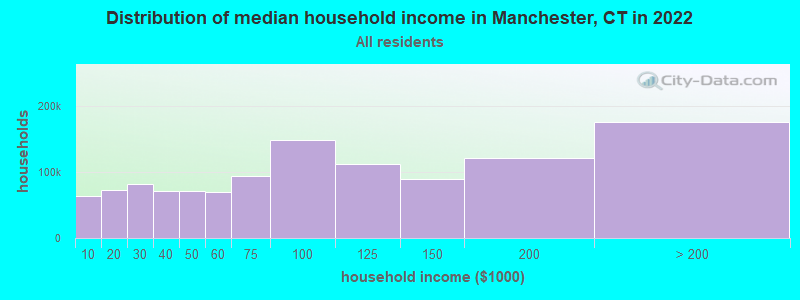
The median household income in Manchester, CT in 2022 was $83,635, which was 5.7% less than the median annual income of $88,429 across the entire state of Connecticut. Compared to the median income of $49,426 in 2000 this represents an increase of 40.9%. The per capita income in 2022 was $47,541, which means an increase of 45.3% compared to 2000 when it was $25,989.
Income statistics for all residents
Median household income in Manchester, CT in 2022:
Manchester:
$83,636
Connecticut:
$88,429
Change in median household income between 2000 and 2022:
Manchester, Connecticut:
+69.2%
State:
+64.0%
Number of households with income < $10k:
Manchester:
5.2% (34,066)
State:
5.1% (72,746)
Number of households with income $10k - 20k:
Manchester:
5.8% (38,415)
State:
5.7% (81,643)
Number of households with income $20k - 30k:
Manchester:
6.6% (43,482)
State:
6.5% (92,844)
Number of households with income $30k - 40k:
Manchester:
5.9% (39,022)
Connecticut:
5.9% (83,934)
Number of households with income $40k - 50k:
Manchester:
5.9% (38,772)
State:
5.8% (83,025)
Number of households with income $50k - 60k:
Manchester:
5.8% (38,018)
State:
5.7% (81,788)
Number of households with income $60k - 75k:
Manchester:
8.1% (53,269)
Connecticut:
8.1% (115,651)
Number of households with income $75k - 100k:
Manchester:
12.6% (83,194)
Connecticut:
12.6% (180,173)
Number of households with income $100k - 125k:
Manchester:
9.8% (64,765)
Connecticut:
9.9% (141,231)
Number of households with income $125k - 150k:
Manchester:
7.8% (51,721)
State:
7.9% (112,826)
Number of households with income $150k - 200k:
Manchester:
10.7% (70,751)
State:
10.8% (154,641)
Number of households with income > $200k:
Manchester:
16.0% (105,697)
Connecticut:
16.3% (233,133)
Aggregate household income in Manchester in 2022: $59,829,023,701
Median family income in Manchester in 2022:
Manchester:
$104,961
State:
$115,183
Median non-family income in Manchester in 2022:
Manchester:
$60,607
Connecticut:
$50,964
Change in median non-family income between 2000 and 2022:
Manchester, Connecticut:
+71.5%
State:
+65.1%
Median per capita income in Manchester in 2022:
Manchester:
$47,542
Connecticut:
$51,581
Change in median per capita income between 2000 and 2022:
Manchester, Connecticut:
+82.9%
State:
+79.3%
Income statistics for White residents
Median household income in Manchester, CT in 2022:
Manchester:
$86,397
State:
$96,890
Change in median household income between 2000 and 2022:
Manchester, Connecticut:
+69.4%
State:
+68.5%
Number of households with income < $10k:
Manchester:
4.2% (18,897)
State:
4.2% (42,265)
Number of households with income $10k - 20k:
Manchester:
4.9% (21,726)
State:
4.8% (48,323)
Number of households with income $20k - 30k:
Manchester:
5.8% (25,838)
State:
5.7% (57,716)
Number of households with income $30k - 40k:
Manchester:
5.4% (23,917)
State:
5.3% (53,827)
Number of households with income $40k - 50k:
Manchester:
5.3% (23,818)
Connecticut:
5.3% (53,301)
Number of households with income $50k - 60k:
Manchester:
5.6% (24,787)
State:
5.5% (55,690)
Number of households with income $60k - 75k:
Manchester:
7.9% (35,422)
State:
8.0% (80,329)
Number of households with income $75k - 100k:
Manchester:
12.7% (56,759)
State:
12.7% (128,070)
Number of households with income $100k - 125k:
Manchester:
10.0% (44,569)
State:
10.0% (101,210)
Number of households with income $125k - 150k:
Manchester:
8.0% (35,782)
State:
8.0% (81,250)
Number of households with income $150k - 200k:
Manchester:
11.8% (52,613)
State:
11.8% (119,527)
Number of households with income > $200k:
Manchester:
18.4% (82,364)
State:
18.6% (187,875)
Aggregate household income in Manchester in 2022: $40,480,960,349
Median family income in Manchester in 2022:
Manchester:
$114,014
State:
$128,955
Number of families with income < $10k:
Manchester:
4.0% (339)
State:
1.9% (11,537)
Number of families with income $10k - 20k:
Manchester:
2.6% (219)
State:
1.8% (11,289)
Number of families with income $20k - 30k:
Manchester:
3.8% (324)
State:
3.0% (18,506)
Number of families with income $30k - 40k:
Manchester:
5.0% (428)
State:
2.9% (18,160)
Number of families with income $40k - 50k:
Manchester:
5.8% (493)
Connecticut:
3.9% (24,550)
Number of families with income $50k - 60k:
Manchester:
5.8% (495)
Connecticut:
4.3% (26,723)
Number of families with income $60k - 75k:
Manchester:
9.7% (828)
State:
7.1% (44,075)
Number of families with income $75k - 100k:
Manchester:
14.4% (1,227)
Connecticut:
12.5% (77,679)
Number of families with income $100k - 125k:
Manchester:
14.3% (1,220)
State:
11.1% (69,086)
Number of families with income $125k - 150k:
Manchester:
8.2% (701)
Connecticut:
9.6% (59,616)
Number of families with income $150k - 200k:
Manchester:
13.3% (1,139)
State:
15.7% (97,890)
Number of families with income > $200k:
Manchester:
13.2% (1,130)
State:
26.3% (163,417)
Median non-family income in Manchester in 2022:
Manchester:
$61,361
State:
$54,067
Change in median non-family income between 2000 and 2022:
Manchester, Connecticut:
+73.7%
State:
+68.7%
Median per capita income in Manchester in 2022:
Manchester:
$53,751
State:
$59,916
Change in median per capita income between 2000 and 2022:
Manchester, Connecticut:
+92.1%
State:
+90.2%
Income statistics for Black or African American residents
Median household income in Manchester, CT in 2022:
Manchester:
$57,568
State:
$61,803
Change in median household income between 2000 and 2022:
Manchester, Connecticut:
+60.9%
Connecticut:
+76.1%
Number of households with income < $10k:
Manchester:
6.8% (9,676)
State:
6.8% (9,494)
Number of households with income $10k - 20k:
Manchester:
7.9% (11,214)
State:
7.9% (11,003)
Number of households with income $20k - 30k:
Manchester:
10.8% (15,333)
State:
10.8% (15,045)
Number of households with income $30k - 40k:
Manchester:
8.2% (11,721)
State:
8.2% (11,501)
Number of households with income $40k - 50k:
Manchester:
7.4% (10,615)
State:
7.4% (10,416)
Number of households with income $50k - 60k:
Manchester:
7.5% (10,736)
State:
7.5% (10,534)
Number of households with income $60k - 75k:
Manchester:
8.0% (11,460)
Connecticut:
8.0% (11,244)
Number of households with income $75k - 100k:
Manchester:
9.6% (13,626)
Connecticut:
9.6% (13,370)
Number of households with income $100k - 125k:
Manchester:
10.2% (14,517)
State:
10.2% (14,244)
Number of households with income $125k - 150k:
Manchester:
8.0% (11,462)
State:
8.0% (11,246)
Number of households with income $150k - 200k:
Manchester:
7.7% (10,933)
State:
7.7% (10,727)
Number of households with income > $200k:
Manchester:
7.9% (11,299)
State:
7.9% (11,086)
Aggregate household income in Manchester in 2022: $369,221,344
Median family income in Manchester in 2022:
Manchester:
$78,293
State:
$87,228
Number of families with income < $10k:
Manchester:
5.2% (57)
Connecticut:
3.8% (3,184)
Number of families with income $10k - 20k:
Manchester:
3.1% (35)
State:
4.8% (4,026)
Number of families with income $20k - 30k:
Manchester:
7.0% (77)
State:
6.0% (5,015)
Number of families with income $30k - 40k:
Manchester:
11.3% (125)
State:
7.7% (6,445)
Number of families with income $40k - 50k:
Manchester:
10.2% (113)
State:
6.6% (5,531)
Number of families with income $50k - 60k:
Manchester:
4.4% (49)
State:
5.4% (4,480)
Number of families with income $60k - 75k:
Manchester:
13.4% (149)
Connecticut:
8.2% (6,861)
Number of families with income $75k - 100k:
Manchester:
12.8% (142)
Connecticut:
12.7% (10,598)
Number of families with income $100k - 125k:
Manchester:
5.8% (65)
Connecticut:
11.4% (9,482)
Number of families with income $125k - 150k:
Manchester:
6.5% (73)
Connecticut:
11.2% (9,356)
Number of families with income $150k - 200k:
Manchester:
9.6% (106)
State:
11.4% (9,497)
Number of families with income > $200k:
Manchester:
10.7% (118)
Connecticut:
10.8% (9,057)
Median non-family income in Manchester in 2022:
Manchester:
$54,409
State:
$38,608
Change in median non-family income between 2000 and 2022:
Manchester, Connecticut:
+77.0%
Connecticut:
+77.0%
Median per capita income in Manchester in 2022:
Manchester:
$35,079
State:
$36,289
Change in median per capita income between 2000 and 2022:
Manchester, Connecticut:
+115.2%
State:
+117.5%
Income statistics for Asian residents
Median household income in Manchester, CT in 2022:
Manchester:
$127,983
Connecticut:
$110,568
Change in median household income between 2000 and 2022:
Manchester, Connecticut:
+110.1%
State:
+79.5%
Number of households with income < $10k:
Manchester:
7.1% (4,199)
State:
7.1% (4,245)
Number of households with income $10k - 20k:
Manchester:
3.5% (2,064)
State:
3.5% (2,087)
Number of households with income $20k - 30k:
Manchester:
4.1% (2,437)
Connecticut:
4.1% (2,464)
Number of households with income $30k - 40k:
Manchester:
4.1% (2,451)
State:
4.1% (2,478)
Number of households with income $40k - 50k:
Manchester:
3.3% (1,962)
Connecticut:
3.3% (1,983)
Number of households with income $50k - 60k:
Manchester:
3.9% (2,303)
Connecticut:
3.9% (2,328)
Number of households with income $60k - 75k:
Manchester:
7.0% (4,182)
Connecticut:
7.0% (4,228)
Number of households with income $75k - 100k:
Manchester:
11.5% (6,836)
State:
11.5% (6,911)
Number of households with income $100k - 125k:
Manchester:
10.2% (6,061)
Connecticut:
10.2% (6,127)
Number of households with income $125k - 150k:
Manchester:
8.5% (5,024)
Connecticut:
8.5% (5,079)
Number of households with income $150k - 200k:
Manchester:
12.4% (7,353)
State:
12.4% (7,434)
Number of households with income > $200k:
Manchester:
24.4% (14,502)
Connecticut:
24.4% (14,661)
Aggregate household income in Manchester in 2022: $195,694,148
Median family income in Manchester in 2022:
Manchester:
$116,894
State:
$134,548
Number of families with income < $10k:
Manchester:
16.8% (141)
State:
4.3% (1,875)
Number of families with income $10k - 20k:
Manchester:
4.0% (34)
State:
1.6% (700)
Number of families with income $20k - 30k:
Manchester:
5.3% (44)
State:
3.8% (1,682)
Number of families with income $30k - 40k:
Manchester:
4.8% (41)
Connecticut:
3.8% (1,652)
Number of families with income $40k - 50k:
Manchester:
1.8% (16)
Connecticut:
2.0% (863)
Number of families with income $50k - 60k:
Manchester:
6.0% (51)
State:
3.7% (1,635)
Number of families with income $60k - 75k:
Manchester:
9.5% (80)
State:
6.0% (2,651)
Number of families with income $75k - 100k:
Manchester:
10.5% (89)
Connecticut:
11.0% (4,844)
Number of families with income $100k - 125k:
Manchester:
14.2% (120)
Connecticut:
10.5% (4,621)
Number of families with income $125k - 150k:
Manchester:
4.1% (35)
State:
8.2% (3,588)
Number of families with income $150k - 200k:
Manchester:
10.2% (86)
State:
14.2% (6,237)
Number of families with income > $200k:
Manchester:
12.7% (107)
State:
30.8% (13,522)
Median non-family income in Manchester in 2022:
Manchester:
$189,272
State:
$63,785
Change in median non-family income between 2000 and 2022:
Manchester, Connecticut:
+148.6%
Connecticut:
+77.9%
Median per capita income in Manchester in 2022:
Manchester:
$43,109
State:
$55,295
Change in median per capita income between 2000 and 2022:
Manchester, Connecticut:
+103.6%
State:
+97.8%
Income statistics for Hispanic or Latino residents
Median household income in Manchester, CT in 2022:
Manchester:
$72,781
Connecticut:
$60,275
Change in median household income between 2000 and 2022:
Manchester, Connecticut:
+67.8%
State:
+87.9%
Number of households with income < $10k:
Manchester:
8.7% (25,131)
State:
8.7% (18,584)
Number of households with income $10k - 20k:
Manchester:
9.1% (26,011)
Connecticut:
9.1% (19,235)
Number of households with income $20k - 30k:
Manchester:
8.9% (25,679)
State:
8.9% (18,989)
Number of households with income $30k - 40k:
Manchester:
7.5% (21,592)
State:
7.5% (15,967)
Number of households with income $40k - 50k:
Manchester:
8.7% (24,971)
State:
8.7% (18,466)
Number of households with income $50k - 60k:
Manchester:
6.9% (19,887)
State:
6.9% (14,706)
Number of households with income $60k - 75k:
Manchester:
8.9% (25,542)
State:
8.9% (18,888)
Number of households with income $75k - 100k:
Manchester:
13.5% (38,769)
Connecticut:
13.5% (28,669)
Number of households with income $100k - 125k:
Manchester:
8.2% (23,576)
State:
8.2% (17,434)
Number of households with income $125k - 150k:
Manchester:
6.5% (18,597)
State:
6.5% (13,752)
Number of households with income $150k - 200k:
Manchester:
6.6% (19,086)
State:
6.6% (14,114)
Number of households with income > $200k:
Manchester:
6.4% (18,432)
State:
6.4% (13,630)
Aggregate household income in Manchester in 2022: $471,252,169
Median family income in Manchester in 2022:
Manchester:
$80,570
Connecticut:
$68,336
Number of families with income < $10k:
Manchester:
6.8% (156)
State:
5.2% (7,456)
Number of families with income $10k - 20k:
Manchester:
7.4% (170)
State:
6.0% (8,616)
Number of families with income $20k - 30k:
Manchester:
10.5% (242)
Connecticut:
8.9% (12,680)
Number of families with income $30k - 40k:
Manchester:
10.7% (247)
State:
8.5% (12,090)
Number of families with income $40k - 50k:
Manchester:
10.4% (240)
Connecticut:
8.8% (12,624)
Number of families with income $50k - 60k:
Manchester:
9.8% (225)
State:
8.4% (11,924)
Number of families with income $60k - 75k:
Manchester:
9.3% (214)
State:
8.9% (12,677)
Number of families with income $75k - 100k:
Manchester:
13.8% (317)
Connecticut:
14.3% (20,457)
Number of families with income $100k - 125k:
Manchester:
8.3% (192)
Connecticut:
8.2% (11,720)
Number of families with income $125k - 150k:
Manchester:
5.6% (128)
State:
8.2% (11,729)
Number of families with income $150k - 200k:
Manchester:
4.7% (107)
State:
7.1% (10,096)
Number of families with income > $200k:
Manchester:
2.7% (63)
State:
7.4% (10,622)
Median non-family income in Manchester in 2022:
Manchester:
$46,731
Connecticut:
$36,714
Change in median non-family income between 2000 and 2022:
Manchester, Connecticut:
+73.9%
State:
+90.0%
Median per capita income in Manchester in 2022:
Manchester:
$30,865
State:
$28,507
Change in median per capita income between 2000 and 2022:
Manchester, Connecticut:
+80.3%
State:
+117.2%
Income statistics for American Indian and Alaska Native residents
Median household income in Manchester, CT in 2022:
Manchester:
$85,389
Connecticut:
$41,848
Change in median household income between 2000 and 2022:
Manchester, Connecticut:
+12.9%
State:
+12.9%
Number of households with income < $10k:
Manchester:
8.4% (215,132)
State:
10.2% (340)
Number of households with income $10k - 20k:
Manchester:
9.4% (240,082)
Connecticut:
8.5% (283)
Number of households with income $20k - 30k:
Manchester:
8.5% (217,157)
State:
9.4% (314)
Number of households with income $30k - 40k:
Manchester:
9.1% (232,657)
State:
10.1% (337)
Number of households with income $40k - 50k:
Manchester:
8.3% (213,409)
State:
13.4% (447)
Number of households with income $50k - 60k:
Manchester:
7.8% (201,227)
State:
3.1% (104)
Number of households with income $60k - 75k:
Manchester:
9.8% (250,820)
Connecticut:
5.6% (188)
Number of households with income $75k - 100k:
Manchester:
12.6% (323,769)
State:
13.4% (447)
Number of households with income $100k - 125k:
Manchester:
9.4% (242,115)
Connecticut:
9.5% (317)
Number of households with income $125k - 150k:
Manchester:
5.6% (144,953)
State:
3.9% (131)
Number of households with income $150k - 200k:
Manchester:
6.0% (152,808)
State:
6.3% (212)
Number of households with income > $200k:
Manchester:
5.2% (132,264)
Connecticut:
6.8% (228)
Aggregate household income in Manchester in 2022: $3,344,504
Median family income in Manchester in 2022:
Manchester:
$103,380
State:
$57,217
Number of families with income $50k - 60k:
Manchester:
18.3% (10)
Connecticut:
2.3% (46)
Number of families with income $60k - 75k:
Manchester:
13.8% (7)
State:
6.9% (139)
Number of families with income $75k - 100k:
Manchester:
67.9% (36)
Connecticut:
17.4% (349)
Median non-family income in Manchester in 2022:
Manchester:
$169,219
State:
$40,310
Change in median non-family income between 2000 and 2022:
Manchester, Connecticut:
+125.1%
Connecticut:
+125.1%
Median per capita income in Manchester in 2022:
Manchester:
$34,530
State:
$25,355
Change in median per capita income between 2000 and 2022:
Manchester, Connecticut:
+45.9%
State:
+39.4%
Income statistics for Multirace residents
Median household income in Manchester, CT in 2022:
Manchester:
$87,887
State:
$77,277
Change in median household income between 2000 and 2022:
Manchester, Connecticut:
+119.4%
State:
+113.6%
Number of households with income < $10k:
Manchester:
6.0% (8,253)
Connecticut:
6.0% (7,457)
Number of households with income $10k - 20k:
Manchester:
8.1% (11,222)
State:
8.1% (10,139)
Number of households with income $20k - 30k:
Manchester:
7.0% (9,631)
Connecticut:
7.0% (8,702)
Number of households with income $30k - 40k:
Manchester:
6.9% (9,458)
State:
6.9% (8,546)
Number of households with income $40k - 50k:
Manchester:
7.0% (9,643)
Connecticut:
7.0% (8,712)
Number of households with income $50k - 60k:
Manchester:
5.9% (8,114)
State:
5.9% (7,331)
Number of households with income $60k - 75k:
Manchester:
8.5% (11,770)
State:
8.5% (10,634)
Number of households with income $75k - 100k:
Manchester:
14.1% (19,479)
State:
14.1% (17,600)
Number of households with income $100k - 125k:
Manchester:
9.9% (13,705)
State:
9.9% (12,383)
Number of households with income $125k - 150k:
Manchester:
7.2% (9,874)
State:
7.2% (8,921)
Number of households with income $150k - 200k:
Manchester:
8.8% (12,088)
State:
8.8% (10,922)
Number of households with income > $200k:
Manchester:
10.6% (14,662)
State:
10.6% (13,247)
Aggregate household income in Manchester in 2022: $177,535,598
Median family income in Manchester in 2022:
Manchester:
$82,336
Connecticut:
$84,255
Number of families with income < $10k:
Manchester:
10.2% (68)
State:
3.6% (3,027)
Number of families with income $10k - 20k:
Manchester:
8.0% (53)
State:
4.8% (4,079)
Number of families with income $20k - 30k:
Manchester:
10.2% (68)
State:
6.9% (5,812)
Number of families with income $30k - 40k:
Manchester:
18.0% (120)
State:
6.8% (5,759)
Number of families with income $40k - 50k:
Manchester:
16.0% (107)
State:
6.9% (5,792)
Number of families with income $50k - 60k:
Manchester:
3.4% (23)
Connecticut:
7.6% (6,420)
Number of families with income $60k - 75k:
Manchester:
26.2% (175)
State:
7.8% (6,550)
Number of families with income $75k - 100k:
Manchester:
7.9% (53)
State:
14.5% (12,236)
Median non-family income in Manchester in 2022:
Manchester:
$67,129
State:
$44,462
Change in median non-family income between 2000 and 2022:
Manchester, Connecticut:
+81.0%
Connecticut:
+97.6%
Median per capita income in Manchester in 2022:
Manchester:
$19,923
Connecticut:
$32,794
Change in median per capita income between 2000 and 2022:
Manchester, Connecticut:
+95.5%
State:
+117.2%
Income statistics for other residents
Number of households with income < $10k:
Manchester:
9.0% (150)
State:
9.0% (8,596)
Number of households with income $10k - 20k:
Manchester:
10.2% (170)
Connecticut:
10.2% (9,773)
Number of households with income $20k - 30k:
Manchester:
9.1% (151)
Connecticut:
9.1% (8,691)
Number of households with income $30k - 40k:
Manchester:
7.8% (130)
Connecticut:
7.8% (7,447)
Number of households with income $40k - 50k:
Manchester:
8.2% (137)
State:
8.2% (7,860)
Number of households with income $50k - 60k:
Manchester:
6.0% (100)
Connecticut:
6.0% (5,757)
Number of households with income $60k - 75k:
Manchester:
9.4% (156)
State:
9.3% (8,942)
Number of households with income $75k - 100k:
Manchester:
14.3% (238)
State:
14.3% (13,700)
Number of households with income $100k - 125k:
Manchester:
7.2% (120)
State:
7.2% (6,906)
Number of households with income $125k - 150k:
Manchester:
6.5% (108)
State:
6.5% (6,215)
Number of households with income $150k - 200k:
Manchester:
6.1% (102)
Connecticut:
6.1% (5,865)
Number of households with income > $200k:
Manchester:
6.4% (106)
State:
6.3% (6,065)
Aggregate household income in Manchester in 2022: $233,739,796
Median family income in Manchester in 2022:
Manchester:
$93,088
State:
$67,610
Number of families with income < $10k:
Manchester:
1.8% (18)
Connecticut:
5.0% (3,311)
Number of families with income $10k - 20k:
Manchester:
6.5% (66)
State:
7.5% (4,961)
Number of families with income $20k - 30k:
Manchester:
6.5% (66)
Connecticut:
8.7% (5,752)
Number of families with income $30k - 40k:
Manchester:
7.3% (74)
State:
9.1% (5,996)
Number of families with income $40k - 50k:
Manchester:
12.2% (124)
Connecticut:
9.1% (6,039)
Number of families with income $50k - 60k:
Manchester:
7.0% (71)
Connecticut:
5.9% (3,868)
Number of families with income $60k - 75k:
Manchester:
16.3% (166)
State:
9.4% (6,232)
Number of families with income $75k - 100k:
Manchester:
10.0% (101)
Connecticut:
15.7% (10,362)
Number of families with income $100k - 125k:
Manchester:
10.3% (105)
State:
6.8% (4,502)
Number of families with income > $200k:
Manchester:
22.0% (223)
State:
7.1% (4,717)
Median non-family income in Manchester in 2022:
Manchester:
$39,278
State:
$34,285
Change in median non-family income between 2000 and 2022:
Manchester, Connecticut:
+83.6%
Connecticut:
+83.6%
Median per capita income in Manchester in 2022:
Manchester:
$40,558
State:
$29,353
Discuss Manchester, Connecticut (CT) on our hugely popular Connecticut forum.