Paso Robles, California (CA) income map, earnings map, and wages data
The median household income in Paso Robles, CA in 2022 was $89,865, which was about the same as the median annual income of $91,551 across the entire state of California. Compared to the median income of $42,263 in 2000 this represents an increase of 53.0%. The per capita income in 2022 was $48,376, which means an increase of 58.4% compared to 2000 when it was $20,115.
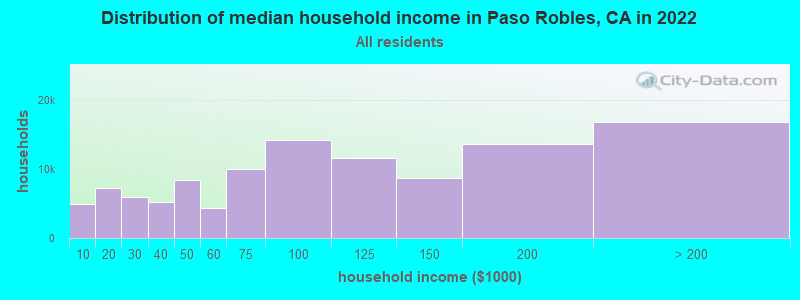
Income statistics for all residents
Median household income in Paso Robles, CA in 2022:| Paso Robles: | $89,865 |
| State: | $91,551 |
Change in median household income between 2000 and 2022:| Paso Robles, California: | +112.6% |
| California: | +92.8% |
Number of households with income < $10k:| Paso Robles: | 4.4% (4,943) |
| State: | 4.8% (654,370) |
Number of households with income $10k - 20k:| Paso Robles: | 6.5% (7,212) |
| State: | 5.8% (789,493) |
Number of households with income $20k - 30k:| Paso Robles: | 5.3% (5,938) |
| State: | 5.7% (778,318) |
Number of households with income $30k - 40k:| Paso Robles: | 4.7% (5,175) |
| State: | 5.8% (783,170) |
Number of households with income $40k - 50k:| Paso Robles: | 7.6% (8,476) |
| State: | 5.8% (781,352) |
Number of households with income $50k - 60k:| Paso Robles: | 3.9% (4,315) |
| State: | 5.6% (760,175) |
Number of households with income $60k - 75k:| Paso Robles: | 9.0% (10,044) |
| State: | 8.2% (1,104,699) |
Number of households with income $75k - 100k:| Paso Robles: | 12.8% (14,290) |
| California: | 12.0% (1,627,633) |
Number of households with income $100k - 125k:| Paso Robles: | 10.5% (11,639) |
| California: | 10.0% (1,358,619) |
Number of households with income $125k - 150k:| Paso Robles: | 7.8% (8,715) |
| California: | 7.6% (1,027,455) |
Number of households with income $150k - 200k:| Paso Robles: | 12.3% (13,662) |
| California: | 10.6% (1,439,811) |
Number of households with income > $200k:| Paso Robles: | 15.2% (16,871) |
| California: | 18.0% (2,445,491) |
Aggregate household income in Paso Robles in 2022: $5,512,619,453
Median family income in Paso Robles in 2022:| Paso Robles: | $106,388 |
| State: | $104,823 |
Median non-family income in Paso Robles in 2022:| Paso Robles: | $54,868 |
| California: | $59,348 |
Change in median non-family income between 2000 and 2022:| Paso Robles, California: | +97.0% |
| California: | +85.3% |
Median per capita income in Paso Robles in 2022:| Paso Robles: | $48,377 |
| State: | $46,661 |
Change in median per capita income between 2000 and 2022:| Paso Robles, California: | +140.5% |
| California: | +105.5% |
Income statistics for White residents
Median household income in Paso Robles, CA in 2022:| Paso Robles: | $93,919 |
| State: | $100,917 |
Change in median household income between 2000 and 2022:| Paso Robles, California: | +112.9% |
| State: | +96.8% |
Number of households with income < $10k:| Paso Robles: | 4.5% (3,953) |
| State: | 4.4% (284,109) |
Number of households with income $10k - 20k:| Paso Robles: | 6.3% (5,502) |
| State: | 5.3% (340,330) |
Number of households with income $20k - 30k:| Paso Robles: | 5.6% (4,904) |
| State: | 5.3% (343,145) |
Number of households with income $30k - 40k:| Paso Robles: | 4.6% (4,017) |
| California: | 5.1% (330,146) |
Number of households with income $40k - 50k:| Paso Robles: | 6.0% (5,196) |
| California: | 5.2% (335,310) |
Number of households with income $50k - 60k:| Paso Robles: | 4.2% (3,646) |
| California: | 5.1% (326,299) |
Number of households with income $60k - 75k:| Paso Robles: | 8.9% (7,781) |
| California: | 7.6% (487,640) |
Number of households with income $75k - 100k:| Paso Robles: | 13.2% (11,483) |
| State: | 11.5% (736,578) |
Number of households with income $100k - 125k:| Paso Robles: | 10.6% (9,245) |
| California: | 10.1% (648,782) |
Number of households with income $125k - 150k:| Paso Robles: | 7.8% (6,841) |
| State: | 7.8% (499,671) |
Number of households with income $150k - 200k:| Paso Robles: | 12.2% (10,615) |
| State: | 11.4% (729,603) |
Number of households with income > $200k:| Paso Robles: | 16.1% (14,046) |
| State: | 21.2% (1,364,246) |
Aggregate household income in Paso Robles in 2022: $3,604,993,305
Median family income in Paso Robles in 2022:| Paso Robles: | $113,569 |
| State: | $125,379 |
Number of families with income < $10k:| Paso Robles: | 2.0% (159) |
| State: | 2.2% (87,079) |
Number of families with income $10k - 20k:| Paso Robles: | 2.5% (202) |
| State: | 2.5% (97,716) |
Number of families with income $20k - 30k:| Paso Robles: | 4.7% (384) |
| State: | 3.5% (137,295) |
Number of families with income $30k - 40k:| Paso Robles: | 3.8% (307) |
| California: | 3.9% (152,947) |
Number of families with income $40k - 50k:| Paso Robles: | 4.1% (338) |
| State: | 4.3% (169,197) |
Number of families with income $50k - 60k:| Paso Robles: | 3.6% (291) |
| California: | 4.5% (176,192) |
Number of families with income $60k - 75k:| Paso Robles: | 8.9% (722) |
| State: | 7.0% (274,752) |
Number of families with income $75k - 100k:| Paso Robles: | 14.0% (1,139) |
| California: | 11.3% (445,632) |
Number of families with income $100k - 125k:| Paso Robles: | 9.2% (747) |
| State: | 10.7% (423,630) |
Number of families with income $125k - 150k:| Paso Robles: | 9.0% (735) |
| State: | 9.1% (357,408) |
Number of families with income $150k - 200k:| Paso Robles: | 12.0% (979) |
| California: | 13.5% (532,693) |
Number of families with income > $200k:| Paso Robles: | 26.4% (2,148) |
| California: | 27.6% (1,086,948) |
Median non-family income in Paso Robles in 2022:| Paso Robles: | $54,699 |
| State: | $62,819 |
Change in median non-family income between 2000 and 2022:| Paso Robles, California: | +94.3% |
| State: | +84.4% |
Median per capita income in Paso Robles in 2022:| Paso Robles: | $51,690 |
| California: | $61,706 |
Change in median per capita income between 2000 and 2022:| Paso Robles, California: | +135.7% |
| State: | +122.7% |
Income statistics for Black or African American residents
Median household income in Paso Robles, CA in 2022:| Paso Robles: | $79,072 |
| State: | $63,268 |
Change in median household income between 2000 and 2022:| Paso Robles, California: | +135.3% |
| State: | +81.0% |
Number of households with income < $10k:| Paso Robles: | 9.0% (35,185) |
| California: | 9.0% (73,219) |
Number of households with income $10k - 20k:| Paso Robles: | 10.6% (41,645) |
| State: | 10.6% (86,666) |
Number of households with income $20k - 30k:| Paso Robles: | 7.1% (27,732) |
| California: | 7.1% (57,719) |
Number of households with income $30k - 40k:| Paso Robles: | 7.2% (28,236) |
| State: | 7.2% (58,714) |
Number of households with income $40k - 50k:| Paso Robles: | 7.1% (27,893) |
| State: | 7.1% (58,075) |
Number of households with income $50k - 60k:| Paso Robles: | 6.8% (26,565) |
| State: | 6.8% (55,229) |
Number of households with income $60k - 75k:| Paso Robles: | 8.8% (34,521) |
| California: | 8.8% (71,895) |
Number of households with income $75k - 100k:| Paso Robles: | 11.9% (46,555) |
| State: | 11.9% (96,893) |
Number of households with income $100k - 125k:| Paso Robles: | 8.7% (33,955) |
| State: | 8.7% (70,729) |
Number of households with income $125k - 150k:| Paso Robles: | 6.3% (24,620) |
| California: | 6.3% (51,211) |
Number of households with income $150k - 200k:| Paso Robles: | 7.2% (28,202) |
| California: | 7.2% (58,687) |
Number of households with income > $200k:| Paso Robles: | 9.3% (36,246) |
| State: | 9.3% (75,487) |
Aggregate household income in Paso Robles in 2022: $9,502,922
Median family income in Paso Robles in 2022:| Paso Robles: | $106,025 |
| State: | $77,263 |
Number of families with income < $10k:| Paso Robles: | 15.7% (24) |
| State: | 5.9% (27,037) |
Number of families with income $10k - 20k:| Paso Robles: | 5.0% (7) |
| State: | 6.4% (29,505) |
Number of families with income $30k - 40k:| Paso Robles: | 4.8% (7) |
| California: | 6.8% (30,948) |
Number of families with income $40k - 50k:| Paso Robles: | 5.6% (8) |
| California: | 8.3% (38,171) |
Number of families with income $50k - 60k:| Paso Robles: | 14.8% (22) |
| State: | 7.0% (31,860) |
Number of families with income $60k - 75k:| Paso Robles: | 6.7% (10) |
| California: | 8.7% (40,021) |
Number of families with income $75k - 100k:| Paso Robles: | 6.5% (10) |
| State: | 12.4% (56,846) |
Number of families with income $150k - 200k:| Paso Robles: | 41.0% (62) |
| State: | 9.3% (42,807) |
Median per capita income in Paso Robles in 2022:| Paso Robles: | $24,859 |
| California: | $36,708 |
Change in median per capita income between 2000 and 2022:| Paso Robles, California: | +122.6% |
| State: | +110.4% |
Income statistics for Asian residents
Median household income in Paso Robles, CA in 2022:| Paso Robles: | $135,525 |
| State: | $119,861 |
Change in median household income between 2000 and 2022:| Paso Robles, California: | +144.6% |
| State: | +116.5% |
Number of households with income < $10k:| Paso Robles: | 5.1% (53,171) |
| State: | 5.1% (106,273) |
Number of households with income $10k - 20k:| Paso Robles: | 4.9% (50,965) |
| State: | 4.9% (101,815) |
Number of households with income $20k - 30k:| Paso Robles: | 4.6% (47,239) |
| State: | 4.6% (94,414) |
Number of households with income $30k - 40k:| Paso Robles: | 4.1% (42,285) |
| State: | 4.1% (84,491) |
Number of households with income $40k - 50k:| Paso Robles: | 4.0% (40,909) |
| State: | 4.0% (81,758) |
Number of households with income $50k - 60k:| Paso Robles: | 3.9% (40,498) |
| State: | 3.9% (80,971) |
Number of households with income $60k - 75k:| Paso Robles: | 6.0% (62,134) |
| State: | 6.0% (124,194) |
Number of households with income $75k - 100k:| Paso Robles: | 9.7% (100,279) |
| State: | 9.7% (200,337) |
Number of households with income $100k - 125k:| Paso Robles: | 9.4% (96,808) |
| California: | 9.4% (193,488) |
Number of households with income $125k - 150k:| Paso Robles: | 7.7% (79,198) |
| State: | 7.7% (158,253) |
Number of households with income $150k - 200k:| Paso Robles: | 12.2% (126,146) |
| California: | 12.2% (252,139) |
Number of households with income > $200k:| Paso Robles: | 28.4% (293,479) |
| State: | 28.4% (586,641) |
Aggregate household income in Paso Robles in 2022: $676,161,992
Median family income in Paso Robles in 2022:| Paso Robles: | $140,635 |
| California: | $136,040 |
Number of families with income $20k - 30k:| Paso Robles: | 10.3% (15) |
| State: | 4.1% (61,519) |
Number of families with income $30k - 40k:| Paso Robles: | 14.2% (20) |
| State: | 3.7% (55,234) |
Number of families with income $50k - 60k:| Paso Robles: | 12.4% (18) |
| State: | 3.9% (58,911) |
Number of families with income $60k - 75k:| Paso Robles: | 32.2% (46) |
| State: | 5.9% (88,675) |
Number of families with income $75k - 100k:| Paso Robles: | 5.0% (7) |
| State: | 9.5% (143,103) |
Number of families with income $125k - 150k:| Paso Robles: | 25.9% (37) |
| State: | 8.0% (120,635) |
Median non-family income in Paso Robles in 2022:| Paso Robles: | $91,786 |
| California: | $74,216 |
Change in median non-family income between 2000 and 2022:| Paso Robles, California: | +125.3% |
| State: | +136.3% |
Median per capita income in Paso Robles in 2022:| Paso Robles: | $34,667 |
| State: | $58,824 |
Change in median per capita income between 2000 and 2022:| Paso Robles, California: | +135.2% |
| State: | +166.8% |
Income statistics for Hispanic or Latino residents
Median household income in Paso Robles, CA in 2022:| Paso Robles: | $86,760 |
| State: | $75,698 |
Number of households with income < $10k:| Paso Robles: | 1.6% (283) |
| State: | 4.3% (183,294) |
Number of households with income $10k - 20k:| Paso Robles: | 5.8% (1,019) |
| State: | 6.0% (253,903) |
Number of households with income $20k - 30k:| Paso Robles: | 2.4% (421) |
| California: | 6.8% (286,386) |
Number of households with income $30k - 40k:| Paso Robles: | 3.6% (634) |
| State: | 7.4% (313,728) |
Number of households with income $40k - 50k:| Paso Robles: | 9.3% (1,612) |
| State: | 7.4% (313,199) |
Number of households with income $50k - 60k:| Paso Robles: | 3.4% (584) |
| State: | 7.2% (305,366) |
Number of households with income $60k - 75k:| Paso Robles: | 12.8% (2,231) |
| State: | 10.3% (434,937) |
Number of households with income $75k - 100k:| Paso Robles: | 13.5% (2,361) |
| State: | 14.4% (607,302) |
Number of households with income $100k - 125k:| Paso Robles: | 12.3% (2,141) |
| California: | 10.6% (447,424) |
Number of households with income $125k - 150k:| Paso Robles: | 8.6% (1,500) |
| State: | 7.5% (316,022) |
Number of households with income $150k - 200k:| Paso Robles: | 13.4% (2,337) |
| State: | 9.2% (386,269) |
Number of households with income > $200k:| Paso Robles: | 13.2% (2,302) |
| State: | 8.8% (372,651) |
Aggregate household income in Paso Robles in 2022: $716,593,043
Median family income in Paso Robles in 2022:| Paso Robles: | $89,596 |
| State: | $77,589 |
Number of families with income < $10k:| Paso Robles: | 0.6% (14) |
| State: | 3.9% (129,468) |
Number of families with income $10k - 20k:| Paso Robles: | 3.2% (68) |
| California: | 4.6% (151,997) |
Number of families with income $20k - 30k:| Paso Robles: | 4.3% (92) |
| California: | 6.6% (216,764) |
Number of families with income $30k - 40k:| Paso Robles: | 8.2% (174) |
| State: | 7.6% (249,849) |
Number of families with income $40k - 50k:| Paso Robles: | 8.4% (177) |
| California: | 7.7% (254,822) |
Number of families with income $50k - 60k:| Paso Robles: | 4.9% (103) |
| State: | 7.4% (244,815) |
Number of families with income $60k - 75k:| Paso Robles: | 9.5% (201) |
| California: | 10.5% (345,838) |
Number of families with income $75k - 100k:| Paso Robles: | 10.1% (215) |
| State: | 14.9% (491,589) |
Number of families with income $100k - 125k:| Paso Robles: | 9.1% (194) |
| State: | 10.7% (355,400) |
Number of families with income $125k - 150k:| Paso Robles: | 9.6% (203) |
| State: | 7.8% (259,317) |
Number of families with income $150k - 200k:| Paso Robles: | 12.7% (270) |
| California: | 9.3% (306,566) |
Number of families with income > $200k:| Paso Robles: | 19.5% (413) |
| State: | 9.1% (299,984) |
Median non-family income in Paso Robles in 2022:| Paso Robles: | $85,524 |
| State: | $49,746 |
Median per capita income in Paso Robles in 2022:| Paso Robles: | $42,937 |
| California: | $27,240 |
Income statistics for American Indian and Alaska Native residents
Median household income in Paso Robles, CA in 2022:| Paso Robles: | $109,505 |
| State: | $76,752 |
Number of households with income < $10k:| Paso Robles: | 5.4% (4,688) |
| State: | 5.4% (8,471) |
Number of households with income $10k - 20k:| Paso Robles: | 6.0% (5,173) |
| State: | 6.0% (9,381) |
Number of households with income $20k - 30k:| Paso Robles: | 5.6% (4,859) |
| State: | 5.5% (8,668) |
Number of households with income $30k - 40k:| Paso Robles: | 8.2% (7,128) |
| State: | 8.3% (13,030) |
Number of households with income $40k - 50k:| Paso Robles: | 7.0% (6,032) |
| State: | 6.9% (10,908) |
Number of households with income $50k - 60k:| Paso Robles: | 7.1% (6,165) |
| State: | 7.1% (11,198) |
Number of households with income $60k - 75k:| Paso Robles: | 9.6% (8,327) |
| State: | 9.6% (15,190) |
Number of households with income $75k - 100k:| Paso Robles: | 14.0% (12,164) |
| State: | 14.1% (22,274) |
Number of households with income $100k - 125k:| Paso Robles: | 11.3% (9,772) |
| California: | 11.2% (17,643) |
Number of households with income $125k - 150k:| Paso Robles: | 8.3% (7,160) |
| State: | 8.3% (13,117) |
Number of households with income $150k - 200k:| Paso Robles: | 8.8% (7,610) |
| State: | 8.8% (13,853) |
Number of households with income > $200k:| Paso Robles: | 8.8% (7,641) |
| State: | 8.8% (13,925) |
Aggregate household income in Paso Robles in 2022: $19,646,904
Median family income in Paso Robles in 2022:| Paso Robles: | $108,591 |
| State: | $81,108 |
Number of families with income < $10k:| Paso Robles: | 4.0% (6) |
| California: | 5.0% (5,711) |
Number of families with income $20k - 30k:| Paso Robles: | 5.5% (8) |
| State: | 4.3% (4,876) |
Number of families with income $30k - 40k:| Paso Robles: | 16.4% (24) |
| State: | 8.8% (9,994) |
Number of families with income $40k - 50k:| Paso Robles: | 8.8% (13) |
| California: | 7.8% (8,776) |
Number of families with income $50k - 60k:| Paso Robles: | 27.0% (40) |
| State: | 6.9% (7,834) |
Number of families with income $60k - 75k:| Paso Robles: | 30.3% (45) |
| State: | 9.1% (10,247) |
Number of families with income $75k - 100k:| Paso Robles: | 8.0% (12) |
| California: | 14.8% (16,731) |
Median non-family income in Paso Robles in 2022:| Paso Robles: | $28,076 |
| California: | $51,296 |
Change in median non-family income between 2000 and 2022:| Paso Robles, California: | +31.6% |
| State: | +114.0% |
Median per capita income in Paso Robles in 2022:| Paso Robles: | $27,004 |
| California: | $30,289 |
Change in median per capita income between 2000 and 2022:| Paso Robles, California: | +30.4% |
| California: | +98.9% |
Income statistics for Multirace residents
Median household income in Paso Robles, CA in 2022:| Paso Robles: | $86,022 |
| State: | $83,153 |
Change in median household income between 2000 and 2022:| Paso Robles, California: | +134.3% |
| State: | +106.0% |
Number of households with income < $10k:| Paso Robles: | 2.0% (259) |
| California: | 4.2% (85,299) |
Number of households with income $10k - 20k:| Paso Robles: | 6.6% (872) |
| State: | 6.1% (122,966) |
Number of households with income $20k - 30k:| Paso Robles: | 2.2% (292) |
| State: | 6.4% (129,328) |
Number of households with income $30k - 40k:| Paso Robles: | 6.2% (819) |
| State: | 6.4% (130,070) |
Number of households with income $40k - 50k:| Paso Robles: | 13.4% (1,760) |
| State: | 6.5% (131,254) |
Number of households with income $50k - 60k:| Paso Robles: | 1.0% (129) |
| State: | 6.5% (132,382) |
Number of households with income $60k - 75k:| Paso Robles: | 13.8% (1,810) |
| State: | 9.4% (191,472) |
Number of households with income $75k - 100k:| Paso Robles: | 11.8% (1,553) |
| State: | 13.3% (269,691) |
Number of households with income $100k - 125k:| Paso Robles: | 8.2% (1,075) |
| State: | 10.2% (207,286) |
Number of households with income $125k - 150k:| Paso Robles: | 4.7% (617) |
| California: | 7.8% (158,259) |
Number of households with income $150k - 200k:| Paso Robles: | 17.8% (2,337) |
| California: | 10.3% (209,227) |
Number of households with income > $200k:| Paso Robles: | 12.5% (1,639) |
| State: | 13.0% (263,210) |
Aggregate household income in Paso Robles in 2022: $270,541,830
Median family income in Paso Robles in 2022:| Paso Robles: | $103,771 |
| State: | $87,642 |
Number of families with income < $10k:| Paso Robles: | 7.1% (114) |
| State: | 3.2% (48,017) |
Number of families with income $10k - 20k:| Paso Robles: | 1.6% (26) |
| State: | 4.1% (60,419) |
Number of families with income $20k - 30k:| Paso Robles: | 12.0% (194) |
| State: | 6.1% (89,742) |
Number of families with income $30k - 40k:| Paso Robles: | 10.6% (172) |
| California: | 6.2% (91,415) |
Number of families with income $40k - 50k:| Paso Robles: | 8.1% (130) |
| State: | 6.8% (100,085) |
Number of families with income $50k - 60k:| Paso Robles: | 8.7% (140) |
| California: | 6.7% (98,298) |
Number of families with income $60k - 75k:| Paso Robles: | 11.8% (191) |
| California: | 9.5% (140,131) |
Number of families with income $75k - 100k:| Paso Robles: | 18.0% (292) |
| California: | 13.8% (203,439) |
Number of families with income $150k - 200k:| Paso Robles: | 9.3% (150) |
| State: | 10.9% (161,643) |
Number of families with income > $200k:| Paso Robles: | 12.8% (207) |
| State: | 14.0% (207,317) |
Median non-family income in Paso Robles in 2022:| Paso Robles: | $93,115 |
| California: | $56,558 |
Median per capita income in Paso Robles in 2022:| Paso Robles: | $36,751 |
| California: | $32,124 |
Change in median per capita income between 2000 and 2022:| Paso Robles, California: | +123.0% |
| California: | +120.4% |
Income statistics for other residents
Number of households with income < $10k:| Paso Robles: | 0.6% (10) |
| State: | 4.6% (93,035) |
Number of households with income $10k - 20k:| Paso Robles: | 9.5% (155) |
| California: | 6.3% (126,222) |
Number of households with income $20k - 30k:| Paso Robles: | 6.4% (104) |
| State: | 7.1% (142,656) |
Number of households with income $30k - 40k:| Paso Robles: | 2.8% (45) |
| California: | 8.2% (165,018) |
Number of households with income $40k - 50k:| Paso Robles: | 20.8% (338) |
| California: | 8.0% (161,732) |
Number of households with income $50k - 60k:| Paso Robles: | 4.9% (79) |
| California: | 7.6% (152,152) |
Number of households with income $60k - 75k:| Paso Robles: | 6.3% (103) |
| State: | 10.4% (209,951) |
Number of households with income $75k - 100k:| Paso Robles: | 8.8% (144) |
| California: | 14.7% (296,102) |
Number of households with income $100k - 125k:| Paso Robles: | 10.8% (176) |
| State: | 10.7% (214,281) |
Number of households with income $125k - 150k:| Paso Robles: | 10.6% (173) |
| California: | 7.1% (143,092) |
Number of households with income $150k - 200k:| Paso Robles: | 10.6% (173) |
| State: | 8.6% (172,215) |
Number of households with income > $200k:| Paso Robles: | 7.9% (128) |
| California: | 6.7% (134,102) |
Aggregate household income in Paso Robles in 2022: $152,763,514
Median family income in Paso Robles in 2022:| Paso Robles: | $68,977 |
| State: | $72,756 |
Number of families with income < $10k:| Paso Robles: | 6.0% (56) |
| California: | 4.3% (69,090) |
Number of families with income $10k - 20k:| Paso Robles: | 12.1% (111) |
| State: | 5.1% (82,116) |
Number of families with income $20k - 30k:| Paso Robles: | 17.4% (160) |
| State: | 7.0% (112,854) |
Number of families with income $30k - 40k:| Paso Robles: | 7.2% (67) |
| California: | 8.4% (135,938) |
Number of families with income $40k - 50k:| Paso Robles: | 11.1% (102) |
| California: | 8.4% (135,353) |
Number of families with income $50k - 60k:| Paso Robles: | 5.3% (48) |
| California: | 7.7% (124,826) |
Number of families with income $60k - 75k:| Paso Robles: | 10.5% (97) |
| State: | 10.7% (173,628) |
Number of families with income $75k - 100k:| Paso Robles: | 19.1% (176) |
| State: | 15.2% (245,724) |
Number of families with income $100k - 125k:| Paso Robles: | 4.4% (41) |
| California: | 10.9% (176,716) |
Number of families with income > $200k:| Paso Robles: | 6.9% (64) |
| State: | 6.6% (106,346) |
Median non-family income in Paso Robles in 2022:| Paso Robles: | $57,123 |
| State: | $43,881 |
Change in median non-family income between 2000 and 2022:| Paso Robles, California: | +140.5% |
| State: | +84.6% |
Median per capita income in Paso Robles in 2022:| Paso Robles: | $24,967 |
| State: | $25,164 |
Change in median per capita income between 2000 and 2022:| Paso Robles, California: | +139.6% |
| State: | +137.9% |