Southeast Montgomery, Texas (TX) income map, earnings map, and wages data
The median household income in Southeast Montgomery, TX in 2022 was $93,935, which was 23.0% greater than the median annual income of $72,284 across the entire state of Texas. Compared to the median income of $50,309 in 2000 this represents an increase of 46.4%. The per capita income in 2022 was $48,175, which means an increase of 49.1% compared to 2000 when it was $24,544.
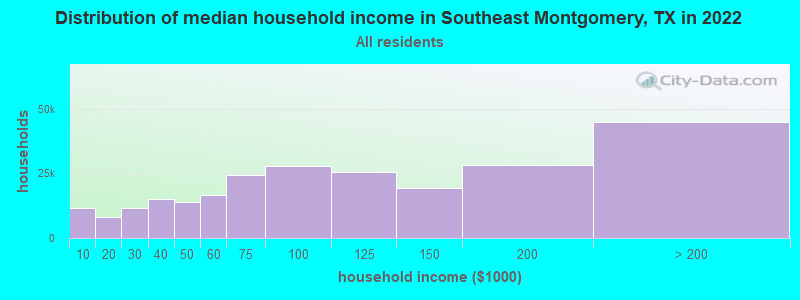
Income statistics for all residents
Median household income in Southeast Montgomery, TX in 2022:| Southeast Montgomery: | $93,936 |
| Texas: | $72,284 |
Change in median household income between 2000 and 2022:| Southeast Montgomery, Texas: | +86.7% |
| Texas: | +81.0% |
Number of households with income < $10k:| Southeast Montgomery: | 4.7% (11,505) |
| State: | 5.5% (611,011) |
Number of households with income $10k - 20k:| Southeast Montgomery: | 3.3% (8,146) |
| State: | 6.7% (743,157) |
Number of households with income $20k - 30k:| Southeast Montgomery: | 4.8% (11,727) |
| Texas: | 7.2% (803,381) |
Number of households with income $30k - 40k:| Southeast Montgomery: | 6.1% (14,966) |
| Texas: | 7.8% (866,080) |
Number of households with income $40k - 50k:| Southeast Montgomery: | 5.7% (14,026) |
| State: | 7.3% (810,440) |
Number of households with income $50k - 60k:| Southeast Montgomery: | 6.7% (16,658) |
| State: | 7.2% (799,783) |
Number of households with income $60k - 75k:| Southeast Montgomery: | 9.9% (24,337) |
| Texas: | 9.9% (1,095,384) |
Number of households with income $75k - 100k:| Southeast Montgomery: | 11.3% (27,823) |
| State: | 12.8% (1,419,057) |
Number of households with income $100k - 125k:| Southeast Montgomery: | 10.3% (25,390) |
| State: | 9.5% (1,054,577) |
Number of households with income $125k - 150k:| Southeast Montgomery: | 7.8% (19,233) |
| Texas: | 6.7% (741,518) |
Number of households with income $150k - 200k:| Southeast Montgomery: | 11.4% (28,091) |
| State: | 8.7% (961,776) |
Number of households with income > $200k:| Southeast Montgomery: | 18.2% (44,910) |
| State: | 10.7% (1,181,544) |
Aggregate household income in Southeast Montgomery in 2022: $32,477,171,900
Median family income in Southeast Montgomery in 2022:| Southeast Montgomery: | $115,409 |
| State: | $86,267 |
Median non-family income in Southeast Montgomery in 2022:| Southeast Montgomery: | $51,691 |
| Texas: | $45,999 |
Change in median non-family income between 2000 and 2022:| Southeast Montgomery, Texas: | +90.0% |
| State: | +79.5% |
Median per capita income in Southeast Montgomery in 2022:| Southeast Montgomery: | $48,175 |
| State: | $38,123 |
Change in median per capita income between 2000 and 2022:| Southeast Montgomery, Texas: | +96.3% |
| State: | +94.3% |
Income statistics for White residents
Median household income in Southeast Montgomery, TX in 2022:| Southeast Montgomery: | $98,421 |
| State: | $82,032 |
Change in median household income between 2000 and 2022:| Southeast Montgomery, Texas: | +88.8% |
| State: | +91.0% |
Number of households with income < $10k:| Southeast Montgomery: | 4.2% (7,662) |
| State: | 4.7% (273,716) |
Number of households with income $10k - 20k:| Southeast Montgomery: | 3.2% (5,759) |
| State: | 5.5% (322,702) |
Number of households with income $20k - 30k:| Southeast Montgomery: | 4.1% (7,445) |
| Texas: | 6.2% (363,947) |
Number of households with income $30k - 40k:| Southeast Montgomery: | 5.6% (10,059) |
| State: | 6.8% (399,275) |
Number of households with income $40k - 50k:| Southeast Montgomery: | 4.9% (8,925) |
| State: | 6.5% (383,417) |
Number of households with income $50k - 60k:| Southeast Montgomery: | 6.6% (11,894) |
| Texas: | 6.6% (388,535) |
Number of households with income $60k - 75k:| Southeast Montgomery: | 10.0% (18,106) |
| Texas: | 9.7% (566,295) |
Number of households with income $75k - 100k:| Southeast Montgomery: | 11.5% (20,836) |
| State: | 13.0% (760,276) |
Number of households with income $100k - 125k:| Southeast Montgomery: | 9.8% (17,701) |
| State: | 10.2% (597,596) |
Number of households with income $125k - 150k:| Southeast Montgomery: | 7.4% (13,385) |
| State: | 7.4% (436,830) |
Number of households with income $150k - 200k:| Southeast Montgomery: | 11.3% (20,484) |
| State: | 9.9% (583,067) |
Number of households with income > $200k:| Southeast Montgomery: | 21.2% (38,260) |
| State: | 13.5% (792,647) |
Aggregate household income in Southeast Montgomery in 2022: $25,345,400,700
Median family income in Southeast Montgomery in 2022:| Southeast Montgomery: | $124,936 |
| State: | $101,788 |
Number of families with income < $10k:| Southeast Montgomery: | 2.4% (2,211) |
| State: | 2.8% (108,142) |
Number of families with income $10k - 20k:| Southeast Montgomery: | 1.8% (1,671) |
| State: | 2.9% (113,421) |
Number of families with income $20k - 30k:| Southeast Montgomery: | 2.6% (2,359) |
| Texas: | 4.1% (157,688) |
Number of families with income $30k - 40k:| Southeast Montgomery: | 3.7% (3,434) |
| Texas: | 5.2% (198,847) |
Number of families with income $40k - 50k:| Southeast Montgomery: | 3.2% (2,977) |
| State: | 5.6% (216,490) |
Number of families with income $50k - 60k:| Southeast Montgomery: | 5.0% (4,616) |
| Texas: | 5.7% (220,689) |
Number of families with income $60k - 75k:| Southeast Montgomery: | 7.6% (6,966) |
| Texas: | 9.0% (346,106) |
Number of families with income $75k - 100k:| Southeast Montgomery: | 11.8% (10,869) |
| Texas: | 13.7% (527,363) |
Number of families with income $100k - 125k:| Southeast Montgomery: | 10.2% (9,330) |
| Texas: | 11.6% (448,411) |
Number of families with income $125k - 150k:| Southeast Montgomery: | 9.4% (8,609) |
| State: | 9.2% (355,798) |
Number of families with income $150k - 200k:| Southeast Montgomery: | 14.4% (13,220) |
| Texas: | 12.5% (480,185) |
Number of families with income > $200k:| Southeast Montgomery: | 27.9% (25,651) |
| State: | 17.6% (677,490) |
Median non-family income in Southeast Montgomery in 2022:| Southeast Montgomery: | $53,128 |
| Texas: | $50,587 |
Change in median non-family income between 2000 and 2022:| Southeast Montgomery, Texas: | +92.1% |
| Texas: | +87.7% |
Median per capita income in Southeast Montgomery in 2022:| Southeast Montgomery: | $53,979 |
| State: | $47,740 |
Change in median per capita income between 2000 and 2022:| Southeast Montgomery, Texas: | +108.8% |
| State: | +114.3% |
Income statistics for Black or African American residents
Median household income in Southeast Montgomery, TX in 2022:| Southeast Montgomery: | $63,270 |
| State: | $55,759 |
Number of households with income < $10k:| Southeast Montgomery: | 10.6% (1,651) |
| State: | 8.9% (126,378) |
Number of households with income $10k - 20k:| Southeast Montgomery: | 5.8% (896) |
| State: | 9.9% (140,369) |
Number of households with income $20k - 30k:| Southeast Montgomery: | 9.8% (1,516) |
| State: | 8.5% (120,639) |
Number of households with income $30k - 40k:| Southeast Montgomery: | 6.5% (1,003) |
| State: | 9.7% (137,517) |
Number of households with income $40k - 50k:| Southeast Montgomery: | 6.0% (933) |
| Texas: | 8.0% (112,973) |
Number of households with income $50k - 60k:| Southeast Montgomery: | 9.0% (1,398) |
| Texas: | 8.3% (117,156) |
Number of households with income $60k - 75k:| Southeast Montgomery: | 8.0% (1,247) |
| State: | 10.4% (147,462) |
Number of households with income $75k - 100k:| Southeast Montgomery: | 6.8% (1,060) |
| Texas: | 11.5% (162,718) |
Number of households with income $100k - 125k:| Southeast Montgomery: | 8.8% (1,360) |
| State: | 8.2% (115,829) |
Number of households with income $125k - 150k:| Southeast Montgomery: | 7.5% (1,170) |
| Texas: | 4.9% (69,556) |
Number of households with income $150k - 200k:| Southeast Montgomery: | 15.0% (2,330) |
| Texas: | 6.4% (90,701) |
Number of households with income > $200k:| Southeast Montgomery: | 6.3% (974) |
| Texas: | 5.5% (77,988) |
Aggregate household income in Southeast Montgomery in 2022: $1,045,084,145
Median family income in Southeast Montgomery in 2022:| Southeast Montgomery: | $124,918 |
| State: | $69,134 |
Number of families with income < $10k:| Southeast Montgomery: | 5.1% (177) |
| Texas: | 6.8% (55,625) |
Number of families with income $10k - 20k:| Southeast Montgomery: | 5.2% (181) |
| State: | 6.8% (55,300) |
Number of families with income $20k - 30k:| Southeast Montgomery: | 6.6% (231) |
| State: | 7.1% (57,877) |
Number of families with income $30k - 40k:| Southeast Montgomery: | 3.4% (117) |
| Texas: | 8.5% (68,776) |
Number of families with income $40k - 50k:| Southeast Montgomery: | 3.8% (133) |
| Texas: | 7.1% (57,907) |
Number of families with income $50k - 60k:| Southeast Montgomery: | 3.3% (116) |
| State: | 7.3% (59,511) |
Number of families with income $60k - 75k:| Southeast Montgomery: | 6.2% (214) |
| State: | 10.1% (81,994) |
Number of families with income $75k - 100k:| Southeast Montgomery: | 9.6% (335) |
| Texas: | 12.7% (103,723) |
Number of families with income $100k - 125k:| Southeast Montgomery: | 6.1% (213) |
| Texas: | 9.4% (76,609) |
Number of families with income $125k - 150k:| Southeast Montgomery: | 6.7% (232) |
| State: | 6.8% (55,615) |
Number of families with income $150k - 200k:| Southeast Montgomery: | 14.3% (496) |
| State: | 9.4% (76,146) |
Number of families with income > $200k:| Southeast Montgomery: | 29.6% (1,030) |
| State: | 7.9% (64,439) |
Median non-family income in Southeast Montgomery in 2022:| Southeast Montgomery: | $42,444 |
| State: | $40,133 |
Change in median non-family income between 2000 and 2022:| Southeast Montgomery, Texas: | +133.0% |
| State: | +102.2% |
Median per capita income in Southeast Montgomery in 2022:| Southeast Montgomery: | $39,096 |
| State: | $30,490 |
Change in median per capita income between 2000 and 2022:| Southeast Montgomery, Texas: | +134.6% |
| Texas: | +113.9% |
Income statistics for Asian residents
Median household income in Southeast Montgomery, TX in 2022:| Southeast Montgomery: | $108,676 |
| State: | $107,673 |
Change in median household income between 2000 and 2022:| Southeast Montgomery, Texas: | +41.8% |
| Texas: | +115.1% |
Number of households with income < $10k:| Southeast Montgomery: | 3.1% (259) |
| Texas: | 5.2% (29,885) |
Number of households with income $10k - 20k:| Southeast Montgomery: | 0.0% (0) |
| State: | 4.7% (27,044) |
Number of households with income $20k - 30k:| Southeast Montgomery: | 0.9% (78) |
| State: | 4.1% (23,363) |
Number of households with income $30k - 40k:| Southeast Montgomery: | 9.9% (818) |
| State: | 4.1% (23,309) |
Number of households with income $40k - 50k:| Southeast Montgomery: | 3.7% (302) |
| State: | 5.2% (29,826) |
Number of households with income $50k - 60k:| Southeast Montgomery: | 10.1% (833) |
| Texas: | 4.7% (26,512) |
Number of households with income $60k - 75k:| Southeast Montgomery: | 5.2% (431) |
| State: | 6.5% (36,905) |
Number of households with income $75k - 100k:| Southeast Montgomery: | 9.2% (755) |
| State: | 11.3% (64,350) |
Number of households with income $100k - 125k:| Southeast Montgomery: | 20.7% (1,709) |
| State: | 11.4% (64,714) |
Number of households with income $125k - 150k:| Southeast Montgomery: | 14.0% (1,157) |
| Texas: | 9.3% (52,719) |
Number of households with income $150k - 200k:| Southeast Montgomery: | 10.0% (826) |
| State: | 12.5% (70,953) |
Number of households with income > $200k:| Southeast Montgomery: | 13.1% (1,082) |
| State: | 21.1% (120,260) |
Aggregate household income in Southeast Montgomery in 2022: $954,089,962
Median family income in Southeast Montgomery in 2022:| Southeast Montgomery: | $119,099 |
| State: | $123,328 |
Number of families with income < $10k:| Southeast Montgomery: | 0.9% (45) |
| Texas: | 3.1% (13,567) |
Number of families with income $10k - 20k:| Southeast Montgomery: | 0.7% (34) |
| State: | 3.0% (13,043) |
Number of families with income $20k - 30k:| Southeast Montgomery: | 1.2% (60) |
| State: | 3.4% (14,738) |
Number of families with income $30k - 40k:| Southeast Montgomery: | 2.7% (134) |
| State: | 3.4% (15,033) |
Number of families with income $40k - 50k:| Southeast Montgomery: | 2.0% (102) |
| Texas: | 4.9% (21,622) |
Number of families with income $50k - 60k:| Southeast Montgomery: | 2.4% (118) |
| State: | 4.7% (20,568) |
Number of families with income $60k - 75k:| Southeast Montgomery: | 1.0% (51) |
| State: | 6.1% (26,637) |
Number of families with income $75k - 100k:| Southeast Montgomery: | 10.8% (539) |
| State: | 10.7% (46,626) |
Number of families with income $100k - 125k:| Southeast Montgomery: | 5.8% (289) |
| Texas: | 11.3% (49,585) |
Number of families with income $125k - 150k:| Southeast Montgomery: | 15.8% (786) |
| State: | 9.8% (43,043) |
Number of families with income $150k - 200k:| Southeast Montgomery: | 14.6% (728) |
| State: | 14.7% (64,203) |
Number of families with income > $200k:| Southeast Montgomery: | 42.1% (2,100) |
| Texas: | 24.8% (108,511) |
Median non-family income in Southeast Montgomery in 2022:| Southeast Montgomery: | $79,909 |
| State: | $64,320 |
Change in median non-family income between 2000 and 2022:| Southeast Montgomery, Texas: | +142.8% |
| State: | +131.1% |
Median per capita income in Southeast Montgomery in 2022:| Southeast Montgomery: | $43,912 |
| State: | $48,626 |
Change in median per capita income between 2000 and 2022:| Southeast Montgomery, Texas: | +24.3% |
| State: | +132.0% |
Income statistics for Hispanic or Latino residents
Median household income in Southeast Montgomery, TX in 2022:| Southeast Montgomery: | $76,334 |
| State: | $60,504 |
Change in median household income between 2000 and 2022:| Southeast Montgomery, Texas: | +112.9% |
| Texas: | +102.5% |
Number of households with income < $10k:| Southeast Montgomery: | 3.4% (1,695) |
| State: | 5.8% (213,953) |
Number of households with income $10k - 20k:| Southeast Montgomery: | 2.7% (1,322) |
| Texas: | 8.0% (297,456) |
Number of households with income $20k - 30k:| Southeast Montgomery: | 6.6% (3,259) |
| State: | 9.2% (340,166) |
Number of households with income $30k - 40k:| Southeast Montgomery: | 7.6% (3,758) |
| State: | 9.5% (354,336) |
Number of households with income $40k - 50k:| Southeast Montgomery: | 9.1% (4,507) |
| Texas: | 8.8% (327,013) |
Number of households with income $50k - 60k:| Southeast Montgomery: | 7.2% (3,562) |
| State: | 8.3% (308,818) |
Number of households with income $60k - 75k:| Southeast Montgomery: | 11.4% (5,634) |
| State: | 10.9% (405,109) |
Number of households with income $75k - 100k:| Southeast Montgomery: | 15.6% (7,670) |
| State: | 13.8% (511,639) |
Number of households with income $100k - 125k:| Southeast Montgomery: | 10.6% (5,212) |
| State: | 8.6% (319,728) |
Number of households with income $125k - 150k:| Southeast Montgomery: | 8.3% (4,084) |
| Texas: | 5.7% (210,932) |
Number of households with income $150k - 200k:| Southeast Montgomery: | 8.2% (4,063) |
| State: | 6.4% (236,055) |
Number of households with income > $200k:| Southeast Montgomery: | 9.2% (4,547) |
| State: | 5.1% (189,259) |
Aggregate household income in Southeast Montgomery in 2022: $4,138,111,767
Median family income in Southeast Montgomery in 2022:| Southeast Montgomery: | $75,755 |
| State: | $65,080 |
Number of families with income < $10k:| Southeast Montgomery: | 3.7% (1,093) |
| Texas: | 5.3% (147,493) |
Number of families with income $10k - 20k:| Southeast Montgomery: | 3.7% (1,081) |
| Texas: | 6.3% (174,531) |
Number of families with income $20k - 30k:| Southeast Montgomery: | 4.9% (1,446) |
| Texas: | 8.6% (238,528) |
Number of families with income $30k - 40k:| Southeast Montgomery: | 8.1% (2,388) |
| State: | 9.1% (251,999) |
Number of families with income $40k - 50k:| Southeast Montgomery: | 7.4% (2,181) |
| State: | 8.6% (240,188) |
Number of families with income $50k - 60k:| Southeast Montgomery: | 7.3% (2,158) |
| State: | 8.0% (223,566) |
Number of families with income $60k - 75k:| Southeast Montgomery: | 10.9% (3,226) |
| State: | 10.9% (302,688) |
Number of families with income $75k - 100k:| Southeast Montgomery: | 16.2% (4,786) |
| State: | 14.3% (398,554) |
Number of families with income $100k - 125k:| Southeast Montgomery: | 10.3% (3,049) |
| State: | 9.5% (264,007) |
Number of families with income $125k - 150k:| Southeast Montgomery: | 8.0% (2,372) |
| Texas: | 6.2% (171,274) |
Number of families with income $150k - 200k:| Southeast Montgomery: | 8.5% (2,518) |
| Texas: | 7.3% (202,259) |
Number of families with income > $200k:| Southeast Montgomery: | 11.1% (3,281) |
| State: | 5.9% (165,129) |
Median non-family income in Southeast Montgomery in 2022:| Southeast Montgomery: | $55,936 |
| State: | $39,934 |
Change in median non-family income between 2000 and 2022:| Southeast Montgomery, Texas: | +96.1% |
| Texas: | +109.1% |
Median per capita income in Southeast Montgomery in 2022:| Southeast Montgomery: | $29,761 |
| State: | $24,862 |
Change in median per capita income between 2000 and 2022:| Southeast Montgomery, Texas: | +126.0% |
| State: | +130.8% |
Income statistics for American Indian and Alaska Native residents
Median household income in Southeast Montgomery, TX in 2022:| Southeast Montgomery: | $105,508 |
| State: | $65,765 |
Change in median household income between 2000 and 2022:| Southeast Montgomery, Texas: | +136.9% |
| State: | +88.3% |
Number of households with income < $10k:| Southeast Montgomery: | 4.1% (2,171) |
| State: | 4.1% (3,398) |
Number of households with income $10k - 20k:| Southeast Montgomery: | 8.3% (4,438) |
| State: | 8.3% (6,949) |
Number of households with income $20k - 30k:| Southeast Montgomery: | 9.3% (4,946) |
| State: | 9.3% (7,742) |
Number of households with income $30k - 40k:| Southeast Montgomery: | 9.1% (4,866) |
| Texas: | 9.1% (7,627) |
Number of households with income $40k - 50k:| Southeast Montgomery: | 7.1% (3,786) |
| Texas: | 7.1% (5,922) |
Number of households with income $50k - 60k:| Southeast Montgomery: | 8.1% (4,320) |
| Texas: | 8.1% (6,761) |
Number of households with income $60k - 75k:| Southeast Montgomery: | 12.7% (6,760) |
| Texas: | 12.7% (10,588) |
Number of households with income $75k - 100k:| Southeast Montgomery: | 13.0% (6,966) |
| State: | 13.0% (10,903) |
Number of households with income $100k - 125k:| Southeast Montgomery: | 9.9% (5,274) |
| Texas: | 9.9% (8,256) |
Number of households with income $125k - 150k:| Southeast Montgomery: | 5.2% (2,780) |
| State: | 5.2% (4,355) |
Number of households with income $150k - 200k:| Southeast Montgomery: | 6.7% (3,588) |
| State: | 6.7% (5,623) |
Number of households with income > $200k:| Southeast Montgomery: | 6.6% (3,522) |
| State: | 6.6% (5,522) |
Aggregate household income in Southeast Montgomery in 2022: $82,057,897
Median family income in Southeast Montgomery in 2022:| Southeast Montgomery: | $100,768 |
| State: | $72,369 |
Number of families with income < $10k:| Southeast Montgomery: | 1.2% (6) |
| State: | 2.7% (1,671) |
Number of families with income $10k - 20k:| Southeast Montgomery: | 5.9% (28) |
| Texas: | 8.0% (4,891) |
Number of families with income $20k - 30k:| Southeast Montgomery: | 6.6% (31) |
| State: | 7.3% (4,502) |
Number of families with income $30k - 40k:| Southeast Montgomery: | 11.0% (52) |
| Texas: | 7.5% (4,592) |
Number of families with income $40k - 50k:| Southeast Montgomery: | 12.0% (57) |
| Texas: | 7.9% (4,855) |
Number of families with income $50k - 60k:| Southeast Montgomery: | 8.0% (38) |
| State: | 7.1% (4,347) |
Number of families with income $60k - 75k:| Southeast Montgomery: | 14.1% (67) |
| Texas: | 12.1% (7,429) |
Number of families with income $75k - 100k:| Southeast Montgomery: | 28.0% (133) |
| Texas: | 14.4% (8,852) |
Number of families with income $100k - 125k:| Southeast Montgomery: | 13.1% (62) |
| Texas: | 11.4% (6,997) |
Median per capita income in Southeast Montgomery in 2022:| Southeast Montgomery: | $25,757 |
| State: | $28,166 |
Change in median per capita income between 2000 and 2022:| Southeast Montgomery, Texas: | +58.0% |
| State: | +77.2% |
Income statistics for Multirace residents
Median household income in Southeast Montgomery, TX in 2022:| Southeast Montgomery: | $80,221 |
| State: | $62,748 |
Change in median household income between 2000 and 2022:| Southeast Montgomery, Texas: | +93.2% |
| State: | +92.3% |
Number of households with income < $10k:| Southeast Montgomery: | 4.6% (1,556) |
| Texas: | 5.5% (122,324) |
Number of households with income $10k - 20k:| Southeast Montgomery: | 3.4% (1,134) |
| State: | 8.2% (182,232) |
Number of households with income $20k - 30k:| Southeast Montgomery: | 7.3% (2,464) |
| State: | 8.5% (189,456) |
Number of households with income $30k - 40k:| Southeast Montgomery: | 8.0% (2,676) |
| State: | 8.9% (197,499) |
Number of households with income $40k - 50k:| Southeast Montgomery: | 8.0% (2,685) |
| State: | 8.7% (191,735) |
Number of households with income $50k - 60k:| Southeast Montgomery: | 6.0% (2,002) |
| Texas: | 8.0% (177,535) |
Number of households with income $60k - 75k:| Southeast Montgomery: | 10.7% (3,594) |
| State: | 10.5% (232,479) |
Number of households with income $75k - 100k:| Southeast Montgomery: | 13.1% (4,379) |
| State: | 13.1% (290,448) |
Number of households with income $100k - 125k:| Southeast Montgomery: | 10.0% (3,347) |
| State: | 8.6% (191,595) |
Number of households with income $125k - 150k:| Southeast Montgomery: | 8.1% (2,712) |
| State: | 6.0% (133,361) |
Number of households with income $150k - 200k:| Southeast Montgomery: | 10.8% (3,614) |
| Texas: | 7.2% (159,195) |
Number of households with income > $200k:| Southeast Montgomery: | 10.1% (3,385) |
| State: | 6.7% (148,064) |
Aggregate household income in Southeast Montgomery in 2022: $2,725,215,879
Median family income in Southeast Montgomery in 2022:| Southeast Montgomery: | $83,445 |
| Texas: | $69,780 |
Number of families with income < $10k:| Southeast Montgomery: | 3.4% (572) |
| Texas: | 4.4% (70,825) |
Number of families with income $10k - 20k:| Southeast Montgomery: | 3.2% (523) |
| State: | 5.9% (95,279) |
Number of families with income $20k - 30k:| Southeast Montgomery: | 6.8% (1,133) |
| State: | 7.8% (126,627) |
Number of families with income $30k - 40k:| Southeast Montgomery: | 8.8% (1,463) |
| State: | 8.5% (137,626) |
Number of families with income $40k - 50k:| Southeast Montgomery: | 5.1% (842) |
| Texas: | 8.4% (135,809) |
Number of families with income $50k - 60k:| Southeast Montgomery: | 9.5% (1,582) |
| State: | 7.9% (127,739) |
Number of families with income $60k - 75k:| Southeast Montgomery: | 9.1% (1,518) |
| State: | 10.5% (169,549) |
Number of families with income $75k - 100k:| Southeast Montgomery: | 18.3% (3,034) |
| Texas: | 14.0% (226,284) |
Number of families with income $100k - 125k:| Southeast Montgomery: | 12.9% (2,133) |
| State: | 9.5% (153,597) |
Number of families with income $150k - 200k:| Southeast Montgomery: | 9.5% (1,568) |
| Texas: | 8.5% (137,607) |
Number of families with income > $200k:| Southeast Montgomery: | 13.4% (2,224) |
| Texas: | 7.9% (127,299) |
Median non-family income in Southeast Montgomery in 2022:| Southeast Montgomery: | $52,299 |
| State: | $40,634 |
Change in median non-family income between 2000 and 2022:| Southeast Montgomery, Texas: | +84.9% |
| State: | +77.2% |
Median per capita income in Southeast Montgomery in 2022:| Southeast Montgomery: | $33,881 |
| State: | $26,785 |
Income statistics for other residents
Number of households with income < $10k:| Southeast Montgomery: | 5.1% (370) |
| State: | 5.9% (54,162) |
Number of households with income $10k - 20k:| Southeast Montgomery: | 2.6% (191) |
| Texas: | 6.8% (62,891) |
Number of households with income $20k - 30k:| Southeast Montgomery: | 3.5% (254) |
| State: | 10.6% (97,294) |
Number of households with income $30k - 40k:| Southeast Montgomery: | 4.0% (288) |
| State: | 10.8% (99,670) |
Number of households with income $40k - 50k:| Southeast Montgomery: | 14.0% (1,015) |
| State: | 9.3% (85,548) |
Number of households with income $50k - 60k:| Southeast Montgomery: | 7.1% (513) |
| Texas: | 9.0% (82,757) |
Number of households with income $60k - 75k:| Southeast Montgomery: | 12.1% (874) |
| Texas: | 10.9% (100,326) |
Number of households with income $75k - 100k:| Southeast Montgomery: | 10.3% (744) |
| State: | 14.0% (128,767) |
Number of households with income $100k - 125k:| Southeast Montgomery: | 5.1% (369) |
| Texas: | 8.2% (75,218) |
Number of households with income $125k - 150k:| Southeast Montgomery: | 10.1% (733) |
| State: | 4.8% (44,223) |
Number of households with income $150k - 200k:| Southeast Montgomery: | 11.2% (810) |
| State: | 5.6% (51,376) |
Number of households with income > $200k:| Southeast Montgomery: | 14.9% (1,079) |
| Texas: | 4.0% (36,393) |
Aggregate household income in Southeast Montgomery in 2022: $835,557,619
Median family income in Southeast Montgomery in 2022:| Southeast Montgomery: | $80,686 |
| Texas: | $60,064 |
Number of families with income < $10k:| Southeast Montgomery: | 7.2% (433) |
| State: | 6.8% (47,502) |
Number of families with income $10k - 20k:| Southeast Montgomery: | 3.5% (209) |
| Texas: | 6.0% (41,763) |
Number of families with income $20k - 30k:| Southeast Montgomery: | 1.7% (101) |
| State: | 9.9% (68,761) |
Number of families with income $30k - 40k:| Southeast Montgomery: | 3.6% (218) |
| State: | 9.7% (67,685) |
Number of families with income $40k - 50k:| Southeast Montgomery: | 16.2% (972) |
| Texas: | 9.0% (62,441) |
Number of families with income $50k - 60k:| Southeast Montgomery: | 6.8% (406) |
| State: | 8.5% (59,321) |
Number of families with income $60k - 75k:| Southeast Montgomery: | 7.5% (451) |
| Texas: | 11.2% (77,588) |
Number of families with income $75k - 100k:| Southeast Montgomery: | 10.3% (622) |
| State: | 14.5% (101,032) |
Number of families with income $100k - 125k:| Southeast Montgomery: | 3.9% (237) |
| Texas: | 8.8% (61,439) |
Number of families with income $125k - 150k:| Southeast Montgomery: | 10.1% (604) |
| State: | 5.1% (35,727) |
Number of families with income $150k - 200k:| Southeast Montgomery: | 9.6% (575) |
| State: | 5.9% (41,211) |
Number of families with income > $200k:| Southeast Montgomery: | 19.7% (1,183) |
| State: | 4.5% (31,243) |
Median non-family income in Southeast Montgomery in 2022:| Southeast Montgomery: | $51,085 |
| Texas: | $38,690 |
Change in median non-family income between 2000 and 2022:| Southeast Montgomery, Texas: | +70.1% |
| Texas: | +90.2% |
Median per capita income in Southeast Montgomery in 2022:| Southeast Montgomery: | $38,909 |
| State: | $23,899 |