Suffield, Connecticut (CT) income map, earnings map, and wages data
The median household income in Suffield, CT in 2022 was $112,862, which was 21.6% greater than the median annual income of $88,429 across the entire state of Connecticut. Compared to the median income of $66,698 in 2000 this represents an increase of 40.9%. The per capita income in 2022 was $51,533, which means an increase of 45.3% compared to 2000 when it was $28,171.
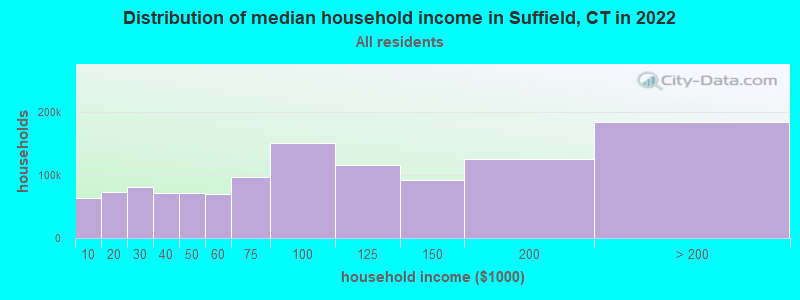
Income statistics for all residents
Median household income in Suffield, CT in 2022:| Suffield: | $112,862 |
| Connecticut: | $88,429 |
Change in median household income between 2000 and 2022:| Suffield, Connecticut: | +69.2% |
| Connecticut: | +64.0% |
Number of households with income < $10k:| Suffield: | 5.2% (45,971) |
| State: | 5.1% (72,746) |
Number of households with income $10k - 20k:| Suffield: | 5.8% (51,838) |
| Connecticut: | 5.7% (81,643) |
Number of households with income $20k - 30k:| Suffield: | 6.6% (58,677) |
| Connecticut: | 6.5% (92,844) |
Number of households with income $30k - 40k:| Suffield: | 5.9% (52,658) |
| State: | 5.9% (83,934) |
Number of households with income $40k - 50k:| Suffield: | 5.9% (52,321) |
| State: | 5.8% (83,025) |
Number of households with income $50k - 60k:| Suffield: | 5.8% (51,304) |
| State: | 5.7% (81,788) |
Number of households with income $60k - 75k:| Suffield: | 8.1% (71,883) |
| State: | 8.1% (115,651) |
Number of households with income $75k - 100k:| Suffield: | 12.6% (112,266) |
| Connecticut: | 12.6% (180,173) |
Number of households with income $100k - 125k:| Suffield: | 9.8% (87,398) |
| State: | 9.9% (141,231) |
Number of households with income $125k - 150k:| Suffield: | 7.8% (69,795) |
| Connecticut: | 7.9% (112,826) |
Number of households with income $150k - 200k:| Suffield: | 10.7% (95,475) |
| State: | 10.8% (154,641) |
Number of households with income > $200k:| Suffield: | 16.0% (142,633) |
| Connecticut: | 16.3% (233,133) |
Aggregate household income in Suffield in 2022: $15,476,370,971
Median family income in Suffield in 2022:| Suffield: | $141,431 |
| Connecticut: | $115,183 |
Median non-family income in Suffield in 2022:| Suffield: | $51,668 |
| Connecticut: | $50,964 |
Change in median non-family income between 2000 and 2022:| Suffield, Connecticut: | +71.5% |
| State: | +65.1% |
Median per capita income in Suffield in 2022:| Suffield: | $51,533 |
| State: | $51,581 |
Change in median per capita income between 2000 and 2022:| Suffield, Connecticut: | +82.9% |
| State: | +79.3% |
Income statistics for White residents
Median household income in Suffield, CT in 2022:| Suffield: | $113,306 |
| State: | $96,890 |
Change in median household income between 2000 and 2022:| Suffield, Connecticut: | +69.4% |
| State: | +68.5% |
Number of households with income < $10k:| Suffield: | 4.2% (24,782) |
| State: | 4.2% (42,265) |
Number of households with income $10k - 20k:| Suffield: | 4.9% (28,493) |
| State: | 4.8% (48,323) |
Number of households with income $20k - 30k:| Suffield: | 5.8% (33,885) |
| State: | 5.7% (57,716) |
Number of households with income $30k - 40k:| Suffield: | 5.4% (31,366) |
| State: | 5.3% (53,827) |
Number of households with income $40k - 50k:| Suffield: | 5.3% (31,236) |
| Connecticut: | 5.3% (53,301) |
Number of households with income $50k - 60k:| Suffield: | 5.6% (32,507) |
| Connecticut: | 5.5% (55,690) |
Number of households with income $60k - 75k:| Suffield: | 7.9% (46,454) |
| State: | 8.0% (80,329) |
Number of households with income $75k - 100k:| Suffield: | 12.7% (74,437) |
| Connecticut: | 12.7% (128,070) |
Number of households with income $100k - 125k:| Suffield: | 10.0% (58,451) |
| State: | 10.0% (101,210) |
Number of households with income $125k - 150k:| Suffield: | 8.0% (46,926) |
| Connecticut: | 8.0% (81,250) |
Number of households with income $150k - 200k:| Suffield: | 11.8% (69,000) |
| Connecticut: | 11.8% (119,527) |
Number of households with income > $200k:| Suffield: | 18.4% (108,017) |
| State: | 18.6% (187,875) |
Aggregate household income in Suffield in 2022: $11,377,042,636
Median family income in Suffield in 2022:| Suffield: | $146,140 |
| State: | $128,955 |
Number of families with income < $10k:| Suffield: | 1.5% (44) |
| State: | 1.9% (11,537) |
Number of families with income $10k - 20k:| Suffield: | 1.2% (37) |
| Connecticut: | 1.8% (11,289) |
Number of families with income $20k - 30k:| Suffield: | 2.2% (67) |
| Connecticut: | 3.0% (18,506) |
Number of families with income $30k - 40k:| Suffield: | 2.4% (71) |
| State: | 2.9% (18,160) |
Number of families with income $40k - 50k:| Suffield: | 2.5% (75) |
| State: | 3.9% (24,550) |
Number of families with income $50k - 60k:| Suffield: | 3.9% (116) |
| Connecticut: | 4.3% (26,723) |
Number of families with income $60k - 75k:| Suffield: | 7.5% (225) |
| State: | 7.1% (44,075) |
Number of families with income $75k - 100k:| Suffield: | 15.1% (453) |
| Connecticut: | 12.5% (77,679) |
Number of families with income $100k - 125k:| Suffield: | 14.0% (421) |
| Connecticut: | 11.1% (69,086) |
Number of families with income $125k - 150k:| Suffield: | 11.7% (352) |
| State: | 9.6% (59,616) |
Number of families with income $150k - 200k:| Suffield: | 17.3% (521) |
| State: | 15.7% (97,890) |
Number of families with income > $200k:| Suffield: | 20.9% (628) |
| State: | 26.3% (163,417) |
Median non-family income in Suffield in 2022:| Suffield: | $52,141 |
| State: | $54,067 |
Change in median non-family income between 2000 and 2022:| Suffield, Connecticut: | +73.7% |
| State: | +68.7% |
Median per capita income in Suffield in 2022:| Suffield: | $57,050 |
| State: | $59,916 |
Change in median per capita income between 2000 and 2022:| Suffield, Connecticut: | +92.1% |
| State: | +90.2% |
Income statistics for Black or African American residents
Median household income in Suffield, CT in 2022:| Suffield: | $68,989 |
| State: | $61,803 |
Change in median household income between 2000 and 2022:| Suffield, Connecticut: | +60.9% |
| State: | +76.1% |
Number of households with income < $10k:| Suffield: | 6.8% (11,596) |
| Connecticut: | 6.8% (9,494) |
Number of households with income $10k - 20k:| Suffield: | 7.9% (13,439) |
| Connecticut: | 7.9% (11,003) |
Number of households with income $20k - 30k:| Suffield: | 10.8% (18,376) |
| State: | 10.8% (15,045) |
Number of households with income $30k - 40k:| Suffield: | 8.2% (14,047) |
| State: | 8.2% (11,501) |
Number of households with income $40k - 50k:| Suffield: | 7.4% (12,722) |
| State: | 7.4% (10,416) |
Number of households with income $50k - 60k:| Suffield: | 7.5% (12,866) |
| Connecticut: | 7.5% (10,534) |
Number of households with income $60k - 75k:| Suffield: | 8.0% (13,733) |
| State: | 8.0% (11,244) |
Number of households with income $75k - 100k:| Suffield: | 9.6% (16,330) |
| State: | 9.6% (13,370) |
Number of households with income $100k - 125k:| Suffield: | 10.2% (17,397) |
| State: | 10.2% (14,244) |
Number of households with income $125k - 150k:| Suffield: | 8.0% (13,736) |
| State: | 8.0% (11,246) |
Number of households with income $150k - 200k:| Suffield: | 7.7% (13,102) |
| State: | 7.7% (10,727) |
Number of households with income > $200k:| Suffield: | 7.9% (13,540) |
| State: | 7.9% (11,086) |
Aggregate household income in Suffield in 2022: $13,885,505
Median family income in Suffield in 2022:| Suffield: | $100,387 |
| State: | $87,228 |
Number of families with income $20k - 30k:| Suffield: | 10.4% (4) |
| State: | 6.0% (5,015) |
Number of families with income $40k - 50k:| Suffield: | 47.9% (17) |
| State: | 6.6% (5,531) |
Number of families with income $50k - 60k:| Suffield: | 18.4% (7) |
| State: | 5.4% (4,480) |
Number of families with income $75k - 100k:| Suffield: | 23.4% (9) |
| State: | 12.7% (10,598) |
Median non-family income in Suffield in 2022:| Suffield: | $25,742 |
| Connecticut: | $38,608 |
Change in median non-family income between 2000 and 2022:| Suffield, Connecticut: | +77.0% |
| State: | +77.0% |
Median per capita income in Suffield in 2022:| Suffield: | $31,524 |
| State: | $36,289 |
Change in median per capita income between 2000 and 2022:| Suffield, Connecticut: | +115.2% |
| State: | +117.5% |
Income statistics for Asian residents
Median household income in Suffield, CT in 2022:| Suffield: | $420,177 |
| State: | $110,568 |
Change in median household income between 2000 and 2022:| Suffield, Connecticut: | +110.1% |
| Connecticut: | +79.5% |
Number of households with income < $10k:| Suffield: | 7.1% (13,785) |
| State: | 7.1% (4,245) |
Number of households with income $10k - 20k:| Suffield: | 3.5% (6,777) |
| State: | 3.5% (2,087) |
Number of households with income $20k - 30k:| Suffield: | 4.1% (8,001) |
| State: | 4.1% (2,464) |
Number of households with income $30k - 40k:| Suffield: | 4.1% (8,047) |
| State: | 4.1% (2,478) |
Number of households with income $40k - 50k:| Suffield: | 3.3% (6,440) |
| Connecticut: | 3.3% (1,983) |
Number of households with income $50k - 60k:| Suffield: | 3.9% (7,560) |
| State: | 3.9% (2,328) |
Number of households with income $60k - 75k:| Suffield: | 7.0% (13,730) |
| State: | 7.0% (4,228) |
Number of households with income $75k - 100k:| Suffield: | 11.5% (22,443) |
| State: | 11.5% (6,911) |
Number of households with income $100k - 125k:| Suffield: | 10.2% (19,897) |
| State: | 10.2% (6,127) |
Number of households with income $125k - 150k:| Suffield: | 8.5% (16,494) |
| Connecticut: | 8.5% (5,079) |
Number of households with income $150k - 200k:| Suffield: | 12.4% (24,142) |
| Connecticut: | 12.4% (7,434) |
Number of households with income > $200k:| Suffield: | 24.4% (47,611) |
| State: | 24.4% (14,661) |
Aggregate household income in Suffield in 2022: $13,287,939
Median family income in Suffield in 2022:| Suffield: | $415,624 |
| Connecticut: | $134,548 |
Number of families with income $125k - 150k:| Suffield: | 18.1% (16) |
| Connecticut: | 8.2% (3,588) |
Number of families with income > $200k:| Suffield: | 81.9% (72) |
| State: | 30.8% (13,522) |
Median per capita income in Suffield in 2022:| Suffield: | $79,223 |
| Connecticut: | $55,295 |
Change in median per capita income between 2000 and 2022:| Suffield, Connecticut: | +103.6% |
| Connecticut: | +97.8% |
Income statistics for Hispanic or Latino residents
Median household income in Suffield, CT in 2022:| Suffield: | $158,097 |
| State: | $60,275 |
Change in median household income between 2000 and 2022:| Suffield, Connecticut: | +67.8% |
| State: | +87.9% |
Number of households with income < $10k:| Suffield: | 8.7% (54,591) |
| State: | 8.7% (18,584) |
Number of households with income $10k - 20k:| Suffield: | 9.1% (56,504) |
| Connecticut: | 9.1% (19,235) |
Number of households with income $20k - 30k:| Suffield: | 8.9% (55,780) |
| Connecticut: | 8.9% (18,989) |
Number of households with income $30k - 40k:| Suffield: | 7.5% (46,904) |
| State: | 7.5% (15,967) |
Number of households with income $40k - 50k:| Suffield: | 8.7% (54,244) |
| State: | 8.7% (18,466) |
Number of households with income $50k - 60k:| Suffield: | 6.9% (43,199) |
| State: | 6.9% (14,706) |
Number of households with income $60k - 75k:| Suffield: | 8.9% (55,484) |
| Connecticut: | 8.9% (18,888) |
Number of households with income $75k - 100k:| Suffield: | 13.5% (84,216) |
| State: | 13.5% (28,669) |
Number of households with income $100k - 125k:| Suffield: | 8.2% (51,213) |
| Connecticut: | 8.2% (17,434) |
Number of households with income $125k - 150k:| Suffield: | 6.5% (40,397) |
| State: | 6.5% (13,752) |
Number of households with income $150k - 200k:| Suffield: | 6.6% (41,460) |
| State: | 6.6% (14,114) |
Number of households with income > $200k:| Suffield: | 6.4% (40,038) |
| State: | 6.4% (13,630) |
Aggregate household income in Suffield in 2022: $23,360,030
Median family income in Suffield in 2022:| Suffield: | $172,083 |
| State: | $68,336 |
Number of families with income < $10k:| Suffield: | 3.5% (22) |
| State: | 5.2% (7,456) |
Number of families with income $10k - 20k:| Suffield: | 4.8% (30) |
| Connecticut: | 6.0% (8,616) |
Number of families with income $20k - 30k:| Suffield: | 8.0% (51) |
| State: | 8.9% (12,680) |
Number of families with income $30k - 40k:| Suffield: | 6.3% (40) |
| State: | 8.5% (12,090) |
Number of families with income $40k - 50k:| Suffield: | 6.2% (39) |
| State: | 8.8% (12,624) |
Number of families with income $50k - 60k:| Suffield: | 8.6% (54) |
| Connecticut: | 8.4% (11,924) |
Number of families with income $60k - 75k:| Suffield: | 9.6% (61) |
| Connecticut: | 8.9% (12,677) |
Number of families with income $75k - 100k:| Suffield: | 18.7% (118) |
| Connecticut: | 14.3% (20,457) |
Number of families with income $100k - 125k:| Suffield: | 10.3% (65) |
| State: | 8.2% (11,720) |
Number of families with income $125k - 150k:| Suffield: | 10.5% (67) |
| Connecticut: | 8.2% (11,729) |
Number of families with income $150k - 200k:| Suffield: | 7.8% (49) |
| State: | 7.1% (10,096) |
Number of families with income > $200k:| Suffield: | 5.6% (35) |
| State: | 7.4% (10,622) |
Median non-family income in Suffield in 2022:| Suffield: | $113,336 |
| State: | $36,714 |
Change in median non-family income between 2000 and 2022:| Suffield, Connecticut: | +73.9% |
| State: | +90.0% |
Median per capita income in Suffield in 2022:| Suffield: | $14,910 |
| Connecticut: | $28,507 |
Change in median per capita income between 2000 and 2022:| Suffield, Connecticut: | +80.3% |
| Connecticut: | +117.2% |
Income statistics for American Indian and Alaska Native residents
Median household income in Suffield, CT in 2022:| Suffield: | $197,513 |
| State: | $41,848 |
Change in median household income between 2000 and 2022:| Suffield, Connecticut: | +12.9% |
| State: | +12.9% |
Number of households with income < $10k:| Suffield: | 8.4% (497,622) |
| State: | 10.2% (340) |
Number of households with income $10k - 20k:| Suffield: | 9.4% (555,334) |
| Connecticut: | 8.5% (283) |
Number of households with income $20k - 30k:| Suffield: | 8.5% (502,306) |
| State: | 9.4% (314) |
Number of households with income $30k - 40k:| Suffield: | 9.1% (538,159) |
| State: | 10.1% (337) |
Number of households with income $40k - 50k:| Suffield: | 8.3% (493,636) |
| State: | 13.4% (447) |
Number of households with income $50k - 60k:| Suffield: | 7.8% (465,458) |
| Connecticut: | 3.1% (104) |
Number of households with income $60k - 75k:| Suffield: | 9.8% (580,173) |
| Connecticut: | 5.6% (188) |
Number of households with income $75k - 100k:| Suffield: | 12.6% (748,910) |
| State: | 13.4% (447) |
Number of households with income $100k - 125k:| Suffield: | 9.4% (560,035) |
| State: | 9.5% (317) |
Number of households with income $125k - 150k:| Suffield: | 5.6% (335,290) |
| State: | 3.9% (131) |
Number of households with income $150k - 200k:| Suffield: | 6.0% (353,460) |
| State: | 6.3% (212) |
Number of households with income > $200k:| Suffield: | 5.2% (305,940) |
| Connecticut: | 6.8% (228) |
Aggregate household income in Suffield in 2022: $3,651,573
Median family income in Suffield in 2022:| Suffield: | $222,045 |
| Connecticut: | $57,217 |
Number of families with income $100k - 125k:| Suffield: | 31.5% (17) |
| State: | 7.9% (159) |
Number of families with income > $200k:| Suffield: | 68.5% (37) |
| Connecticut: | 11.3% (228) |
Median per capita income in Suffield in 2022:| Suffield: | $106,468 |
| State: | $25,355 |
Change in median per capita income between 2000 and 2022:| Suffield, Connecticut: | +45.9% |
| Connecticut: | +39.4% |
Income statistics for Multirace residents
Median household income in Suffield, CT in 2022:| Suffield: | $119,871 |
| State: | $77,277 |
Change in median household income between 2000 and 2022:| Suffield, Connecticut: | +119.4% |
| Connecticut: | +113.6% |
Number of households with income < $10k:| Suffield: | 6.0% (11,257) |
| Connecticut: | 6.0% (7,457) |
Number of households with income $10k - 20k:| Suffield: | 8.1% (15,305) |
| Connecticut: | 8.1% (10,139) |
Number of households with income $20k - 30k:| Suffield: | 7.0% (13,136) |
| State: | 7.0% (8,702) |
Number of households with income $30k - 40k:| Suffield: | 6.9% (12,900) |
| State: | 6.9% (8,546) |
Number of households with income $40k - 50k:| Suffield: | 7.0% (13,151) |
| State: | 7.0% (8,712) |
Number of households with income $50k - 60k:| Suffield: | 5.9% (11,067) |
| Connecticut: | 5.9% (7,331) |
Number of households with income $60k - 75k:| Suffield: | 8.5% (16,053) |
| State: | 8.5% (10,634) |
Number of households with income $75k - 100k:| Suffield: | 14.1% (26,568) |
| State: | 14.1% (17,600) |
Number of households with income $100k - 125k:| Suffield: | 9.9% (18,693) |
| Connecticut: | 9.9% (12,383) |
Number of households with income $125k - 150k:| Suffield: | 7.2% (13,467) |
| Connecticut: | 7.2% (8,921) |
Number of households with income $150k - 200k:| Suffield: | 8.8% (16,487) |
| State: | 8.8% (10,922) |
Number of households with income > $200k:| Suffield: | 10.6% (19,997) |
| Connecticut: | 10.6% (13,247) |
Aggregate household income in Suffield in 2022: $55,609,596
Median family income in Suffield in 2022:| Suffield: | $113,170 |
| State: | $84,255 |
Number of families with income $30k - 40k:| Suffield: | 16.2% (28) |
| State: | 6.8% (5,759) |
Number of families with income $40k - 50k:| Suffield: | 10.1% (18) |
| Connecticut: | 6.9% (5,792) |
Number of families with income $50k - 60k:| Suffield: | 26.3% (46) |
| State: | 7.6% (6,420) |
Number of families with income $100k - 125k:| Suffield: | 47.5% (83) |
| State: | 9.2% (7,787) |
Median non-family income in Suffield in 2022:| Suffield: | $185,121 |
| State: | $44,462 |
Change in median non-family income between 2000 and 2022:| Suffield, Connecticut: | +81.0% |
| Connecticut: | +97.6% |
Median per capita income in Suffield in 2022:| Suffield: | $26,620 |
| Connecticut: | $32,794 |
Change in median per capita income between 2000 and 2022:| Suffield, Connecticut: | +95.5% |
| Connecticut: | +117.2% |
Income statistics for other residents
Number of households with income < $10k:| Suffield: | 7.1% (2) |
| Connecticut: | 9.0% (8,596) |
Number of households with income $10k - 20k:| Suffield: | 10.7% (3) |
| State: | 10.2% (9,773) |
Number of households with income $20k - 30k:| Suffield: | 7.1% (2) |
| State: | 9.1% (8,691) |
Number of households with income $30k - 40k:| Suffield: | 7.1% (2) |
| Connecticut: | 7.8% (7,447) |
Number of households with income $40k - 50k:| Suffield: | 7.1% (2) |
| Connecticut: | 8.2% (7,860) |
Number of households with income $50k - 60k:| Suffield: | 7.1% (2) |
| State: | 6.0% (5,757) |
Number of households with income $60k - 75k:| Suffield: | 10.7% (3) |
| State: | 9.3% (8,942) |
Number of households with income $75k - 100k:| Suffield: | 14.3% (4) |
| State: | 14.3% (13,700) |
Number of households with income $100k - 125k:| Suffield: | 7.1% (2) |
| State: | 7.2% (6,906) |
Number of households with income $125k - 150k:| Suffield: | 7.1% (2) |
| State: | 6.5% (6,215) |
Number of households with income $150k - 200k:| Suffield: | 7.1% (2) |
| Connecticut: | 6.1% (5,865) |
Number of households with income > $200k:| Suffield: | 7.1% (2) |
| Connecticut: | 6.3% (6,065) |
Aggregate household income in Suffield in 2022: $3,903,247
Median non-family income in Suffield in 2022:| Suffield: | $121,659 |
| Connecticut: | $34,285 |
Change in median non-family income between 2000 and 2022:| Suffield, Connecticut: | +83.6% |
| State: | +83.6% |
Median per capita income in Suffield in 2022:| Suffield: | $23,753 |
| State: | $29,353 |