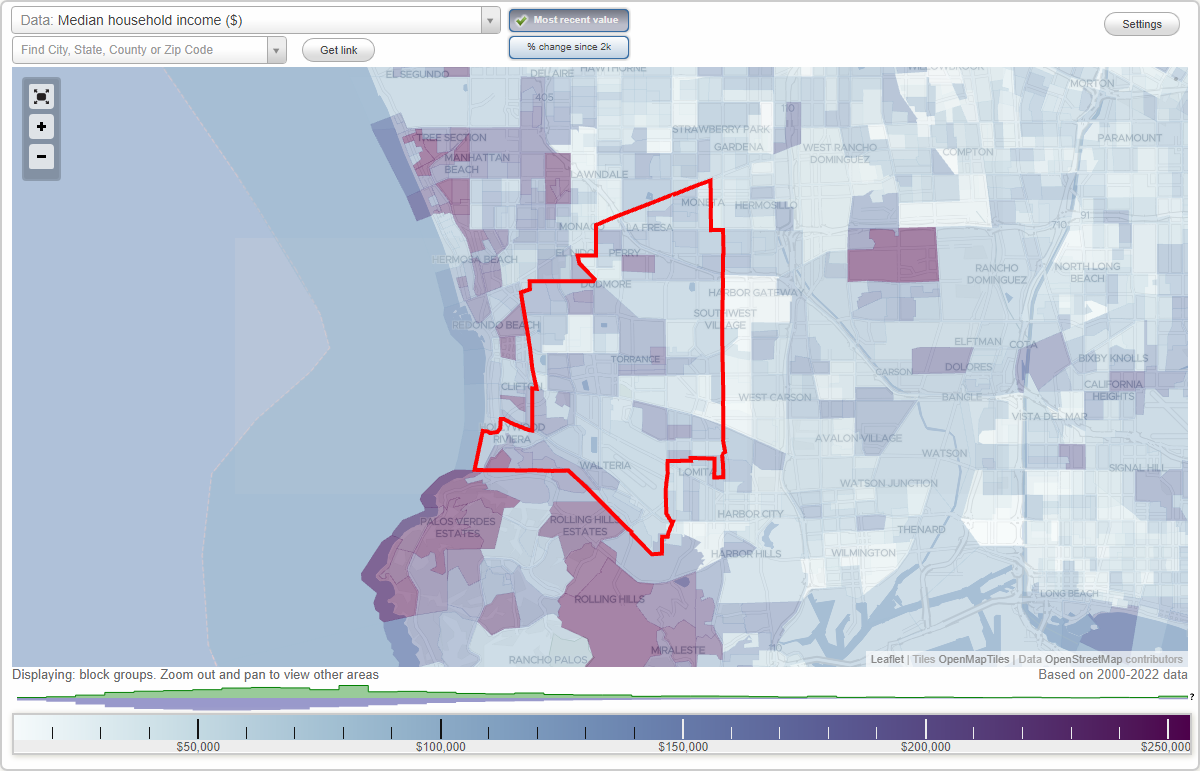
The median household income in Torrance, CA in 2022 was $108,406, which was 15.5% greater than the median annual income of $91,551 across the entire state of California. Compared to the median income of $56,489 in 2000 this represents an increase of 47.9%. The per capita income in 2022 was $53,753, which means an increase of 47.6% compared to 2000 when it was $28,144.
Whole page based on the data from 2000 / 2022 when the population of Torrance, California was 137,946 / 141,127
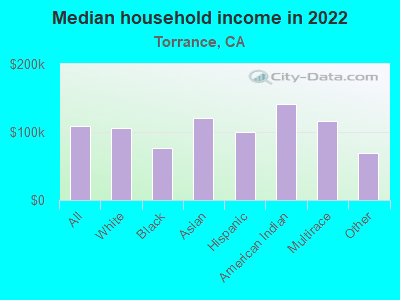
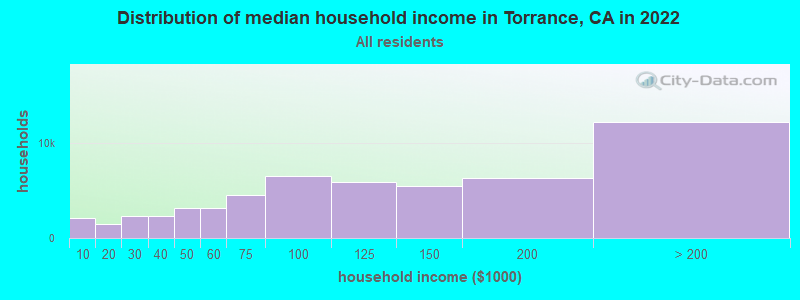
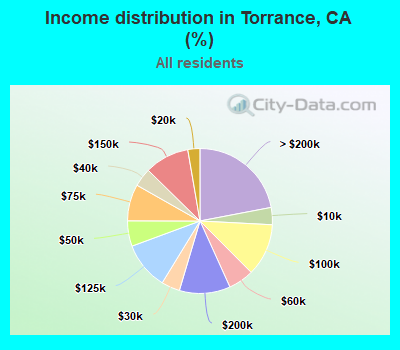
Income statistics for all residents
Median household income in Torrance, CA in 2022:
Torrance:
$108,406
State:
$91,551
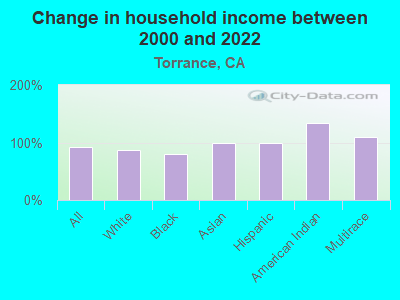
Change in median household income between 2000 and 2022:
Torrance, California:
+91.9%
State:
+92.8%
Number of households with income < $10k:
Torrance:
3.8% (2,118)
State:
4.8% (654,370)
Number of households with income $10k - 20k:
Torrance:
2.7% (1,492)
State:
5.8% (789,493)
Number of households with income $20k - 30k:
Torrance:
4.1% (2,291)
State:
5.7% (778,318)
Number of households with income $30k - 40k:
Torrance:
4.1% (2,275)
State:
5.8% (783,170)
Number of households with income $40k - 50k:
Torrance:
5.7% (3,130)
State:
5.8% (781,352)
Number of households with income $50k - 60k:
Torrance:
5.7% (3,146)
California:
5.6% (760,175)
Number of households with income $60k - 75k:
Torrance:
8.2% (4,512)
State:
8.2% (1,104,699)
Number of households with income $75k - 100k:
Torrance:
11.7% (6,463)
State:
12.0% (1,627,633)
Number of households with income $100k - 125k:
Torrance:
10.6% (5,872)
State:
10.0% (1,358,619)
Number of households with income $125k - 150k:
Torrance:
10.0% (5,498)
State:
7.6% (1,027,455)
Number of households with income $150k - 200k:
Torrance:
11.4% (6,267)
State:
10.6% (1,439,811)
Number of households with income > $200k:
Torrance:
22.0% (12,151)
California:
18.0% (2,445,491)
Aggregate household income in Torrance in 2022: $7,478,153,100
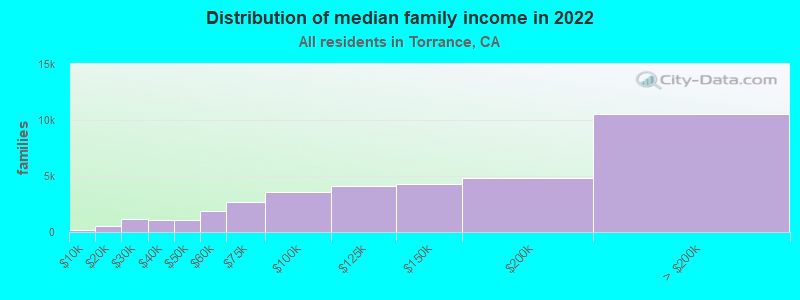
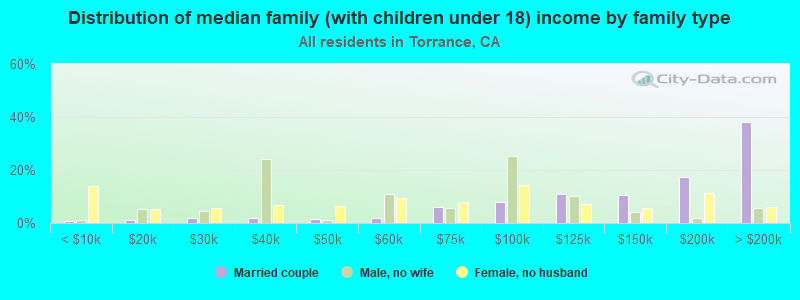
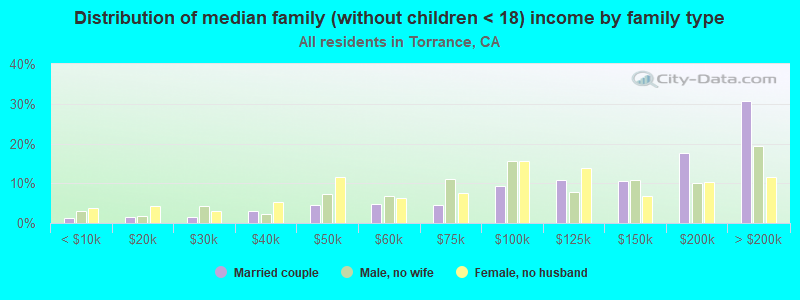
Median family income in Torrance in 2022:
Torrance:
$133,453
State:
$104,823
Number of families with income < $10k:
Torrance:
0.5% (191)
State:
3.1% (280,184)
Number of families with income $10k - 20k:
Torrance:
1.6% (574)
State:
3.5% (322,064)
Number of families with income $20k - 30k:
Torrance:
3.2% (1,137)
State:
4.7% (433,722)
Number of families with income $30k - 40k:
Torrance:
2.9% (1,027)
California:
5.2% (478,213)
Number of families with income $40k - 50k:
Torrance:
3.0% (1,088)
State:
5.6% (511,647)
Number of families with income $50k - 60k:
Torrance:
5.3% (1,892)
California:
5.5% (498,926)
Number of families with income $60k - 75k:
Torrance:
7.6% (2,713)
State:
8.0% (731,094)
Number of families with income $75k - 100k:
Torrance:
9.9% (3,536)
State:
12.2% (1,115,621)
Number of families with income $100k - 125k:
Torrance:
11.4% (4,101)
California:
10.5% (959,600)
Number of families with income $125k - 150k:
Torrance:
11.9% (4,258)
California:
8.4% (768,725)
Number of families with income $150k - 200k:
Torrance:
13.5% (4,848)
State:
11.9% (1,087,239)
Number of families with income > $200k:
Torrance:
29.3% (10,530)
California:
21.5% (1,963,769)
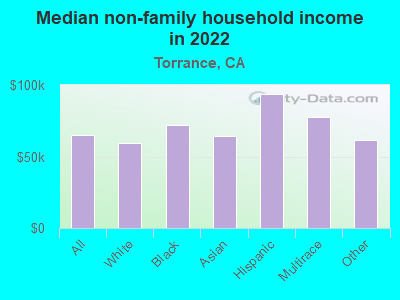
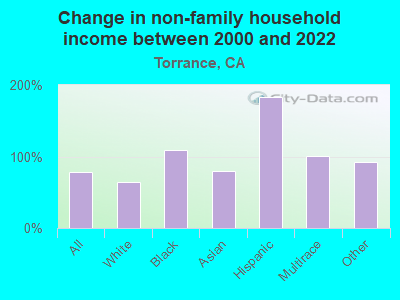
Median non-family income in Torrance in 2022:
Torrance:
$64,828
State:
$59,348
Change in median non-family income between 2000 and 2022:
Torrance, California:
+78.3%
California:
+85.3%
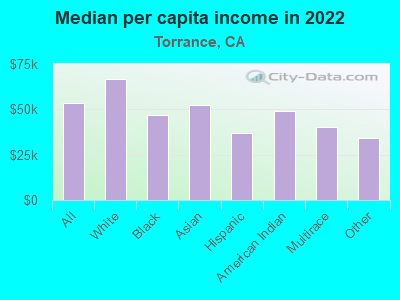
Median per capita income in Torrance in 2022:
Torrance:
$53,753
State:
$46,661
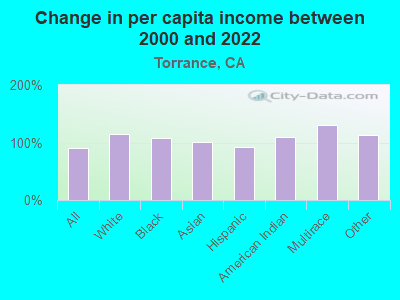
Change in median per capita income between 2000 and 2022:
Torrance, California:
+91.0%
California:
+105.5%
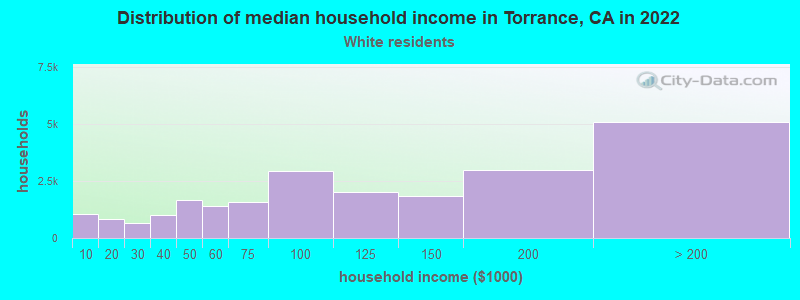
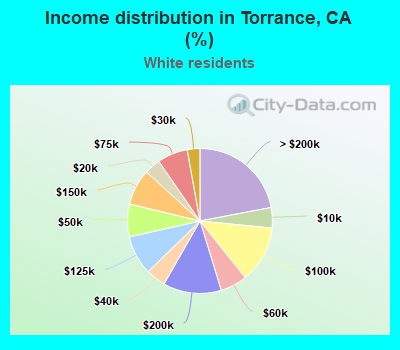
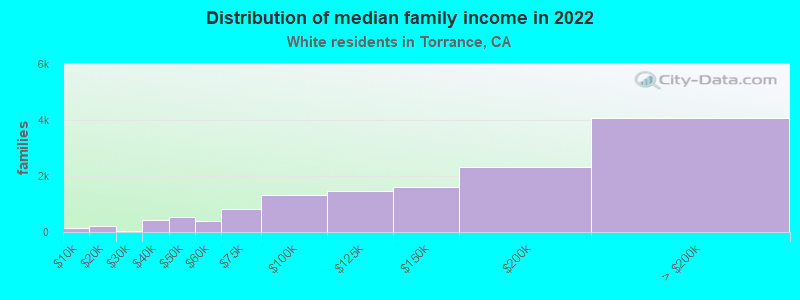
Income statistics for White residents
Median household income in Torrance, CA in 2022:
Torrance:
$105,755
State:
$100,917
Change in median household income between 2000 and 2022:
Torrance, California:
+86.8%
California:
+96.8%
Number of households with income < $10k:
Torrance:
4.5% (1,048)
State:
4.4% (284,109)
Number of households with income $10k - 20k:
Torrance:
3.6% (827)
State:
5.3% (340,330)
Number of households with income $20k - 30k:
Torrance:
2.8% (652)
State:
5.3% (343,145)
Number of households with income $30k - 40k:
Torrance:
4.4% (1,023)
California:
5.1% (330,146)
Number of households with income $40k - 50k:
Torrance:
7.3% (1,684)
California:
5.2% (335,310)
Number of households with income $50k - 60k:
Torrance:
6.0% (1,380)
State:
5.1% (326,299)
Number of households with income $60k - 75k:
Torrance:
6.8% (1,560)
State:
7.6% (487,640)
Number of households with income $75k - 100k:
Torrance:
12.7% (2,930)
State:
11.5% (736,578)
Number of households with income $100k - 125k:
Torrance:
8.8% (2,026)
California:
10.1% (648,782)
Number of households with income $125k - 150k:
Torrance:
8.0% (1,847)
State:
7.8% (499,671)
Number of households with income $150k - 200k:
Torrance:
13.0% (2,991)
State:
11.4% (729,603)
Number of households with income > $200k:
Torrance:
22.0% (5,076)
California:
21.2% (1,364,246)
Aggregate household income in Torrance in 2022: $3,122,146,500
Median family income in Torrance in 2022:
Torrance:
$144,194
California:
$125,379
Number of families with income < $10k:
Torrance:
1.0% (134)
State:
2.2% (87,079)
Number of families with income $10k - 20k:
Torrance:
1.5% (202)
California:
2.5% (97,716)
Number of families with income $20k - 30k:
Torrance:
0.3% (40)
California:
3.5% (137,295)
Number of families with income $30k - 40k:
Torrance:
3.2% (425)
State:
3.9% (152,947)
Number of families with income $40k - 50k:
Torrance:
4.1% (552)
State:
4.3% (169,197)
Number of families with income $50k - 60k:
Torrance:
3.1% (410)
State:
4.5% (176,192)
Number of families with income $60k - 75k:
Torrance:
6.1% (815)
State:
7.0% (274,752)
Number of families with income $75k - 100k:
Torrance:
9.8% (1,313)
California:
11.3% (445,632)
Number of families with income $100k - 125k:
Torrance:
11.0% (1,478)
California:
10.7% (423,630)
Number of families with income $125k - 150k:
Torrance:
12.0% (1,599)
State:
9.1% (357,408)
Number of families with income $150k - 200k:
Torrance:
17.4% (2,332)
State:
13.5% (532,693)
Number of families with income > $200k:
Torrance:
30.5% (4,077)
State:
27.6% (1,086,948)
Median non-family income in Torrance in 2022:
Torrance:
$59,738
California:
$62,819
Change in median non-family income between 2000 and 2022:
Torrance, California:
+63.7%
California:
+84.4%
Median per capita income in Torrance in 2022:
Torrance:
$66,897
California:
$61,706
Change in median per capita income between 2000 and 2022:
Torrance, California:
+113.6%
California:
+122.7%
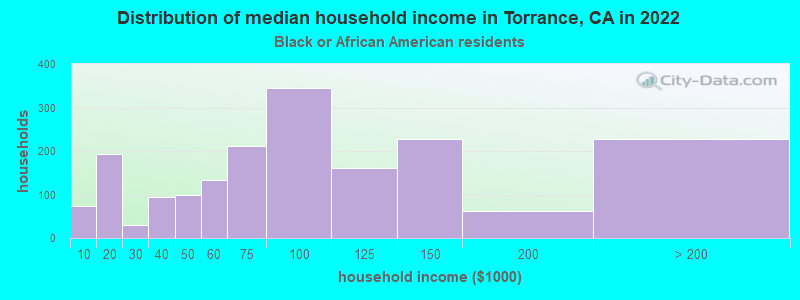
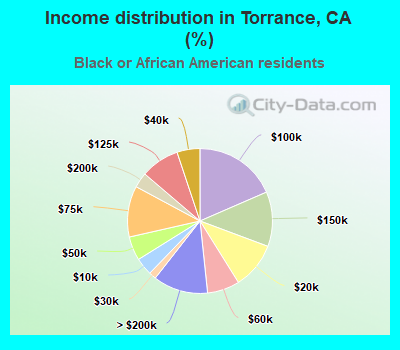
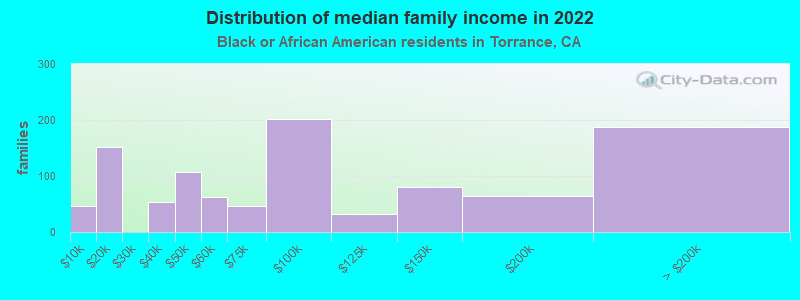
Income statistics for Black or African American residents
Median household income in Torrance, CA in 2022:
Torrance:
$76,465
California:
$63,268
Change in median household income between 2000 and 2022:
Torrance, California:
+79.7%
State:
+81.0%
Number of households with income < $10k:
Torrance:
3.9% (73)
California:
9.0% (73,219)
Number of households with income $10k - 20k:
Torrance:
10.4% (194)
State:
10.6% (86,666)
Number of households with income $20k - 30k:
Torrance:
1.6% (30)
State:
7.1% (57,719)
Number of households with income $30k - 40k:
Torrance:
5.1% (95)
State:
7.2% (58,714)
Number of households with income $40k - 50k:
Torrance:
5.3% (99)
State:
7.1% (58,075)
Number of households with income $50k - 60k:
Torrance:
7.2% (134)
California:
6.8% (55,229)
Number of households with income $60k - 75k:
Torrance:
11.4% (212)
State:
8.8% (71,895)
Number of households with income $75k - 100k:
Torrance:
18.5% (344)
State:
11.9% (96,893)
Number of households with income $100k - 125k:
Torrance:
8.7% (161)
State:
8.7% (70,729)
Number of households with income $125k - 150k:
Torrance:
12.2% (227)
State:
6.3% (51,211)
Number of households with income $150k - 200k:
Torrance:
3.4% (63)
State:
7.2% (58,687)
Number of households with income > $200k:
Torrance:
12.3% (228)
State:
9.3% (75,487)
Aggregate household income in Torrance in 2022: $189,040,500
Median family income in Torrance in 2022:
Torrance:
$74,333
State:
$77,263
Number of families with income < $10k:
Torrance:
4.5% (46)
California:
5.9% (27,037)
Number of families with income $10k - 20k:
Torrance:
14.7% (152)
California:
6.4% (29,505)
Number of families with income $30k - 40k:
Torrance:
5.2% (54)
State:
6.8% (30,948)
Number of families with income $40k - 50k:
Torrance:
10.4% (107)
State:
8.3% (38,171)
Number of families with income $50k - 60k:
Torrance:
6.0% (62)
State:
7.0% (31,860)
Number of families with income $60k - 75k:
Torrance:
4.5% (47)
California:
8.7% (40,021)
Number of families with income $75k - 100k:
Torrance:
19.5% (202)
State:
12.4% (56,846)
Number of families with income $100k - 125k:
Torrance:
3.1% (32)
State:
9.8% (44,911)
Number of families with income $125k - 150k:
Torrance:
7.8% (81)
State:
7.5% (34,434)
Number of families with income $150k - 200k:
Torrance:
6.2% (64)
State:
9.3% (42,807)
Number of families with income > $200k:
Torrance:
18.2% (188)
California:
12.2% (56,093)
Median non-family income in Torrance in 2022:
Torrance:
$71,915
State:
$41,942
Change in median non-family income between 2000 and 2022:
Torrance, California:
+108.7%
State:
+72.0%
Median per capita income in Torrance in 2022:
Torrance:
$46,949
State:
$36,708
Change in median per capita income between 2000 and 2022:
Torrance, California:
+107.2%
State:
+110.4%
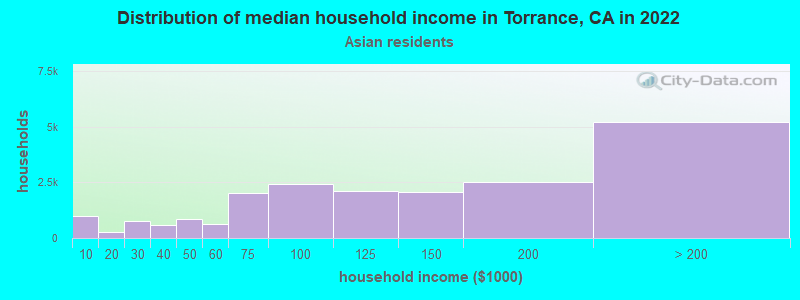
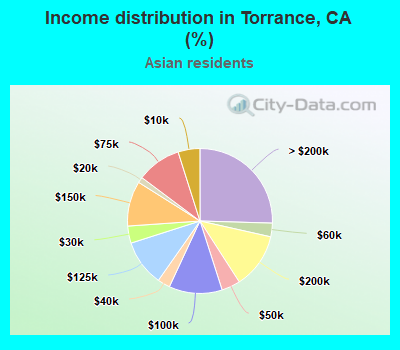
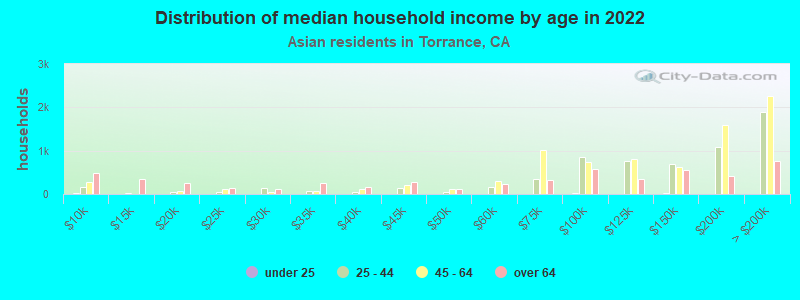
Income statistics for Asian residents
Median household income in Torrance, CA in 2022:
Torrance:
$121,213
State:
$119,861
Change in median household income between 2000 and 2022:
Torrance, California:
+99.0%
California:
+116.5%
Number of households with income < $10k:
Torrance:
4.9% (997)
State:
5.1% (106,273)
Number of households with income $10k - 20k:
Torrance:
1.3% (259)
California:
4.9% (101,815)
Number of households with income $20k - 30k:
Torrance:
3.8% (780)
State:
4.6% (94,414)
Number of households with income $30k - 40k:
Torrance:
2.8% (572)
California:
4.1% (84,491)
Number of households with income $40k - 50k:
Torrance:
4.2% (851)
California:
4.0% (81,758)
Number of households with income $50k - 60k:
Torrance:
3.0% (621)
State:
3.9% (80,971)
Number of households with income $60k - 75k:
Torrance:
9.9% (2,021)
State:
6.0% (124,194)
Number of households with income $75k - 100k:
Torrance:
11.9% (2,425)
State:
9.7% (200,337)
Number of households with income $100k - 125k:
Torrance:
10.3% (2,111)
State:
9.4% (193,488)
Number of households with income $125k - 150k:
Torrance:
10.1% (2,055)
California:
7.7% (158,253)
Number of households with income $150k - 200k:
Torrance:
12.4% (2,529)
State:
12.2% (252,139)
Number of households with income > $200k:
Torrance:
25.5% (5,203)
State:
28.4% (586,641)
Aggregate household income in Torrance in 2022: $3,022,421,700
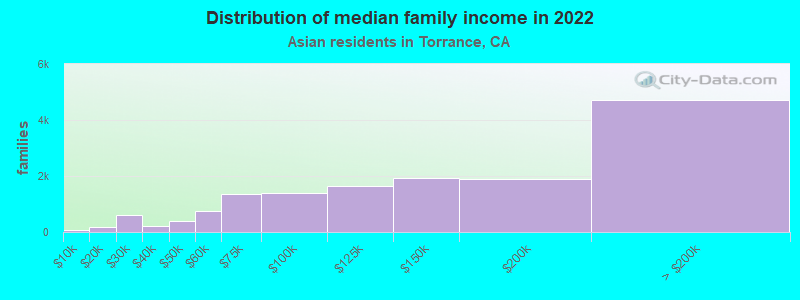
Median family income in Torrance in 2022:
Torrance:
$135,687
State:
$136,040
Number of families with income < $10k:
Torrance:
0.4% (57)
State:
2.8% (42,046)
Number of families with income $10k - 20k:
Torrance:
1.1% (172)
California:
3.1% (46,821)
Number of families with income $20k - 30k:
Torrance:
4.0% (599)
State:
4.1% (61,519)
Number of families with income $30k - 40k:
Torrance:
1.5% (220)
California:
3.7% (55,234)
Number of families with income $40k - 50k:
Torrance:
2.6% (393)
State:
3.9% (58,471)
Number of families with income $50k - 60k:
Torrance:
4.9% (746)
California:
3.9% (58,911)
Number of families with income $60k - 75k:
Torrance:
9.1% (1,374)
State:
5.9% (88,675)
Number of families with income $75k - 100k:
Torrance:
9.1% (1,384)
California:
9.5% (143,103)
Number of families with income $100k - 125k:
Torrance:
10.8% (1,632)
California:
9.4% (142,085)
Number of families with income $125k - 150k:
Torrance:
12.8% (1,941)
State:
8.0% (120,635)
Number of families with income $150k - 200k:
Torrance:
12.6% (1,908)
State:
13.2% (198,099)
Number of families with income > $200k:
Torrance:
31.1% (4,707)
State:
32.5% (489,303)
Median non-family income in Torrance in 2022:
Torrance:
$64,658
California:
$74,216
Change in median non-family income between 2000 and 2022:
Torrance, California:
+80.1%
State:
+136.3%
Median per capita income in Torrance in 2022:
Torrance:
$52,347
State:
$58,824
Change in median per capita income between 2000 and 2022:
Torrance, California:
+100.8%
State:
+166.8%
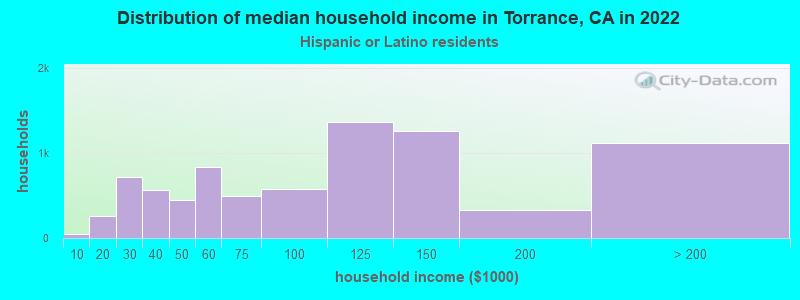
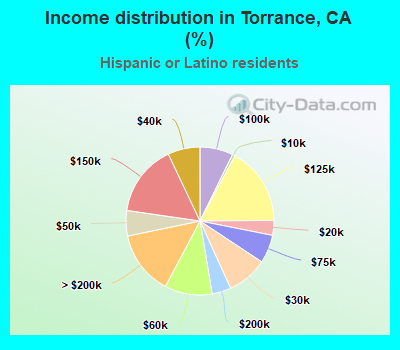
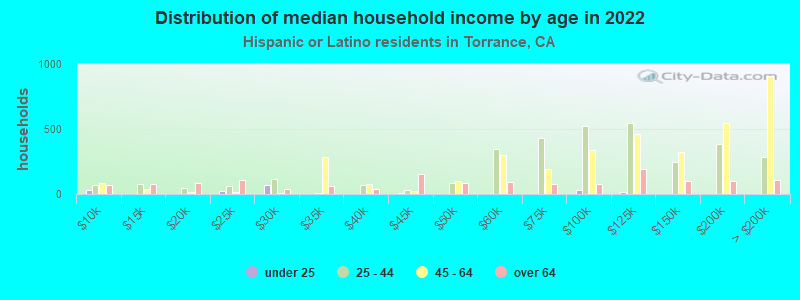
Income statistics for Hispanic or Latino residents
Median household income in Torrance, CA in 2022:
Torrance:
$100,412
California:
$75,698
Change in median household income between 2000 and 2022:
Torrance, California:
+99.0%
State:
+107.2%
Number of households with income < $10k:
Torrance:
0.6% (47)
State:
4.3% (183,294)
Number of households with income $10k - 20k:
Torrance:
3.2% (260)
California:
6.0% (253,903)
Number of households with income $20k - 30k:
Torrance:
8.9% (713)
State:
6.8% (286,386)
Number of households with income $30k - 40k:
Torrance:
7.0% (562)
California:
7.4% (313,728)
Number of households with income $40k - 50k:
Torrance:
5.5% (444)
State:
7.4% (313,199)
Number of households with income $50k - 60k:
Torrance:
10.4% (830)
State:
7.2% (305,366)
Number of households with income $60k - 75k:
Torrance:
6.2% (496)
State:
10.3% (434,937)
Number of households with income $75k - 100k:
Torrance:
7.3% (581)
State:
14.4% (607,302)
Number of households with income $100k - 125k:
Torrance:
17.0% (1,363)
California:
10.6% (447,424)
Number of households with income $125k - 150k:
Torrance:
15.7% (1,256)
State:
7.5% (316,022)
Number of households with income $150k - 200k:
Torrance:
4.2% (334)
State:
9.2% (386,269)
Number of households with income > $200k:
Torrance:
14.0% (1,121)
State:
8.8% (372,651)
Aggregate household income in Torrance in 2022: $857,070,600
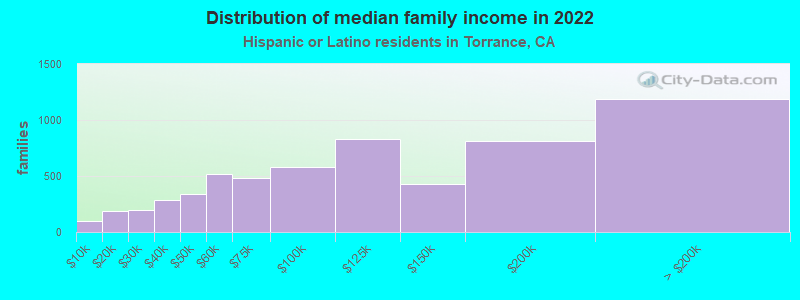
Median family income in Torrance in 2022:
Torrance:
$102,827
California:
$77,589
Number of families with income < $10k:
Torrance:
1.7% (99)
California:
3.9% (129,468)
Number of families with income $10k - 20k:
Torrance:
3.1% (187)
State:
4.6% (151,997)
Number of families with income $20k - 30k:
Torrance:
3.4% (199)
California:
6.6% (216,764)
Number of families with income $30k - 40k:
Torrance:
4.8% (284)
State:
7.6% (249,849)
Number of families with income $40k - 50k:
Torrance:
5.6% (335)
State:
7.7% (254,822)
Number of families with income $50k - 60k:
Torrance:
8.7% (517)
State:
7.4% (244,815)
Number of families with income $60k - 75k:
Torrance:
8.1% (479)
State:
10.5% (345,838)
Number of families with income $75k - 100k:
Torrance:
9.7% (577)
State:
14.9% (491,589)
Number of families with income $100k - 125k:
Torrance:
14.0% (831)
State:
10.7% (355,400)
Number of families with income $125k - 150k:
Torrance:
7.2% (425)
California:
7.8% (259,317)
Number of families with income $150k - 200k:
Torrance:
13.6% (809)
State:
9.3% (306,566)
Number of families with income > $200k:
Torrance:
20.0% (1,184)
State:
9.1% (299,984)
Median non-family income in Torrance in 2022:
Torrance:
$93,466
California:
$49,746
Median per capita income in Torrance in 2022:
Torrance:
$36,973
State:
$27,240
Change in median per capita income between 2000 and 2022:
Torrance, California:
+92.8%
State:
+133.3%
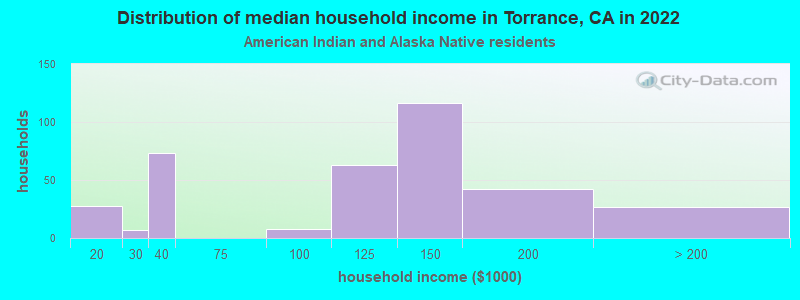
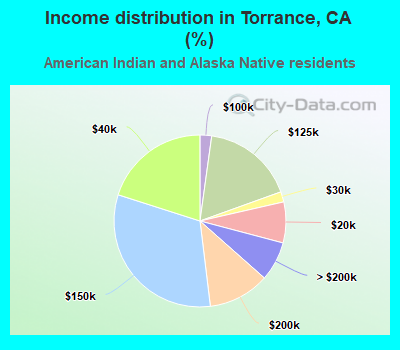
Income statistics for American Indian and Alaska Native residents
Median household income in Torrance, CA in 2022:
Torrance:
$141,694
State:
$76,752
Change in median household income between 2000 and 2022:
Torrance, California:
+134.1%
State:
+110.0%
Number of households with income < $10k:
Torrance:
0.0% (0)
California:
5.4% (8,471)
Number of households with income $10k - 20k:
Torrance:
7.7% (28)
State:
6.0% (9,381)
Number of households with income $20k - 30k:
Torrance:
1.9% (7)
State:
5.5% (8,668)
Number of households with income $30k - 40k:
Torrance:
20.1% (73)
State:
8.3% (13,030)
Number of households with income $40k - 50k:
Torrance:
0.0% (0)
California:
6.9% (10,908)
Number of households with income $50k - 60k:
Torrance:
0.0% (0)
State:
7.1% (11,198)
Number of households with income $60k - 75k:
Torrance:
0.0% (0)
State:
9.6% (15,190)
Number of households with income $75k - 100k:
Torrance:
2.2% (8)
California:
14.1% (22,274)
Number of households with income $100k - 125k:
Torrance:
17.3% (63)
State:
11.2% (17,643)
Number of households with income $125k - 150k:
Torrance:
31.9% (116)
State:
8.3% (13,117)
Number of households with income $150k - 200k:
Torrance:
11.5% (42)
State:
8.8% (13,853)
Number of households with income > $200k:
Torrance:
7.4% (27)
State:
8.8% (13,925)
Aggregate household income in Torrance in 2022: $44,553,190
Median per capita income in Torrance in 2022:
Torrance:
$49,090
State:
$30,289
Change in median per capita income between 2000 and 2022:
Torrance, California:
+109.0%
California:
+98.9%
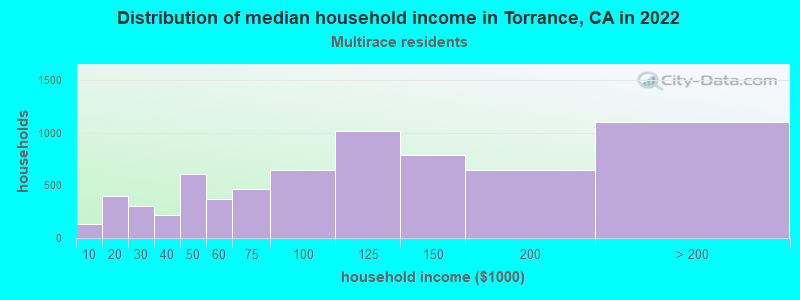
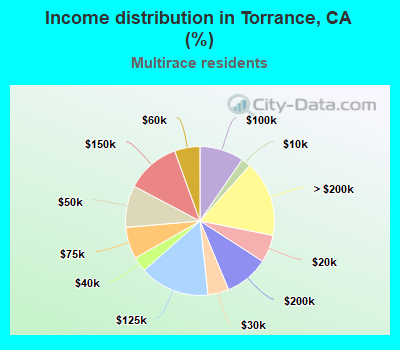
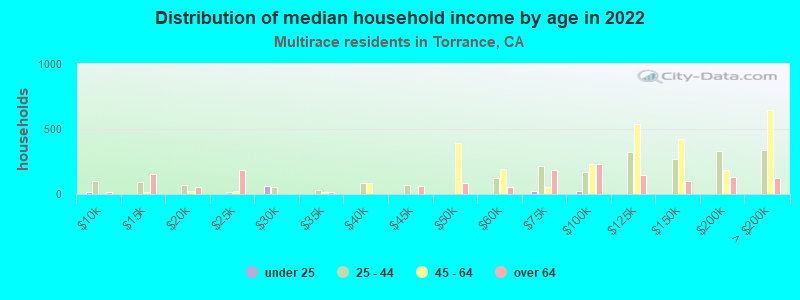
Income statistics for Multirace residents
Median household income in Torrance, CA in 2022:
Torrance:
$116,523
State:
$83,153
Change in median household income between 2000 and 2022:
Torrance, California:
+109.3%
State:
+106.0%
Number of households with income < $10k:
Torrance:
2.0% (136)
California:
4.2% (85,299)
Number of households with income $10k - 20k:
Torrance:
6.0% (401)
State:
6.1% (122,966)
Number of households with income $20k - 30k:
Torrance:
4.6% (306)
State:
6.4% (129,328)
Number of households with income $30k - 40k:
Torrance:
3.2% (215)
California:
6.4% (130,070)
Number of households with income $40k - 50k:
Torrance:
9.1% (609)
State:
6.5% (131,254)
Number of households with income $50k - 60k:
Torrance:
5.5% (369)
State:
6.5% (132,382)
Number of households with income $60k - 75k:
Torrance:
6.9% (463)
California:
9.4% (191,472)
Number of households with income $75k - 100k:
Torrance:
9.6% (642)
State:
13.3% (269,691)
Number of households with income $100k - 125k:
Torrance:
15.2% (1,016)
State:
10.2% (207,286)
Number of households with income $125k - 150k:
Torrance:
11.7% (785)
State:
7.8% (158,259)
Number of households with income $150k - 200k:
Torrance:
9.6% (642)
State:
10.3% (209,227)
Number of households with income > $200k:
Torrance:
16.5% (1,103)
State:
13.0% (263,210)
Aggregate household income in Torrance in 2022: $715,166,000
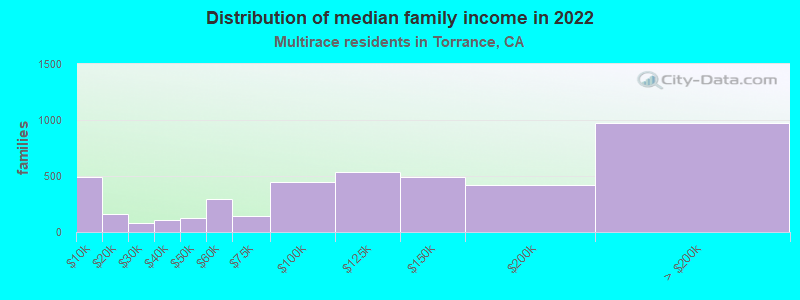
Median family income in Torrance in 2022:
Torrance:
$144,940
State:
$87,642
Number of families with income < $10k:
Torrance:
11.4% (489)
State:
3.2% (48,017)
Number of families with income $10k - 20k:
Torrance:
3.8% (162)
State:
4.1% (60,419)
Number of families with income $20k - 30k:
Torrance:
2.0% (84)
State:
6.1% (89,742)
Number of families with income $30k - 40k:
Torrance:
2.5% (105)
State:
6.2% (91,415)
Number of families with income $40k - 50k:
Torrance:
2.9% (123)
California:
6.8% (100,085)
Number of families with income $50k - 60k:
Torrance:
6.8% (291)
State:
6.7% (98,298)
Number of families with income $60k - 75k:
Torrance:
3.3% (142)
California:
9.5% (140,131)
Number of families with income $75k - 100k:
Torrance:
10.5% (450)
State:
13.8% (203,439)
Number of families with income $100k - 125k:
Torrance:
12.6% (540)
State:
10.4% (153,515)
Number of families with income $125k - 150k:
Torrance:
11.5% (492)
State:
8.4% (124,115)
Number of families with income $150k - 200k:
Torrance:
9.8% (418)
California:
10.9% (161,643)
Number of families with income > $200k:
Torrance:
22.8% (974)
California:
14.0% (207,317)
Median non-family income in Torrance in 2022:
Torrance:
$77,510
State:
$56,558
Change in median non-family income between 2000 and 2022:
Torrance, California:
+100.6%
California:
+100.2%
Median per capita income in Torrance in 2022:
Torrance:
$40,059
State:
$32,124
Change in median per capita income between 2000 and 2022:
Torrance, California:
+130.6%
State:
+120.4%
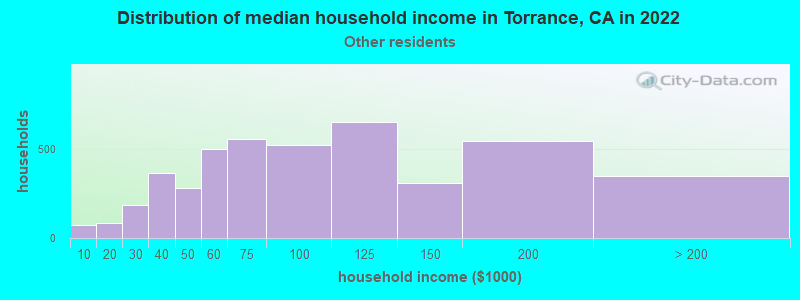
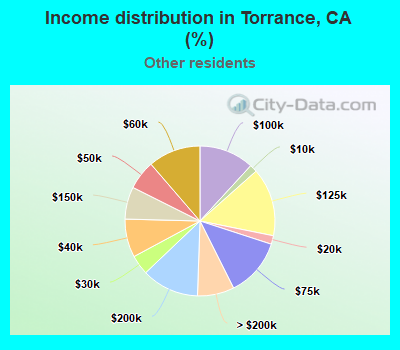
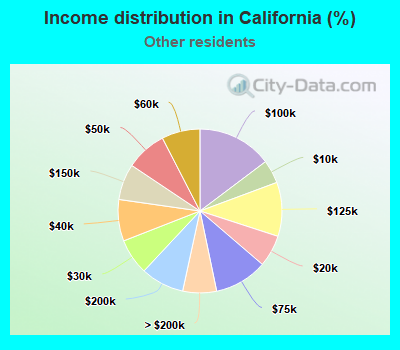
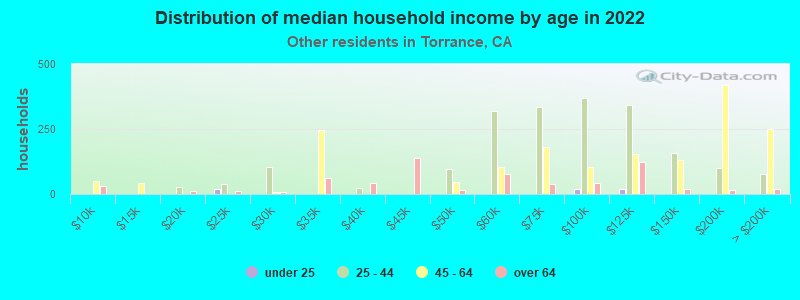
Income statistics for other residents
Median household income in Torrance, CA in 2022:
Torrance:
$69,056
State:
$71,383
Number of households with income < $10k:
Torrance:
1.6% (72)
California:
4.6% (93,035)
Number of households with income $10k - 20k:
Torrance:
1.8% (82)
State:
6.3% (126,222)
Number of households with income $20k - 30k:
Torrance:
4.2% (188)
State:
7.1% (142,656)
Number of households with income $30k - 40k:
Torrance:
8.3% (367)
State:
8.2% (165,018)
Number of households with income $40k - 50k:
Torrance:
6.3% (279)
California:
8.0% (161,732)
Number of households with income $50k - 60k:
Torrance:
11.3% (502)
State:
7.6% (152,152)
Number of households with income $60k - 75k:
Torrance:
12.6% (559)
State:
10.4% (209,951)
Number of households with income $75k - 100k:
Torrance:
11.8% (524)
State:
14.7% (296,102)
Number of households with income $100k - 125k:
Torrance:
14.7% (653)
State:
10.7% (214,281)
Number of households with income $125k - 150k:
Torrance:
7.0% (309)
State:
7.1% (143,092)
Number of households with income $150k - 200k:
Torrance:
12.4% (548)
State:
8.6% (172,215)
Number of households with income > $200k:
Torrance:
7.9% (351)
California:
6.7% (134,102)
Aggregate household income in Torrance in 2022: $379,037,600
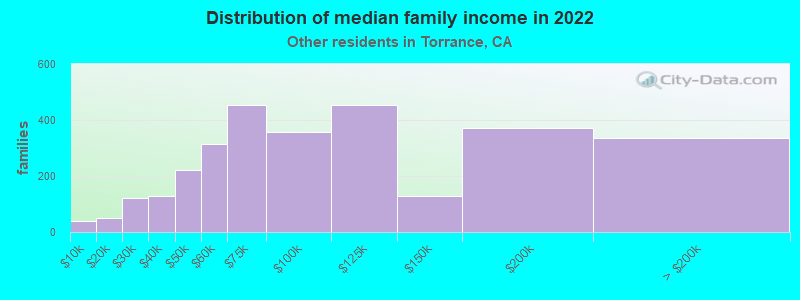
Median family income in Torrance in 2022:
Torrance:
$67,314
State:
$72,756
Number of families with income < $10k:
Torrance:
1.3% (39)
California:
4.3% (69,090)
Number of families with income $10k - 20k:
Torrance:
1.7% (51)
State:
5.1% (82,116)
Number of families with income $20k - 30k:
Torrance:
4.1% (122)
State:
7.0% (112,854)
Number of families with income $30k - 40k:
Torrance:
4.3% (129)
State:
8.4% (135,938)
Number of families with income $40k - 50k:
Torrance:
7.5% (222)
State:
8.4% (135,353)
Number of families with income $50k - 60k:
Torrance:
10.6% (314)
State:
7.7% (124,826)
Number of families with income $60k - 75k:
Torrance:
15.2% (454)
California:
10.7% (173,628)
Number of families with income $75k - 100k:
Torrance:
11.9% (356)
State:
15.2% (245,724)
Number of families with income $100k - 125k:
Torrance:
15.3% (454)
California:
10.9% (176,716)
Number of families with income $125k - 150k:
Torrance:
4.3% (127)
State:
7.4% (119,985)
Number of families with income $150k - 200k:
Torrance:
12.5% (373)
State:
8.5% (137,332)
Number of families with income > $200k:
Torrance:
11.3% (336)
State:
6.6% (106,346)
Median non-family income in Torrance in 2022:
Torrance:
$61,743
State:
$43,881
Change in median non-family income between 2000 and 2022:
Torrance, California:
+93.5%
State:
+84.6%
Median per capita income in Torrance in 2022:
Torrance:
$34,360
California:
$25,164
Change in median per capita income between 2000 and 2022:
Torrance, California:
+113.2%
State:
+137.9%
Discuss Torrance, California (CA) on our hugely popular California forum.