Bennett Valley neighborhood in Santa Rosa, California (CA), 95405 detailed profile
Settings
X


Business Search - 14 Million verified businesses
Area: 0.375 square miles
Population: 689
Population density:
| Bennett Valley: | 1,838 people per square mile |
| Santa Rosa: | 4,416 people per square mile |

- 59566.0%White
- 16218.0%Asian
- 616.8%Hispanic or Latino
- 364.0%Two or more races
- 313.4%Some other race
- 151.7%Native Hawaiian and Other
Pacific Islander - 10.1%Black

Median household income in 2022:
| Bennett Valley: | $175,639 |
| Santa Rosa: | $95,403 |
Distribution of median household income
![Distribution of median household income]()
- 13Less than $10,000
- 12$10,000 to $19,999
- 17$20,000 to $29,999
- 20$30,000 to $39,999
- 26$40,000 to $49,999
- 13$50,000 to $59,999
- 9$60,000 to $74,999
- 64$75,000 to $99,999
- 30$100,000 to $124,999
- 7$125,000 to $149,999
- 48$150,000 to $199,999
- 111$200,000 or more

Distribution of owner-occupied house/condo value
![Distribution of owner-occupied house/condo value]()
- 2Less than $50,000
- 1$50,000 to $99,999
- 1$100,000 to $149,999
- 15$400,000 to $499,999
- 52$500,000 to $749,999
- 122$750,000 to $999,999
- 110$1,000,000 or more

Distribution of rent paid by renters
![Distribution of rent paid by renters]()
- 11$1,250 to $1,499
- 24$1,500 to $1,999
- 81$2,000 or more

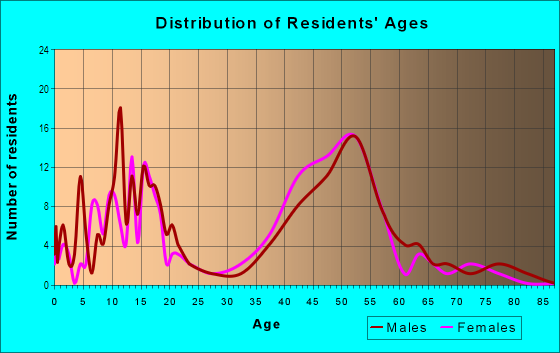
| Males: | 335 |
| Females: | 353 |
Males:
| This neighborhood: | 51.9 years |
| Whole city: | 39.4 years |
| This neighborhood: | 52.8 years |
| Whole city: | 42.1 years |
Average household size:
| Bennett Valley: | 10.4 people |
| Santa Rosa: | 2.5 people |
Percentage of family households:
| Bennett Valley: | 40.2% |
| Santa Rosa: | 42.7% |
| Here: | 82.2% |
| Santa Rosa: | 46.6% |
Percentage of married-couple families with children (among all households):
| Bennett Valley: | 42.1% |
| Santa Rosa: | 26.3% |
Percentage of single-mother households (among all households):
| Bennett Valley: | 65.9% |
| Santa Rosa: | 7.8% |
Percentage of never married males 15 years old and over:
Percentage of never married females 15 years old and over:
| Bennett Valley: | 9.6% |
| Santa Rosa: | 18.1% |
Percentage of never married females 15 years old and over:
| Bennett Valley: | 6.6% |
| city: | 16.3% |
Percentage of people that speak English not well or not at all:
| Bennett Valley: | 1.5% |
| Santa Rosa: | 7.9% |
Percentage of people born in this state:
Percentage of people born in another U.S. state:
Percentage of native residents but born outside the U.S.:
Percentage of foreign born residents:
| Here: | 70.8% |
| Santa Rosa: | 61.5% |
Percentage of people born in another U.S. state:
| Bennett Valley: | 22.4% |
| Santa Rosa: | 17.6% |
Percentage of native residents but born outside the U.S.:
| Here: | 0.8% |
| city: | 0.7% |
Percentage of foreign born residents:
| Here: | 5.9% |
| Santa Rosa: | 20.3% |

Owner-occupied
Renter-occupied


- Rooms in owner-occupied houses and condos in Bennett Valley
- 01 room
- 02 rooms
- 13 rooms
- 74 rooms
- 85 rooms
- 426 rooms
- 977 rooms
- 618 rooms
- 709+ rooms

- Rooms in renter-occupied apartments in Bennett Valley
- 01 room
- 32 rooms
- 103 rooms
- 324 rooms
- 825 rooms
- 276 rooms
- 147 rooms
- 158 rooms
- 19+ rooms
Owner-occupied
Renter-occupied

- Bedrooms in owner-occupied houses and condos in Bennett Valley
- 0no bedroom
- 01 bedroom
- 132 bedrooms
- 1253 bedrooms
- 1364 bedrooms
- 125+ bedrooms

- Bedrooms in renter-occupied apartments in Bennett Valley
- 0no bedroom
- 31 bedroom
- 212 bedrooms
- 803 bedrooms
- 14 bedrooms
- 105+ bedrooms
Average number of cars or other vehicles available in houses/condos:
Average number of cars or other vehicles available in apartments:
| This neighborhood: | 4.1 |
| Santa Rosa: | 2.1 |
Average number of cars or other vehicles available in apartments:
| Here: | |
| city: |
Percentage of units with a mortgage:
| Bennett Valley: | 55.5% |
| Santa Rosa: | 64.0% |
Housing prices:
- Average estimated value of detached houses in 2022 (97.6% of all units):
Bennett Valley: $702,605 Santa Rosa: $764,936
- Average estimated value of townhouses or other attached units in 2022 (1.0% of all units):
This neighborhood: $606,112 city: $570,248

- Year house built in Bennett Valley
- 02020 or later
- 02010 to 2019
- 52000 to 2009
- 291990 to 1999
- 1581980 to 1989
- 951970 to 1979
- 41960 to 1969
- 81950 to 1959
- 01940 to 1949
- 01939 or earlier

City-data.com crime index for city in 2020 (higher means more crime):
| City: | 235.1 |
| U.S. average: | 219.5 |
Travel time to work (commute)
![Travel time to work (commute)]()
- 3Less than 5 minutes
- 165 to 9 minutes
- 3710 to 14 minutes
- 4315 to 19 minutes
- 5720 to 24 minutes
- 2525 to 29 minutes
- 1430 to 34 minutes
- 835 to 39 minutes
- 2240 to 44 minutes
- 10345 to 59 minutes
- 1560 to 89 minutes
- 690 or more minutes

Means of transportation to work
![Means of transportation to work]()
- 82.2%304Drove a car alone
- 44.3%164Carpooled
- 3.2%12Bus
- 0.5%2Bicycle
- 10.0%37Other means
- 16.5%61Worked at home

Time leaving home to go to work
![Time leaving home to go to work]()
- 1412:00 a.m. to 4:59 a.m.
- 25:00 a.m. to 5:29 a.m.
- 55:30 a.m. to 5:59 a.m.
- 126:00 a.m. to 6:29 a.m.
- 356:30 a.m. to 6:59 a.m.
- 367:00 a.m. to 7:29 a.m.
- 467:30 a.m. to 7:59 a.m.
- 208:00 a.m. to 8:29 a.m.
- 138:30 a.m. to 8:59 a.m.
- 229:00 a.m. to 9:59 a.m.
- 610:00 a.m. to 10:59 a.m.
- 1011:00 a.m. to 11:59 a.m.
- 412:00 p.m. to 3:59 p.m.
- 114:00 p.m. to 11:59 p.m.

Occupations of males:
- Percentage of males in management occupations (except farmers):
Here: 15.7% city: 11.1%
- Percentage of males in business and financial operations occupations:
Here: 6.9% city: 5.3%
- Percentage of males in computer and mathematical occupations:
Here: 10.0% city: 3.1%
- Percentage of males in architecture and engineering occupations:
Here: 1.1% city: 4.1%
- Percentage of males in community and social services occupations:
Here: 3.2% city: 1.3%
- Percentage of males in education, training, and library occupations:
Here: 7.3% city: 3.1%
- Percentage of males in arts, design, entertainment, sports, and media occupations:
Here: 6.5% city: 2.2%
- Percentage of males in healthcare practitioners and technical occupations:
Here: 12.1% city: 3.8%
- Percentage of males in sales and office occupations:
Here: 18.8% city: 15.3%
- Percentage of males in construction, extraction, and maintenance occupations:
Here: 4.0% city: 12.2%
- Percentage of males in material moving occupations:
Here: 8.8% city: 4.1%
Occupations of females:
- Percentage of females in management occupations (except farmers):
Here: 7.0% city: 11.3%
- Percentage of females in business and financial operations occupations:
Here: 14.9% city: 5.9%
- Percentage of females in community and social services occupations:
Here: 6.4% city: 3.1%
- Percentage of females in education, training, and library occupations:
Here: 4.1% city: 7.1%
- Percentage of females in arts, design, entertainment, sports, and media occupations:
Here: 3.2% city: 2.4%
- Percentage of females in healthcare practitioners and technical occupations:
Here: 25.1% city: 8.5%
- Percentage of females in service occupations:
Here: 14.5% city: 23.0%
- Percentage of females in sales and office occupations:
Here: 22.8% city: 25.9%
- Percentage of females in transportation occupations:
Here: 1.3% city: 0.7%
Education in this neighborhood (subdivision or community):
- Percentage of people 3 years and older in K-12 schools:
Bennett Valley: 27.0% Santa Rosa: 15.4%
- Percentage of people 3 years and older in undergraduate colleges:
Bennett Valley: 2.3% Santa Rosa: 5.1%
- Percentage of people 3 years and older in grad. or professional schools:
Bennett Valley: 6.4% Santa Rosa: 1.4%
- Percentage of students K-12 enrolled in private schools:
Bennett Valley: 50.5% Santa Rosa: 7.1%
Percentage of population below poverty level:
| Bennett Valley: | 4.4% |
| Santa Rosa: | 9.5% |
Median year owner moved in (as recorded in 2022):
| Bennett Valley: | 2002 |
| Santa Rosa: | 2011 |
Percentage of married-couple families with both working:
| Bennett Valley: | 85.4% |
| Santa Rosa: | 73.4% |

- 67.1%Utility gas
- 20.0%Electricity
- 6.1%Bottled, tank, or LP gas
- 3.3%Solar energy
- 2.1%Wood
- 1.4%No fuel used
Roads and streets:
Hillsboro Cir
Length: 1.06 miles
Directions: E-W, N-S, SE-NW, SW-NE
Address range: 4705 to 4802
Directions: E-W, N-S, SE-NW, SW-NE
Address range: 4705 to 4802
Summerfield Rd
Length: 0.77 miles
Directions: N-S, SE-NW, SW-NE
Address range: 2900 to 2999
Directions: N-S, SE-NW, SW-NE
Address range: 2900 to 2999
Woodview Dr
Length: 0.64 miles
Directions: E-W, N-S, SE-NW, SW-NE
Address range: 4700 to 47769
Directions: E-W, N-S, SE-NW, SW-NE
Address range: 4700 to 47769
Annadel Heights Dr
Length: 0.47 miles
Directions: E-W, SW-NE
Address range: 4700 to 4810
Directions: E-W, SW-NE
Address range: 4700 to 4810
Old Ranch Dr
Length: 0.30 miles
Directions: E-W, SE-NW
Address range: 3100 to 3299
Directions: E-W, SE-NW
Address range: 3100 to 3299
Las Mesitas Dr
Length: 0.23 miles
Directions: E-W, N-S, SE-NW, SW-NE
Address range: 3000 to 3199
Directions: E-W, N-S, SE-NW, SW-NE
Address range: 3000 to 3199
Golf View Ct
Length: 0.23 miles
Directions: E-W, SW-NE
Address range: 4700 to 4731
Directions: E-W, SW-NE
Address range: 4700 to 4731
Santa Rosita Ct
Length: 0.20 miles
Directions: E-W, SW-NE
Address range: 4700 to 4753
Directions: E-W, SW-NE
Address range: 4700 to 4753
Muirfield Ct
Length: 0.16 miles
Directions: E-W, N-S, SE-NW, SW-NE
Address range: 4774 to 4799
Directions: E-W, N-S, SE-NW, SW-NE
Address range: 4774 to 4799
Old Ranch Pl
Length: 0.14 miles
Directions: N-S, SE-NW, SW-NE
Address range: 2200 to 2299
Directions: N-S, SE-NW, SW-NE
Address range: 2200 to 2299
Foxwood Pl
Length: 0.14 miles
Directions: E-W, N-S, SE-NW, SW-NE
Address range: 3500 to 3598
Directions: E-W, N-S, SE-NW, SW-NE
Address range: 3500 to 3598
Santa Margarita Ct
Length: 0.13 miles
Directions: N-S, SE-NW, SW-NE
Address range: 3000 to 3099
Directions: N-S, SE-NW, SW-NE
Address range: 3000 to 3099
Baytree Pl
Length: 0.13 miles
Directions: E-W, N-S, SE-NW, SW-NE
Address range: 4766 to 4777
Directions: E-W, N-S, SE-NW, SW-NE
Address range: 4766 to 4777
Tee View Ct
Length: 0.13 miles
Directions: E-W, SW-NE
Address range: 4700 to 4732
Directions: E-W, SW-NE
Address range: 4700 to 4732
Santa Juanita Ct
Length: 0.12 miles
Directions: E-W, SE-NW
Address range: 3000 to 3035
Directions: E-W, SE-NW
Address range: 3000 to 3035
Circle B Pl
Length: 0.08 miles
Directions: N-S, SE-NW
Address range: 4713 to 4717
Directions: N-S, SE-NW
Address range: 4713 to 4717
Golf View Ter
Length: 0.08 miles
Directions: N-S, SE-NW
Address range: 3536 to 3557
Directions: N-S, SE-NW
Address range: 3536 to 3557
Santa Anita Ct
Length: 0.07 miles
Direction: SE-NW
Address range: 3000 to 3033
Direction: SE-NW
Address range: 3000 to 3033
el Monte Dr
Length: 0.07 miles
Directions: N-S, SW-NE
Address range: 3100 to 4745
Directions: N-S, SW-NE
Address range: 3100 to 4745
Valley Pl
Length: 0.06 miles
Directions: N-S, SE-NW, SW-NE
Address range: 2200 to 2299
Directions: N-S, SE-NW, SW-NE
Address range: 2200 to 2299
Westline Ct
Length: 0.06 miles
Directions: N-S, SE-NW
Address range: 4745 to 4759
Directions: N-S, SE-NW
Address range: 4745 to 4759
Livingstone Pl
Length: 0.06 miles
Directions: N-S, SE-NW, SW-NE
Address range: 4724 to 4748
Directions: N-S, SE-NW, SW-NE
Address range: 4724 to 4748
Las Mesitas Ct
Length: 0.06 miles
Directions: E-W, SE-NW
Address range: 3000 to 3099
Directions: E-W, SE-NW
Address range: 3000 to 3099
Ravenwood Pl
Length: 0.05 miles
Direction: SW-NE
Address range: 3600 to 3699
Direction: SW-NE
Address range: 3600 to 3699
Keystone Ct
Length: 0.05 miles
Direction: SW-NE
Address range: 4743 to 4759
Direction: SW-NE
Address range: 4743 to 4759
Santa Marta Ct
Length: 0.05 miles
Direction: SE-NW
Address range: 2929 to 2948
Direction: SE-NW
Address range: 2929 to 2948
Westover Ct
Length: 0.04 miles
Directions: N-S, SE-NW, SW-NE
Address range: 4700 to 4714
Directions: N-S, SE-NW, SW-NE
Address range: 4700 to 4714
Hillsboro Ct
Length: 0.04 miles
Direction: E-W
Direction: E-W
Skycrest Dr
Length: 0.03 miles
Directions: E-W, SE-NW
Directions: E-W, SE-NW
Woodcliff Ct
Length: 0.03 miles
Directions: E-W, SW-NE
Address range: 4722 to 4738
Directions: E-W, SW-NE
Address range: 4722 to 4738
Westfield Pl
Length: 0.02 miles
Direction: SW-NE
Address range: 4701 to 4729
Direction: SW-NE
Address range: 4701 to 4729