Castle Park neighborhood in Chula Vista, California (CA), 91911 detailed profile
Settings
X


Business Search - 14 Million verified businesses
Area: 0.312 square miles
Population: 3,741
Population density:
| Castle Park: | 11,984 people per square mile |
| Chula Vista: | 5,711 people per square mile |

- 2,97177.4%Hispanic or Latino
- 3719.7%Asian
- 1925.0%Two or more races
- 1874.9%White
- 892.3%Black
- 300.8%Native Hawaiian and Other
Pacific Islander

Median household income in 2022:
| Castle Park: | $76,581 |
| Chula Vista: | $101,190 |
Distribution of median household income
![Distribution of median household income]()
- 40Less than $10,000
- 134$10,000 to $19,999
- 67$20,000 to $29,999
- 320$30,000 to $39,999
- 211$40,000 to $49,999
- 134$50,000 to $59,999
- 182$60,000 to $74,999
- 149$75,000 to $99,999
- 107$100,000 to $124,999
- 134$125,000 to $149,999
- 42$150,000 to $199,999
- 49$200,000 or more

Distribution of owner-occupied house/condo value
![Distribution of owner-occupied house/condo value]()
- 10Less than $50,000
- 27$50,000 to $99,999
- 14$100,000 to $149,999
- 8$150,000 to $199,999
- 12$250,000 to $299,999
- 23$300,000 to $399,999
- 37$400,000 to $499,999
- 89$500,000 to $749,999
- 45$750,000 to $999,999
- 14$1,000,000 or more

Distribution of rent paid by renters
![Distribution of rent paid by renters]()
- 107$200 to $299
- 32$400 to $499
- 82$500 to $599
- 26$700 to $799
- 8$800 to $899
- 38$900 to $999
- 110$1,000 to $1,249
- 144$1,250 to $1,499
- 440$1,500 to $1,999
- 415$2,000 or more

Median rent in 2022:
| Castle Park: | $1,761 |
| Chula Vista: | $1,879 |
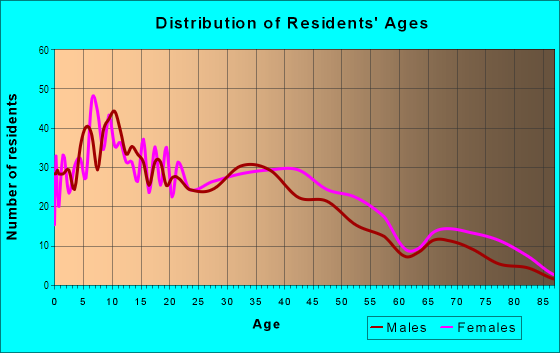
| Males: | 1,722 |
| Females: | 2,019 |
Males:
| This neighborhood: | 29.1 years |
| Whole city: | 34.8 years |
| This neighborhood: | 31.9 years |
| Whole city: | 37.4 years |
Average household size:
| Castle Park: | 3.6 people |
| Chula Vista: | 3.2 people |
Percentage of family households:
| Castle Park: | 63.7% |
| Chula Vista: | 57.2% |
| Here: | 34.4% |
| Chula Vista: | 54.5% |
Percentage of married-couple families with children (among all households):
| Castle Park: | 11.2% |
| Chula Vista: | 22.9% |
Percentage of single-mother households (among all households):
| Castle Park: | 15.2% |
| Chula Vista: | 5.5% |
Percentage of never married males 15 years old and over:
Percentage of never married females 15 years old and over:
| Castle Park: | 23.7% |
| Chula Vista: | 19.8% |
Percentage of never married females 15 years old and over:
| Castle Park: | 25.2% |
| city: | 16.5% |
Percentage of people that speak English not well or not at all:
| Castle Park: | 15.4% |
| Chula Vista: | 8.7% |
Percentage of people born in this state:
Percentage of people born in another U.S. state:
Percentage of native residents but born outside the U.S.:
Percentage of foreign born residents:
| Here: | 56.8% |
| Chula Vista: | 56.5% |
Percentage of people born in another U.S. state:
| Castle Park: | 6.3% |
| Chula Vista: | 13.1% |
Percentage of native residents but born outside the U.S.:
| Here: | 2.6% |
| city: | 2.8% |
Percentage of foreign born residents:
| Here: | 34.2% |
| Chula Vista: | 27.6% |

Owner-occupied
Renter-occupied


- Rooms in owner-occupied houses and condos in Castle Park
- 101 room
- 212 rooms
- 163 rooms
- 264 rooms
- 1655 rooms
- 1336 rooms
- 767 rooms
- 38 rooms
- 129+ rooms

- Rooms in renter-occupied apartments in Castle Park
- 411 room
- 1992 rooms
- 4783 rooms
- 1324 rooms
- 1005 rooms
- 1026 rooms
- 827 rooms
- 88 rooms
- 99+ rooms
Owner-occupied
Renter-occupied

- Bedrooms in owner-occupied houses and condos in Castle Park
- 10no bedroom
- 231 bedroom
- 302 bedrooms
- 3783 bedrooms
- 1104 bedrooms
- 185+ bedrooms

- Bedrooms in renter-occupied apartments in Castle Park
- 41no bedroom
- 3551 bedroom
- 4812 bedrooms
- 1243 bedrooms
- 84 bedrooms
- 05+ bedrooms
Average number of cars or other vehicles available in houses/condos:
Average number of cars or other vehicles available in apartments:
| This neighborhood: | |
| Chula Vista: |
Average number of cars or other vehicles available in apartments:
| Here: | 1.1 |
| city: | 1.7 |
Percentage of units with a mortgage:
| Castle Park: | 60.0% |
| Chula Vista: | 76.0% |

- Year house built in Castle Park
- 02020 or later
- 2142010 to 2019
- 1102000 to 2009
- 1041990 to 1999
- 2131980 to 1989
- 2491970 to 1979
- 2561960 to 1969
- 1661950 to 1959
- 2591940 to 1949
- 151939 or earlier

City-data.com crime index for city in 2020 (higher means more crime):
| City: | 159.8 |
| U.S. average: | 219.5 |
Travel time to work (commute)
![Travel time to work (commute)]()
- 9Less than 5 minutes
- 1115 to 9 minutes
- 15610 to 14 minutes
- 19015 to 19 minutes
- 22520 to 24 minutes
- 14025 to 29 minutes
- 20730 to 34 minutes
- 8035 to 39 minutes
- 6440 to 44 minutes
- 14845 to 59 minutes
- 6360 to 89 minutes
- 5390 or more minutes

Means of transportation to work
![Means of transportation to work]()
- 70.1%1,114Drove a car alone
- 11.0%175Carpooled
- 3.6%57Bus
- 2.1%33Light rail, streetcar or trolley
- 1.0%16Taxi
- 2.8%45Motorcycle
- 2.5%39Walked
- 4.8%76Other means
- 20.5%325Worked at home

Time leaving home to go to work
![Time leaving home to go to work]()
- 15612:00 a.m. to 4:59 a.m.
- 745:00 a.m. to 5:29 a.m.
- 735:30 a.m. to 5:59 a.m.
- 856:00 a.m. to 6:29 a.m.
- 2276:30 a.m. to 6:59 a.m.
- 2897:00 a.m. to 7:29 a.m.
- 877:30 a.m. to 7:59 a.m.
- 1578:00 a.m. to 8:29 a.m.
- 548:30 a.m. to 8:59 a.m.
- 569:00 a.m. to 9:59 a.m.
- 4310:00 a.m. to 10:59 a.m.
- 3311:00 a.m. to 11:59 a.m.
- 9512:00 p.m. to 3:59 p.m.
- 494:00 p.m. to 11:59 p.m.

Occupations of males:
- Percentage of males in management occupations (except farmers):
Here: 1.5% city: 9.9%
- Percentage of males in business and financial operations occupations:
Here: 9.6% city: 6.5%
- Percentage of males in computer and mathematical occupations:
Here: 1.7% city: 4.9%
- Percentage of males in architecture and engineering occupations:
Here: 1.5% city: 4.8%
- Percentage of males in education, training, and library occupations:
Here: 2.9% city: 2.3%
- Percentage of males in healthcare practitioners and technical occupations:
Here: 1.7% city: 3.0%
- Percentage of males in service occupations:
Here: 18.4% city: 18.4%
- Percentage of males in sales and office occupations:
Here: 10.5% city: 16.0%
- Percentage of males in construction, extraction, and maintenance occupations:
Here: 8.4% city: 9.2%
- Percentage of males in production occupations:
Here: 15.6% city: 5.7%
- Percentage of males in transportation occupations:
Here: 4.0% city: 5.1%
- Percentage of males in material moving occupations:
Here: 15.7% city: 3.7%
Occupations of females:
- Percentage of females in management occupations (except farmers):
Here: 1.1% city: 8.6%
- Percentage of females in architecture and engineering occupations:
Here: 1.0% city: 1.0%
- Percentage of females in legal occupations:
Here: 1.2% city: 1.1%
- Percentage of females in education, training, and library occupations:
Here: 3.5% city: 7.6%
- Percentage of females in arts, design, entertainment, sports, and media occupations:
Here: 5.1% city: 1.2%
- Percentage of females in healthcare practitioners and technical occupations:
Here: 5.8% city: 10.6%
- Percentage of females in service occupations:
Here: 29.9% city: 22.6%
- Percentage of females in sales and office occupations:
Here: 43.3% city: 29.5%
- Percentage of females in farming, fishing, and forestry occupations:
Here: 4.4% city: 0.4%
- Percentage of females in production occupations:
Here: 2.1% city: 3.0%
Percentage of people 16-64 in Armed Forces:
| Castle Park: | 1.3% |
| Chula Vista: | 4.1% |
Education in this neighborhood (subdivision or community):
- Percentage of people 3 years and older in K-12 schools:
Castle Park: 34.2% Chula Vista: 22.0%
- Percentage of people 3 years and older in undergraduate colleges:
Castle Park: 6.6% Chula Vista: 7.6%
- Percentage of people 3 years and older in grad. or professional schools:
Castle Park: 1.6% Chula Vista: 1.2%
- Percentage of students K-12 enrolled in private schools:
Castle Park: 30.6% Chula Vista: 7.0%
Percentage of population below poverty level:
| Castle Park: | 12.6% |
| Chula Vista: | 10.1% |
Median year renter moved in (as recorded in 2022):
| Castle Park: | 2016 |
| Chula Vista: | 2018 |
Percentage of married-couple families with both working:
| Castle Park: | 69.5% |
| Chula Vista: | 69.2% |

- 54.3%Utility gas
- 29.6%Electricity
- 7.5%Bottled, tank, or LP gas
- 6.2%No fuel used
- 2.4%Solar energy
Roads and streets:
Palomar St
Length: 0.67 miles
Direction: E-W
Address range: 50 to 279
Direction: E-W
Address range: 50 to 279
Oxford St
Length: 0.63 miles
Direction: E-W
Address range: 50 to 268
Direction: E-W
Address range: 50 to 268
Emerson St
Length: 0.49 miles
Direction: E-W
Address range: 100 to 266
Direction: E-W
Address range: 100 to 266
2nd Ave
Length: 0.38 miles
Direction: N-S
Address range: 1150 to 1299
Direction: N-S
Address range: 1150 to 1299
1st Ave
Length: 0.38 miles
Directions: N-S, SE-NW
Address range: 1150 to 1299
Directions: N-S, SE-NW
Address range: 1150 to 1299
Tobias Dr
Length: 0.26 miles
Direction: N-S
Address range: 1200 to 1299
Direction: N-S
Address range: 1200 to 1299
Kennedy St
Length: 0.24 miles
Direction: E-W
Address range: 200 to 281
Direction: E-W
Address range: 200 to 281
Elm Ave
Length: 0.22 miles
Directions: E-W, N-S, SE-NW
Address range: 1150 to 1299
Directions: E-W, N-S, SE-NW
Address range: 1150 to 1299
Glenhaven Way
Length: 0.18 miles
Direction: E-W
Address range: 100 to 199
Direction: E-W
Address range: 100 to 199
Ski Way
Length: 0.14 miles
Direction: E-W
Address range: 144 to 199
Direction: E-W
Address range: 144 to 199
Twin Oaks Ave
Length: 0.13 miles
Direction: N-S
Address range: 1151 to 1199
Direction: N-S
Address range: 1151 to 1199
del Mar Ave
Length: 0.13 miles
Direction: N-S
Address range: 1150 to 1199
Direction: N-S
Address range: 1150 to 1199
Alpine Ave
Length: 0.13 miles
Direction: N-S
Address range: 1150 to 1199
Direction: N-S
Address range: 1150 to 1199
Leoma Ln
Length: 0.11 miles
Direction: E-W
Address range: 100 to 154
Direction: E-W
Address range: 100 to 154
Henry Ln
Length: 0.11 miles
Direction: E-W
Address range: 100 to 149
Direction: E-W
Address range: 100 to 149
Dixon Way
Length: 0.09 miles
Directions: N-S, SW-NE
Address range: 1200 to 1299
Directions: N-S, SW-NE
Address range: 1200 to 1299
Amy St
Length: 0.06 miles
Directions: E-W, SE-NW, SW-NE
Address range: 100 to 199
Directions: E-W, SE-NW, SW-NE
Address range: 100 to 199
Gentry Ln
Length: 0.04 miles
Direction: E-W
Direction: E-W