Chandon neighborhood in Laguna Niguel, California (CA), 92677 detailed profile
Settings
X


Business Search - 14 Million verified businesses
Area: 0.130 square miles
Population: 851
Population density:
| Chandon: | 6,554 people per square mile |
| Laguna Niguel: | 4,383 people per square mile |

- 55359.7%Hispanic or Latino
- 26628.7%White
- 869.3%Asian
- 80.9%Black
- 70.8%Two or more races
- 60.6%Some other race

Median household income in 2022:
| Chandon: | $176,078 |
| Laguna Niguel: | $135,822 |
Distribution of median household income
![Distribution of median household income]()
- 9Less than $10,000
- 7$10,000 to $19,999
- 45$20,000 to $29,999
- 21$30,000 to $39,999
- 52$40,000 to $49,999
- 21$50,000 to $59,999
- 62$60,000 to $74,999
- 48$75,000 to $99,999
- 14$100,000 to $124,999
- 16$125,000 to $149,999
- 26$150,000 to $199,999
- 49$200,000 or more

Distribution of owner-occupied house/condo value
![Distribution of owner-occupied house/condo value]()
- 2Less than $50,000
- 7$100,000 to $149,999
- 3$200,000 to $249,999
- 4$300,000 to $399,999
- 4$400,000 to $499,999
- 13$500,000 to $749,999
- 42$750,000 to $999,999
- 109$1,000,000 or more

Distribution of rent paid by renters
![Distribution of rent paid by renters]()
- 183Less than $100
- 40$500 to $599
- 10$800 to $899
- 47$1,500 to $1,999
- 271$2,000 or more

Median rent in 2022:
| Chandon: | $2,589 |
| Laguna Niguel: | $2,001 |
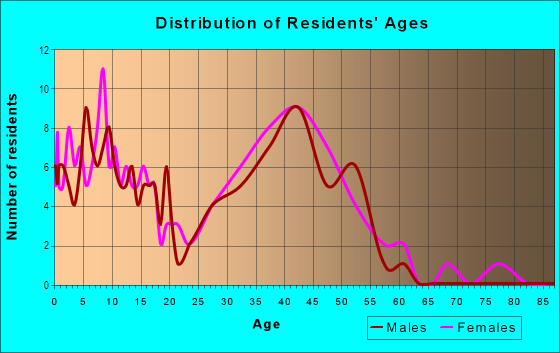
| Males: | 413 |
| Females: | 437 |
Males:
| This neighborhood: | 46.5 years |
| Whole city: | 45.5 years |
| This neighborhood: | 50.8 years |
| Whole city: | 48.2 years |
Average household size:
| Chandon: | 6.5 people |
| Laguna Niguel: | 2.5 people |
Percentage of family households:
| Chandon: | 51.4% |
| Laguna Niguel: | 45.5% |
| Here: | 43.2% |
| Laguna Niguel: | 57.2% |
Percentage of married-couple families with children (among all households):
| Chandon: | 16.7% |
| Laguna Niguel: | 32.0% |
Percentage of single-mother households (among all households):
| Chandon: | 16.9% |
| Laguna Niguel: | 5.1% |
Percentage of never married males 15 years old and over:
Percentage of never married females 15 years old and over:
| Chandon: | 17.0% |
| Laguna Niguel: | 14.2% |
Percentage of never married females 15 years old and over:
| Chandon: | 17.8% |
| city: | 13.7% |
Percentage of people that speak English not well or not at all:
| Chandon: | 23.5% |
| Laguna Niguel: | 3.6% |
Percentage of people born in this state:
Percentage of people born in another U.S. state:
Percentage of native residents but born outside the U.S.:
Percentage of foreign born residents:
| Here: | 54.0% |
| Laguna Niguel: | 48.2% |
Percentage of people born in another U.S. state:
| Chandon: | 16.9% |
| Laguna Niguel: | 26.5% |
Percentage of native residents but born outside the U.S.:
| Here: | 1.4% |
| city: | 2.0% |
Percentage of foreign born residents:
| Here: | 27.7% |
| Laguna Niguel: | 23.3% |

Owner-occupied
Renter-occupied


- Rooms in owner-occupied houses and condos in Chandon
- 01 room
- 02 rooms
- 53 rooms
- 94 rooms
- 165 rooms
- 436 rooms
- 147 rooms
- 268 rooms
- 459+ rooms

- Rooms in renter-occupied apartments in Chandon
- 331 room
- 42 rooms
- 763 rooms
- 1044 rooms
- 245 rooms
- 146 rooms
- 107 rooms
- 78 rooms
- 379+ rooms
Owner-occupied
Renter-occupied

- Bedrooms in owner-occupied houses and condos in Chandon
- 0no bedroom
- 01 bedroom
- 172 bedrooms
- 593 bedrooms
- 504 bedrooms
- 335+ bedrooms

- Bedrooms in renter-occupied apartments in Chandon
- 33no bedroom
- 661 bedroom
- 1172 bedrooms
- 283 bedrooms
- 434 bedrooms
- 85+ bedrooms
Average number of cars or other vehicles available in houses/condos:
Average number of cars or other vehicles available in apartments:
| This neighborhood: | |
| Laguna Niguel: |
Average number of cars or other vehicles available in apartments:
| Here: | 1.9 |
| city: | 1.8 |
Percentage of units with a mortgage:
| Chandon: | 62.9% |
| Laguna Niguel: | 69.6% |

- Year house built in Chandon
- 52020 or later
- 292010 to 2019
- 152000 to 2009
- 861990 to 1999
- 1111980 to 1989
- 611970 to 1979
- 41960 to 1969
- 81950 to 1959
- 261940 to 1949
- 21939 or earlier

City-data.com crime index for city in 2020 (higher means more crime):
| City: | 62.1 |
| U.S. average: | 219.5 |
Travel time to work (commute)
![Travel time to work (commute)]()
- 2Less than 5 minutes
- 265 to 9 minutes
- 5110 to 14 minutes
- 10815 to 19 minutes
- 5520 to 24 minutes
- 2925 to 29 minutes
- 5030 to 34 minutes
- 635 to 39 minutes
- 3540 to 44 minutes
- 1245 to 59 minutes
- 1060 to 89 minutes
- 1190 or more minutes

Means of transportation to work
![Means of transportation to work]()
- 74.3%330Drove a car alone
- 9.9%44Carpooled
- 0.7%3Long-distance train or commuter rail
- 0.7%3Bicycle
- 15.3%68Walked
- 5.6%25Other means
- 31.3%139Worked at home

Time leaving home to go to work
![Time leaving home to go to work]()
- 3212:00 a.m. to 4:59 a.m.
- 115:00 a.m. to 5:29 a.m.
- 195:30 a.m. to 5:59 a.m.
- 336:00 a.m. to 6:29 a.m.
- 246:30 a.m. to 6:59 a.m.
- 317:00 a.m. to 7:29 a.m.
- 197:30 a.m. to 7:59 a.m.
- 418:00 a.m. to 8:29 a.m.
- 368:30 a.m. to 8:59 a.m.
- 339:00 a.m. to 9:59 a.m.
- 1410:00 a.m. to 10:59 a.m.
- 1111:00 a.m. to 11:59 a.m.
- 4712:00 p.m. to 3:59 p.m.
- 374:00 p.m. to 11:59 p.m.

Occupations of males:
- Percentage of males in management occupations (except farmers):
Here: 7.4% city: 18.9%
- Percentage of males in business and financial operations occupations:
Here: 7.0% city: 9.3%
- Percentage of males in architecture and engineering occupations:
Here: 4.4% city: 6.2%
- Percentage of males in community and social services occupations:
Here: 1.6% city: 0.7%
- Percentage of males in legal occupations:
Here: 1.4% city: 2.8%
- Percentage of males in arts, design, entertainment, sports, and media occupations:
Here: 1.1% city: 2.9%
- Percentage of males in healthcare practitioners and technical occupations:
Here: 1.1% city: 4.6%
- Percentage of males in service occupations:
Here: 26.4% city: 11.4%
- Percentage of males in sales and office occupations:
Here: 14.2% city: 21.5%
- Percentage of males in construction, extraction, and maintenance occupations:
Here: 9.4% city: 3.7%
- Percentage of males in production occupations:
Here: 2.1% city: 2.1%
- Percentage of males in transportation occupations:
Here: 2.0% city: 1.2%
- Percentage of males in material moving occupations:
Here: 13.7% city: 2.4%
Occupations of females:
- Percentage of females in management occupations (except farmers):
Here: 8.8% city: 12.8%
- Percentage of females in business and financial operations occupations:
Here: 4.4% city: 10.2%
- Percentage of females in computer and mathematical occupations:
Here: 1.1% city: 3.0%
- Percentage of females in community and social services occupations:
Here: 1.1% city: 2.3%
- Percentage of females in legal occupations:
Here: 1.7% city: 2.5%
- Percentage of females in education, training, and library occupations:
Here: 5.1% city: 7.6%
- Percentage of females in healthcare practitioners and technical occupations:
Here: 3.5% city: 10.1%
- Percentage of females in service occupations:
Here: 40.8% city: 18.3%
- Percentage of females in sales and office occupations:
Here: 27.2% city: 25.8%
- Percentage of females in production occupations:
Here: 1.8% city: 0.8%
- Percentage of females in material moving occupations:
Here: 3.6% city: 0.5%
Percentage of people 16-64 in Armed Forces:
| Chandon: | 0.8% |
| Laguna Niguel: | 0.3% |
Education in this neighborhood (subdivision or community):
- Percentage of people 3 years and older in K-12 schools:
Chandon: 28.1% Laguna Niguel: 13.6%
- Percentage of people 3 years and older in undergraduate colleges:
Chandon: 3.5% Laguna Niguel: 5.5%
- Percentage of people 3 years and older in grad. or professional schools:
Chandon: 7.9% Laguna Niguel: 1.8%
- Percentage of students K-12 enrolled in private schools:
Chandon: 21.4% Laguna Niguel: 17.8%
Percentage of population below poverty level:
| Chandon: | 7.0% |
| Laguna Niguel: | 7.4% |
Median year renter moved in (as recorded in 2022):
| Chandon: | 2017 |
| Laguna Niguel: | 2018 |
Percentage of married-couple families with both working:
| Chandon: | 111.8% |
| Laguna Niguel: | 64.1% |

- 72.7%Utility gas
- 18.8%Electricity
- 4.5%Bottled, tank, or LP gas
- 2.7%Solar energy
- 1.3%No fuel used
Roads and streets:
Chandon
Length: 0.48 miles
Directions: E-W, N-S, SE-NW, SW-NE
Address range: 1 to 299
Directions: E-W, N-S, SE-NW, SW-NE
Address range: 1 to 299
Marina Hills Dr
Length: 0.48 miles
Directions: E-W, SW-NE
Directions: E-W, SW-NE
Parc Vis
Length: 0.30 miles
Directions: N-S, SE-NW, SW-NE
Directions: N-S, SE-NW, SW-NE
Argos
Length: 0.22 miles
Directions: E-W, SE-NW, SW-NE
Address range: 1 to 99
Directions: E-W, SE-NW, SW-NE
Address range: 1 to 99
Fleurance St
Length: 0.19 miles
Directions: N-S, SW-NE
Address range: 30 to 299
Directions: N-S, SW-NE
Address range: 30 to 299
Solare St
Length: 0.17 miles
Directions: E-W, N-S, SE-NW, SW-NE
Directions: E-W, N-S, SE-NW, SW-NE
Brindisi
Length: 0.13 miles
Directions: E-W, N-S, SE-NW, SW-NE
Address range: 1 to 83
Directions: E-W, N-S, SE-NW, SW-NE
Address range: 1 to 83
Saint Germain
Length: 0.04 miles
Directions: N-S, SE-NW
Directions: N-S, SE-NW
Golden Lantern (Street of the Golden Lantern)
Length: 0.02 miles
Directions: E-W, N-S
Address range: 30168 to 30199
Directions: E-W, N-S
Address range: 30168 to 30199