Civic Center neighborhood in Gardena, California (CA), 90247 detailed profile
Settings
X


Business Search - 14 Million verified businesses
Area: 0.221 square miles
Population: 2,235
Population density:
| Civic Center: | 10,126 people per square mile |
| Gardena: | 10,373 people per square mile |

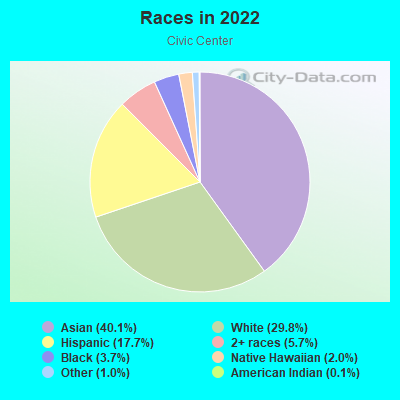
- 1,04245.8%Asian
- 79935.1%Hispanic or Latino
- 1586.9%White
- 1566.9%Two or more races
- 793.5%Black
- 221.0%Some other race
- 210.9%American Indian
Median household income in 2022:
| Civic Center: | $67,532 |
| Gardena: | $75,443 |
Distribution of median household income
![Distribution of median household income]()
- 74Less than $10,000
- 74$10,000 to $19,999
- 92$20,000 to $29,999
- 81$30,000 to $39,999
- 116$40,000 to $49,999
- 57$50,000 to $59,999
- 118$60,000 to $74,999
- 113$75,000 to $99,999
- 102$100,000 to $124,999
- 59$125,000 to $149,999
- 92$150,000 to $199,999
- 24$200,000 or more

Distribution of owner-occupied house/condo value
![Distribution of owner-occupied house/condo value]()
- 71Less than $50,000
- 143$50,000 to $99,999
- 16$100,000 to $149,999
- 26$200,000 to $249,999
- 19$300,000 to $399,999
- 78$400,000 to $499,999
- 125$500,000 to $749,999
- 88$750,000 to $999,999
- 104$1,000,000 or more

Distribution of rent paid by renters
![Distribution of rent paid by renters]()
- 39$700 to $799
- 32$800 to $899
- 58$900 to $999
- 88$1,000 to $1,249
- 120$1,250 to $1,499
- 199$1,500 to $1,999
- 121$2,000 or more

Median rent in 2022:
| Civic Center: | $1,596 |
| Gardena: | $1,537 |
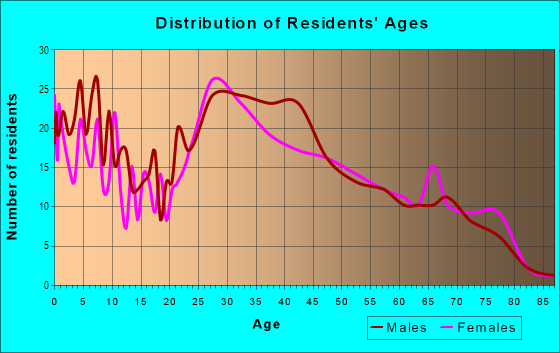
| Males: | 1,099 |
| Females: | 1,136 |
Males:
| This neighborhood: | 41.6 years |
| Whole city: | 39.1 years |
| This neighborhood: | 50.1 years |
| Whole city: | 40.8 years |
Average household size:
| Civic Center: | 2.5 people |
| Gardena: | 2.9 people |
Percentage of family households:
| Civic Center: | 41.5% |
| Gardena: | 46.2% |
| Here: | 41.6% |
| Gardena: | 44.3% |
Percentage of married-couple families with children (among all households):
| Civic Center: | 29.6% |
| Gardena: | 22.0% |
Percentage of single-mother households (among all households):
| Civic Center: | 8.9% |
| Gardena: | 8.2% |
Percentage of never married males 15 years old and over:
Percentage of never married females 15 years old and over:
| Civic Center: | 20.3% |
| Gardena: | 20.2% |
Percentage of never married females 15 years old and over:
| Civic Center: | 15.7% |
| city: | 20.0% |
Percentage of people that speak English not well or not at all:
| Civic Center: | 22.4% |
| Gardena: | 14.0% |
Percentage of people born in this state:
Percentage of people born in another U.S. state:
Percentage of native residents but born outside the U.S.:
Percentage of foreign born residents:
| Here: | 44.1% |
| Gardena: | 49.4% |
Percentage of people born in another U.S. state:
| Civic Center: | 10.0% |
| Gardena: | 11.0% |
Percentage of native residents but born outside the U.S.:
| Here: | 0.7% |
| city: | 1.4% |
Percentage of foreign born residents:
| Here: | 45.1% |
| Gardena: | 38.1% |
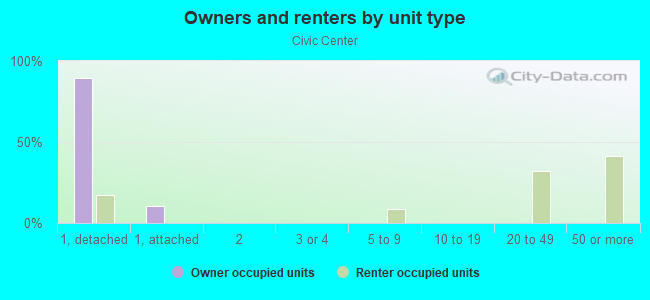
Owner-occupied
Renter-occupied

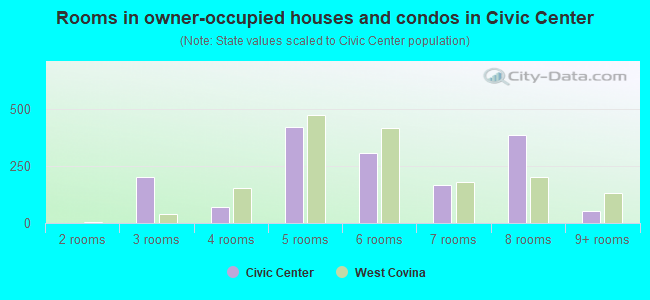
- Rooms in owner-occupied houses and condos in Civic Center
- 871 room
- 392 rooms
- 373 rooms
- 594 rooms
- 1025 rooms
- 2116 rooms
- 497 rooms
- 348 rooms
- 309+ rooms
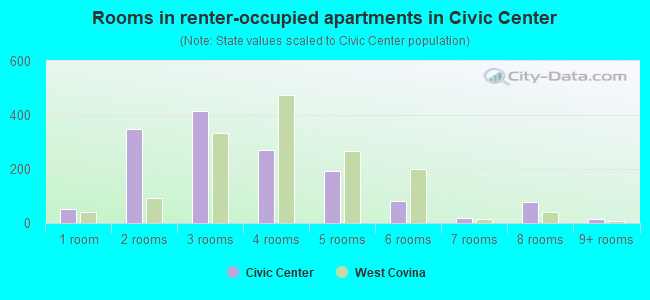
- Rooms in renter-occupied apartments in Civic Center
- 311 room
- 162 rooms
- 1583 rooms
- 2554 rooms
- 805 rooms
- 466 rooms
- 207 rooms
- 128 rooms
- 09+ rooms
Owner-occupied
Renter-occupied
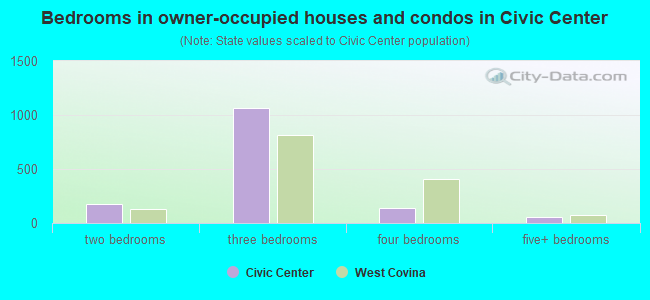
- Bedrooms in owner-occupied houses and condos in Civic Center
- 87no bedroom
- 381 bedroom
- 682 bedrooms
- 1853 bedrooms
- 614 bedrooms
- 05+ bedrooms
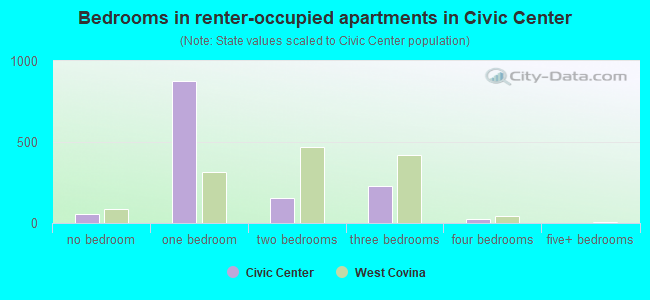
- Bedrooms in renter-occupied apartments in Civic Center
- 30no bedroom
- 1001 bedroom
- 3382 bedrooms
- 1303 bedrooms
- 244 bedrooms
- 85+ bedrooms
Average number of cars or other vehicles available in houses/condos:
Average number of cars or other vehicles available in apartments:
| This neighborhood: | 1.8 |
| Gardena: | 2.1 |
Average number of cars or other vehicles available in apartments:
| Here: | 1.5 |
| city: | 1.7 |
Percentage of units with a mortgage:
| Civic Center: | 64.2% |
| Gardena: | 62.7% |
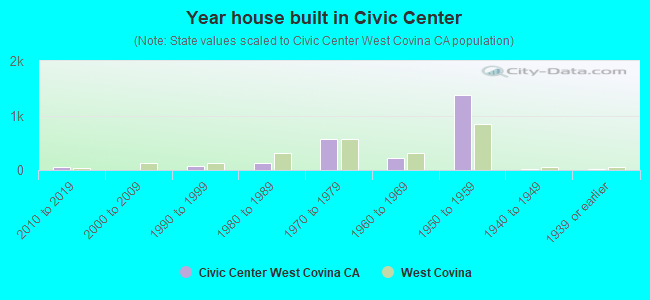
- Year house built in Civic Center
- 2502020 or later
- 432010 to 2019
- 882000 to 2009
- 1031990 to 1999
- 911980 to 1989
- 1311970 to 1979
- 1051960 to 1969
- 2301950 to 1959
- 1251940 to 1949
- 771939 or earlier
City-data.com crime index for city in 2020 (higher means more crime):
| City: | 270.8 |
| U.S. average: | 219.5 |
Travel time to work (commute)
![Travel time to work (commute)]()
- 725 to 9 minutes
- 12110 to 14 minutes
- 13015 to 19 minutes
- 15920 to 24 minutes
- 9525 to 29 minutes
- 14630 to 34 minutes
- 2135 to 39 minutes
- 5240 to 44 minutes
- 11545 to 59 minutes
- 5160 to 89 minutes
- 2590 or more minutes

Means of transportation to work
![Means of transportation to work]()
- 72.5%809Drove a car alone
- 15.7%175Carpooled
- 4.1%46Bus
- 1.2%13Bicycle
- 4.6%51Walked
- 2.1%23Other means
- 6.6%74Worked at home

Time leaving home to go to work
![Time leaving home to go to work]()
- 5212:00 a.m. to 4:59 a.m.
- 345:00 a.m. to 5:29 a.m.
- 605:30 a.m. to 5:59 a.m.
- 556:00 a.m. to 6:29 a.m.
- 436:30 a.m. to 6:59 a.m.
- 1337:00 a.m. to 7:29 a.m.
- 977:30 a.m. to 7:59 a.m.
- 1478:00 a.m. to 8:29 a.m.
- 768:30 a.m. to 8:59 a.m.
- 929:00 a.m. to 9:59 a.m.
- 3610:00 a.m. to 10:59 a.m.
- 2611:00 a.m. to 11:59 a.m.
- 12212:00 p.m. to 3:59 p.m.
- 204:00 p.m. to 11:59 p.m.

Occupations of males:
- Percentage of males in management occupations (except farmers):
Here: 10.1% city: 10.4%
- Percentage of males in business and financial operations occupations:
Here: 3.9% city: 4.4%
- Percentage of males in computer and mathematical occupations:
Here: 2.9% city: 2.7%
- Percentage of males in architecture and engineering occupations:
Here: 4.8% city: 3.6%
- Percentage of males in community and social services occupations:
Here: 4.8% city: 1.7%
- Percentage of males in education, training, and library occupations:
Here: 1.2% city: 1.2%
- Percentage of males in arts, design, entertainment, sports, and media occupations:
Here: 1.7% city: 2.9%
- Percentage of males in healthcare practitioners and technical occupations:
Here: 3.3% city: 2.0%
- Percentage of males in service occupations:
Here: 16.5% city: 17.0%
- Percentage of males in sales and office occupations:
Here: 24.4% city: 20.2%
- Percentage of males in construction, extraction, and maintenance occupations:
Here: 4.9% city: 8.1%
- Percentage of males in production occupations:
Here: 6.9% city: 6.4%
- Percentage of males in transportation occupations:
Here: 4.4% city: 7.0%
- Percentage of males in material moving occupations:
Here: 2.4% city: 7.2%
Occupations of females:
- Percentage of females in management occupations (except farmers):
Here: 10.9% city: 7.3%
- Percentage of females in business and financial operations occupations:
Here: 6.1% city: 4.6%
- Percentage of females in community and social services occupations:
Here: 1.7% city: 2.4%
- Percentage of females in legal occupations:
Here: 1.9% city: 1.8%
- Percentage of females in education, training, and library occupations:
Here: 5.1% city: 7.9%
- Percentage of females in healthcare practitioners and technical occupations:
Here: 6.4% city: 7.5%
- Percentage of females in service occupations:
Here: 19.6% city: 25.0%
- Percentage of females in sales and office occupations:
Here: 25.1% city: 29.5%
- Percentage of females in construction, extraction, and maintenance occupations:
Here: 2.7% city: 0.2%
- Percentage of females in production occupations:
Here: 8.9% city: 3.4%
- Percentage of females in transportation occupations:
Here: 2.8% city: 2.2%
- Percentage of females in material moving occupations:
Here: 6.3% city: 3.2%
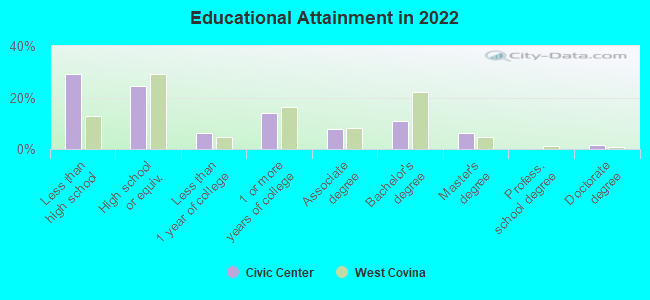
Education in this neighborhood (subdivision or community):
- Percentage of people 3 years and older in K-12 schools:
Civic Center: 17.1% Gardena: 16.3%
- Percentage of people 3 years and older in undergraduate colleges:
Civic Center: 6.6% Gardena: 6.9%
- Percentage of people 3 years and older in grad. or professional schools:
Civic Center: 3.2% Gardena: 1.3%
- Percentage of students K-12 enrolled in private schools:
Civic Center: 49.9% Gardena: 11.0%
Percentage of population below poverty level:
| Civic Center: | 12.1% |
| Gardena: | 11.1% |
Median year owner moved in (as recorded in 2022):
Median year renter moved in (as recorded in 2022):
| Civic Center: | 2003 |
| Gardena: | 2004 |
Median year renter moved in (as recorded in 2022):
| Civic Center: | 2013 |
| Gardena: | 2014 |
Percentage of married-couple families with both working:
| Civic Center: | 64.1% |
| Gardena: | 72.2% |
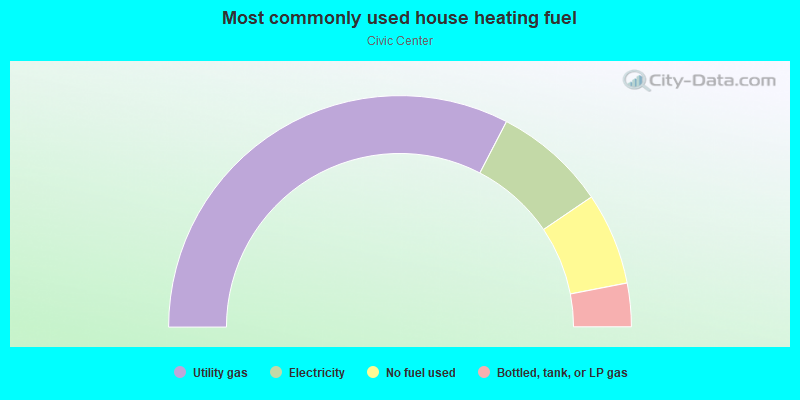
- 60.2%Utility gas
- 23.9%Electricity
- 6.5%No fuel used
- 5.5%Bottled, tank, or LP gas
- 3.9%Other fuel
Roads and streets:
W 166th St
Length: 0.49 miles
Direction: E-W
Address range: 1508 to 1834
Direction: E-W
Address range: 1508 to 1834
W 162nd St
Length: 0.49 miles
Direction: E-W
Address range: 1529 to 1831
Direction: E-W
Address range: 1529 to 1831
W Gardena Blvd
Length: 0.49 miles
Direction: E-W
Address range: 1521 to 1829
Direction: E-W
Address range: 1521 to 1829
S Western Ave
Length: 0.37 miles
Direction: N-S
Address range: 16200 to 16899
Direction: N-S
Address range: 16200 to 16899
Denker Ave
Length: 0.37 miles
Direction: N-S
Address range: 16200 to 16899
Direction: N-S
Address range: 16200 to 16899
W 168th St
Length: 0.30 miles
Direction: E-W
Address range: 1600 to 1799
Direction: E-W
Address range: 1600 to 1799
Hobart Blvd
Length: 0.27 miles
Direction: N-S
Address range: 16100 to 16799
Direction: N-S
Address range: 16100 to 16799
Manhattan Pl
Length: 0.25 miles
Direction: N-S
Address range: 16200 to 16599
Direction: N-S
Address range: 16200 to 16599
Dalton Ave
Length: 0.25 miles
Direction: N-S
Address range: 16200 to 16599
Direction: N-S
Address range: 16200 to 16599
la Salle Ave
Length: 0.21 miles
Direction: N-S
Address range: 16400 to 16895
Direction: N-S
Address range: 16400 to 16895
S Harvard Blvd
Length: 0.15 miles
Direction: N-S
Address range: 16152 to 16599
Direction: N-S
Address range: 16152 to 16599
W 165th Pl
Length: 0.15 miles
Direction: E-W
Address range: 1700 to 1799
Direction: E-W
Address range: 1700 to 1799
S Dalton Ave
Length: 0.12 miles
Direction: N-S
Address range: 16600 to 16899
Direction: N-S
Address range: 16600 to 16899
W 169th St
Length: 0.07 miles
Direction: E-W
Address range: 1532 to 1599
Direction: E-W
Address range: 1532 to 1599
Railroad features:
Southern Pacific RR
Length: 0.37 miles
Direction: E-W
Direction: E-W