Downtown neighborhood in Chester, Pennsylvania (PA), 19013 detailed profile
Settings
X


Business Search - 14 Million verified businesses
Area: 0.090 square miles
Population: 1,191
Population density:
| Downtown: | 13,247 people per square mile |
| Chester: | 6,820 people per square mile |

- 1,04687.2%Black
- 937.8%Hispanic or Latino
- 463.8%Two or more races
- 131.1%White
- 10.08%American Indian

Distribution of median household income
![Distribution of median household income]()
- 100Less than $10,000
- 73$10,000 to $19,999
- 75$20,000 to $29,999
- 65$30,000 to $39,999
- 58$40,000 to $49,999
- 38$50,000 to $59,999
- 29$60,000 to $74,999
- 60$75,000 to $99,999
- 13$100,000 to $124,999
- 18$125,000 to $149,999
- 29$150,000 to $199,999
- 12$200,000 or more

Distribution of owner-occupied house/condo value
![Distribution of owner-occupied house/condo value]()
- 205Less than $50,000
- 186$50,000 to $99,999
- 8$100,000 to $149,999
- 8$150,000 to $199,999
- 12$200,000 to $249,999
- 2$400,000 to $499,999
- 4$500,000 to $749,999

Distribution of rent paid by renters
![Distribution of rent paid by renters]()
- 5Less than $100
- 76$100 to $199
- 10$200 to $299
- 6$300 to $399
- 6$400 to $499
- 26$500 to $599
- 11$600 to $699
- 57$700 to $799
- 43$800 to $899
- 101$900 to $999
- 29$1,000 to $1,249
- 3$1,250 to $1,499
- 3$2,000 or more

Median rent in 2022:
| Downtown: | $906 |
| Chester: | $864 |
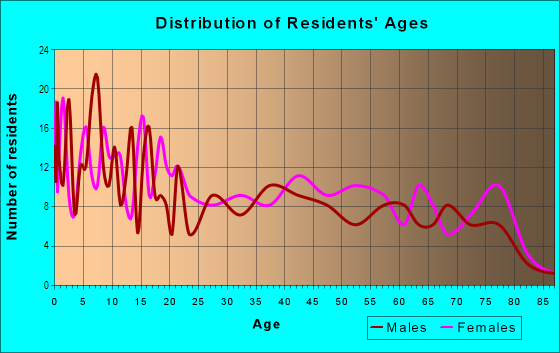
| Males: | 522 |
| Females: | 668 |
Males:
| This neighborhood: | 21.3 years |
| Whole city: | 31.6 years |
| This neighborhood: | 25.2 years |
| Whole city: | 34.7 years |
Average household size:
| Downtown: | 3.1 people |
| Chester: | 2.4 people |
Percentage of family households:
| Downtown: | 56.7% |
| Chester: | 41.2% |
| Here: | 19.5% |
| Chester: | 16.4% |
Percentage of married-couple families with children (among all households):
| Downtown: | 4.5% |
| Chester: | 6.8% |
Percentage of single-mother households (among all households):
| Downtown: | 28.3% |
| Chester: | 26.4% |
Percentage of never married males 15 years old and over:
Percentage of never married females 15 years old and over:
| Downtown: | 29.9% |
| Chester: | 29.6% |
Percentage of never married females 15 years old and over:
| Downtown: | 38.0% |
| city: | 33.6% |
Percentage of people that speak English not well or not at all:
| Downtown: | 0.0% |
| Chester: | 1.0% |
Percentage of people born in this state:
Percentage of people born in another U.S. state:
Percentage of native residents but born outside the U.S.:
Percentage of foreign born residents:
| Here: | 79.2% |
| Chester: | 79.8% |
Percentage of people born in another U.S. state:
| Downtown: | 15.1% |
| Chester: | 14.3% |
Percentage of native residents but born outside the U.S.:
| Here: | 4.9% |
| city: | 2.7% |
Percentage of foreign born residents:
| Here: | 3.9% |
| Chester: | 3.2% |

Owner-occupied
Renter-occupied


- Rooms in owner-occupied houses and condos in Downtown
- 01 room
- 02 rooms
- 03 rooms
- 04 rooms
- 485 rooms
- 1166 rooms
- 197 rooms
- 38 rooms
- 29+ rooms

- Rooms in renter-occupied apartments in Downtown
- 81 room
- 72 rooms
- 333 rooms
- 164 rooms
- 245 rooms
- 1256 rooms
- 597 rooms
- 168 rooms
- 179+ rooms
Owner-occupied
Renter-occupied

- Bedrooms in owner-occupied houses and condos in Downtown
- 0no bedroom
- 01 bedroom
- 362 bedrooms
- 873 bedrooms
- 294 bedrooms
- 85+ bedrooms

- Bedrooms in renter-occupied apartments in Downtown
- 8no bedroom
- 331 bedroom
- 172 bedrooms
- 1763 bedrooms
- 434 bedrooms
- 25+ bedrooms
Average number of cars or other vehicles available in houses/condos:
Average number of cars or other vehicles available in apartments:
| This neighborhood: | 1.1 |
| Chester: | 1.4 |
Average number of cars or other vehicles available in apartments:
| Here: | 0.5 |
| city: | 0.8 |
Percentage of units with a mortgage:
| Downtown: | 56.8% |
| Chester: | 45.9% |
Housing prices:
- Average estimated value of detached houses in 2022 (8.4% of all units):
Downtown: $61,276 Pennsylvania: $317,202
- Average estimated value of townhouses or other attached units in 2022 (82.3% of all units):
This neighborhood: $80,947 Pennsylvania: $254,369

- Year house built in Downtown
- 12020 or later
- 262010 to 2019
- 222000 to 2009
- 261990 to 1999
- 291980 to 1989
- 41970 to 1979
- 481960 to 1969
- 581950 to 1959
- 621940 to 1949
- 3411939 or earlier

City-data.com crime index for city in 2020 (higher means more crime):
| City: | 260.5 |
| U.S. average: | 219.5 |
Travel time to work (commute)
![Travel time to work (commute)]()
- 17Less than 5 minutes
- 385 to 9 minutes
- 5310 to 14 minutes
- 11715 to 19 minutes
- 3420 to 24 minutes
- 2425 to 29 minutes
- 2230 to 34 minutes
- 235 to 39 minutes
- 3440 to 44 minutes
- 1145 to 59 minutes
- 1560 to 89 minutes
- 190 or more minutes

Means of transportation to work
![Means of transportation to work]()
- 56.9%231Drove a car alone
- 13.3%54Carpooled
- 11.3%46Bus
- 11.3%46Long-distance train or commuter rail
- 9.4%38Walked
- 12.8%52Other means
- 4.2%17Worked at home

Time leaving home to go to work
![Time leaving home to go to work]()
- 312:00 a.m. to 4:59 a.m.
- 235:00 a.m. to 5:29 a.m.
- 365:30 a.m. to 5:59 a.m.
- 876:00 a.m. to 6:29 a.m.
- 356:30 a.m. to 6:59 a.m.
- 307:00 a.m. to 7:29 a.m.
- 257:30 a.m. to 7:59 a.m.
- 518:00 a.m. to 8:29 a.m.
- 178:30 a.m. to 8:59 a.m.
- 29:00 a.m. to 9:59 a.m.
- 610:00 a.m. to 10:59 a.m.
- 911:00 a.m. to 11:59 a.m.
- 2912:00 p.m. to 3:59 p.m.
- 204:00 p.m. to 11:59 p.m.

Occupations of males:
- Percentage of males in management occupations (except farmers):
Here: 21.5% city: 8.7%
- Percentage of males in community and social services occupations:
Here: 5.0% city: 1.5%
- Percentage of males in education, training, and library occupations:
Here: 2.3% city: 0.7%
- Percentage of males in healthcare practitioners and technical occupations:
Here: 4.1% city: 1.3%
- Percentage of males in service occupations:
Here: 21.6% city: 30.2%
- Percentage of males in sales and office occupations:
Here: 21.0% city: 11.5%
- Percentage of males in construction, extraction, and maintenance occupations:
Here: 2.8% city: 6.4%
- Percentage of males in transportation occupations:
Here: 1.6% city: 9.2%
- Percentage of males in material moving occupations:
Here: 20.5% city: 10.4%
Occupations of females:
- Percentage of females in management occupations (except farmers):
Here: 10.2% city: 8.8%
- Percentage of females in business and financial operations occupations:
Here: 1.4% city: 2.5%
- Percentage of females in community and social services occupations:
Here: 6.5% city: 3.0%
- Percentage of females in service occupations:
Here: 66.4% city: 40.9%
- Percentage of females in sales and office occupations:
Here: 13.4% city: 22.3%
- Percentage of females in transportation occupations:
Here: 7.3% city: 1.7%
Education in this neighborhood (subdivision or community):
- Percentage of people 3 years and older in K-12 schools:
Downtown: 37.2% Chester: 17.2%
- Percentage of people 3 years and older in undergraduate colleges:
Downtown: 3.8% Chester: 9.4%
- Percentage of people 3 years and older in grad. or professional schools:
Downtown: 0.1% Chester: 0.6%
- Percentage of students K-12 enrolled in private schools:
Downtown: 9.5% Chester: 8.7%
Percentage of population below poverty level:
| Downtown: | 33.8% |
| Chester: | 28.3% |
Median year owner moved in (as recorded in 2022):
Median year renter moved in (as recorded in 2022):
| Downtown: | 1997 |
| Chester: | 1998 |
Median year renter moved in (as recorded in 2022):
| Downtown: | 2017 |
| Chester: | 2015 |
Percentage of married-couple families with both working:
| Downtown: | 5.5% |
| Chester: | 59.6% |

- 55.4%Utility gas
- 25.1%Electricity
- 15.8%Fuel oil, kerosene, etc.
- 3.6%Bottled, tank, or LP gas
Highways in this neighborhood:
US Hwy 13 (Morton Ave)
Length: 0.30 miles
Directions: N-S, SW-NE
Address range: 1000 to 1109
Directions: N-S, SW-NE
Address range: 1000 to 1109
Upland St (State Rte 320)
Length: 0.18 miles
Direction: SE-NW
Address range: 1000 to 1199
Direction: SE-NW
Address range: 1000 to 1199
State Rte 352 (Ave of the States)
Length: 0.11 miles
Direction: N-S
Address range: 1100 to 1199
Direction: N-S
Address range: 1100 to 1199
State Rte 320 (Madison St)
Length: 0.11 miles
Direction: SE-NW
Address range: 1000 to 1148
Direction: SE-NW
Address range: 1000 to 1148
Roads and streets:
E 10th St
Length: 0.46 miles
Direction: E-W
Address range: 300 to 649
Direction: E-W
Address range: 300 to 649
Rose St
Length: 0.40 miles
Directions: E-W, SW-NE
Address range: 300 to 699
Directions: E-W, SW-NE
Address range: 300 to 699
E 11th St
Length: 0.32 miles
Direction: E-W
Address range: 300 to 599
Direction: E-W
Address range: 300 to 599
Doran St
Length: 0.27 miles
Directions: E-W, SW-NE
Address range: 400 to 699
Directions: E-W, SW-NE
Address range: 400 to 699
Elm St
Length: 0.23 miles
Direction: E-W
Address range: 300 to 338
Direction: E-W
Address range: 300 to 338
E 12th St
Length: 0.21 miles
Direction: E-W
Address range: 400 to 1299
Direction: E-W
Address range: 400 to 1299
Chestnut St
Length: 0.17 miles
Directions: E-W, SE-NW
Address range: 922 to 1142
Directions: E-W, SE-NW
Address range: 922 to 1142
Walnut St
Length: 0.14 miles
Direction: SE-NW
Address range: 1000 to 1138
Direction: SE-NW
Address range: 1000 to 1138
Potter St
Length: 0.14 miles
Direction: SE-NW
Address range: 1000 to 1135
Direction: SE-NW
Address range: 1000 to 1135
Bickley Pl
Length: 0.11 miles
Direction: E-W
Address range: 400 to 499
Direction: E-W
Address range: 400 to 499
Dupont St
Length: 0.08 miles
Direction: E-W
Address range: 600 to 633
Direction: E-W
Address range: 600 to 633
Melrose Ave
Length: 0.06 miles
Direction: SE-NW
Address range: 1100 to 1199
Direction: SE-NW
Address range: 1100 to 1199
Blakeley St
Length: 0.04 miles
Direction: E-W
Address range: 1 to 99
Direction: E-W
Address range: 1 to 99
Johnson St
Length: 0.02 miles
Direction: E-W
Direction: E-W