Downtown (Downtown Culver City) neighborhood in Culver City, California (CA), 90034, 90232 detailed profile
Settings
X


Business Search - 14 Million verified businesses
Area: 0.560 square miles
Population: 3,745
Population density:
| Downtown (Downtown Culver City): | 6,684 people per square mile |
| Culver City: | 7,891 people per square mile |

- 1,92351.1%White
- 78620.9%Hispanic or Latino
- 67918.1%Asian
- 2647.0%Two or more races
- 1092.9%Black

Distribution of median household income
![Distribution of median household income]()
- 479Less than $10,000
- 209$10,000 to $19,999
- 161$20,000 to $29,999
- 158$30,000 to $39,999
- 159$40,000 to $49,999
- 96$50,000 to $59,999
- 89$60,000 to $74,999
- 223$75,000 to $99,999
- 138$100,000 to $124,999
- 185$125,000 to $149,999
- 191$150,000 to $199,999
- 409$200,000 or more

Distribution of owner-occupied house/condo value
![Distribution of owner-occupied house/condo value]()
- 116Less than $50,000
- 71$100,000 to $149,999
- 99$200,000 to $249,999
- 19$250,000 to $299,999
- 66$300,000 to $399,999
- 103$400,000 to $499,999
- 247$500,000 to $749,999
- 203$750,000 to $999,999
- 691$1,000,000 or more

Distribution of rent paid by renters
![Distribution of rent paid by renters]()
- 85$200 to $299
- 14$300 to $399
- 26$400 to $499
- 56$500 to $599
- 137$800 to $899
- 22$900 to $999
- 45$1,000 to $1,249
- 96$1,250 to $1,499
- 202$1,500 to $1,999
- 652$2,000 or more

Median rent in 2022:
| Downtown (Downtown Culver City): | $2,273 |
| Culver City: | $2,001 |
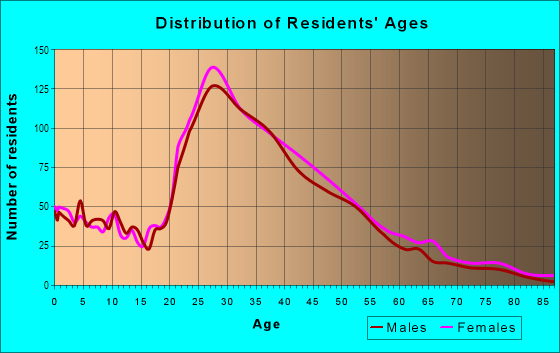
| Males: | 1,672 |
| Females: | 2,073 |
Males:
| This neighborhood: | 39.0 years |
| Whole city: | 39.3 years |
| This neighborhood: | 41.0 years |
| Whole city: | 43.5 years |
Average household size:
| Downtown (Downtown Culver City): | 6.7 people |
| Culver City: | 2.3 people |
Percentage of family households:
| Downtown (Downtown Culver City): | 44.3% |
| Culver City: | 40.6% |
| Here: | 48.7% |
| Culver City: | 44.2% |
Percentage of married-couple families with children (among all households):
| Downtown (Downtown Culver City): | 44.0% |
| Culver City: | 38.6% |
Percentage of single-mother households (among all households):
| Downtown (Downtown Culver City): | 5.9% |
| Culver City: | 3.8% |
Percentage of never married males 15 years old and over:
Percentage of never married females 15 years old and over:
| Downtown (Downtown Culver City): | 13.6% |
| Culver City: | 16.4% |
Percentage of never married females 15 years old and over:
| Downtown (Downtown Culver City): | 15.7% |
| city: | 16.4% |
Percentage of people that speak English not well or not at all:
| Downtown (Downtown Culver City): | 1.4% |
| Culver City: | 2.1% |
Percentage of people born in this state:
Percentage of people born in another U.S. state:
Percentage of native residents but born outside the U.S.:
Percentage of foreign born residents:
| Here: | 46.1% |
| Culver City: | 45.6% |
Percentage of people born in another U.S. state:
| Downtown (Downtown Culver City): | 30.5% |
| Culver City: | 28.1% |
Percentage of native residents but born outside the U.S.:
| Here: | 1.6% |
| city: | 2.1% |
Percentage of foreign born residents:
| Here: | 21.9% |
| Culver City: | 24.1% |

Owner-occupied
Renter-occupied


- Rooms in owner-occupied houses and condos in Downtown <
> - 41 room
- 142 rooms
- 763 rooms
- 1244 rooms
- 2815 rooms
- 1766 rooms
- 1477 rooms
- 618 rooms
- 609+ rooms

- Rooms in renter-occupied apartments in Downtown <
> - 1291 room
- 842 rooms
- 3153 rooms
- 2094 rooms
- 2305 rooms
- 1496 rooms
- 237 rooms
- 178 rooms
- 09+ rooms
Owner-occupied
Renter-occupied

- Bedrooms in owner-occupied houses and condos in Downtown <
> - 4no bedroom
- 141 bedroom
- 1922 bedrooms
- 4863 bedrooms
- 1554 bedrooms
- 325+ bedrooms

- Bedrooms in renter-occupied apartments in Downtown <
> - 136no bedroom
- 3051 bedroom
- 2962 bedrooms
- 1323 bedrooms
- 1334 bedrooms
- 165+ bedrooms
Average number of cars or other vehicles available in houses/condos:
Average number of cars or other vehicles available in apartments:
| This neighborhood: | 2.0 |
| Culver City: | 1.8 |
Average number of cars or other vehicles available in apartments:
| Here: | 1.4 |
| city: | 1.4 |
Percentage of units with a mortgage:
| Downtown (Downtown Culver City): | 56.1% |
| Culver City: | 68.9% |
Average estimated value of detached houses in 2022 (48.3% of all units):
| Downtown (Downtown Culver City): | $1,374,627 |
| Culver City: | $1,549,266 |

- Year house built in Downtown <
> - 1332020 or later
- 1092010 to 2019
- 1152000 to 2009
- 2171990 to 1999
- 1911980 to 1989
- 1861970 to 1979
- 2921960 to 1969
- 2641950 to 1959
- 2581940 to 1949
- 5871939 or earlier

City-data.com crime index for city in 2020 (higher means more crime):
| City: | 330.5 |
| U.S. average: | 219.5 |
Travel time to work (commute)
![Travel time to work (commute)]()
- 22Less than 5 minutes
- 735 to 9 minutes
- 9010 to 14 minutes
- 24015 to 19 minutes
- 23220 to 24 minutes
- 8125 to 29 minutes
- 32930 to 34 minutes
- 4235 to 39 minutes
- 6740 to 44 minutes
- 31845 to 59 minutes
- 7260 to 89 minutes
- 1090 or more minutes

Means of transportation to work
![Means of transportation to work]()
- 53.3%1,035Drove a car alone
- 5.6%108Carpooled
- 4.1%79Bus
- 4.8%93Subway or elevated rail
- 3.4%66Light rail, streetcar or trolley
- 2.2%43Taxi
- 1.1%21Motorcycle
- 4.6%90Bicycle
- 3.0%58Walked
- 6.7%130Other means
- 29.4%571Worked at home

Time leaving home to go to work
![Time leaving home to go to work]()
- 2212:00 a.m. to 4:59 a.m.
- 165:00 a.m. to 5:29 a.m.
- 155:30 a.m. to 5:59 a.m.
- 666:00 a.m. to 6:29 a.m.
- 676:30 a.m. to 6:59 a.m.
- 1257:00 a.m. to 7:29 a.m.
- 1287:30 a.m. to 7:59 a.m.
- 2218:00 a.m. to 8:29 a.m.
- 1668:30 a.m. to 8:59 a.m.
- 4639:00 a.m. to 9:59 a.m.
- 3910:00 a.m. to 10:59 a.m.
- 911:00 a.m. to 11:59 a.m.
- 4312:00 p.m. to 3:59 p.m.
- 494:00 p.m. to 11:59 p.m.

Occupations of males:
- Percentage of males in management occupations (except farmers):
Here: 15.8% city: 16.7%
- Percentage of males in business and financial operations occupations:
Here: 9.5% city: 8.4%
- Percentage of males in computer and mathematical occupations:
Here: 3.0% city: 5.5%
- Percentage of males in architecture and engineering occupations:
Here: 4.3% city: 9.3%
- Percentage of males in life, physical, and social science occupations:
Here: 3.3% city: 2.0%
- Percentage of males in legal occupations:
Here: 3.0% city: 3.3%
- Percentage of males in education, training, and library occupations:
Here: 7.0% city: 5.6%
- Percentage of males in arts, design, entertainment, sports, and media occupations:
Here: 24.3% city: 8.7%
- Percentage of males in healthcare practitioners and technical occupations:
Here: 5.3% city: 3.9%
- Percentage of males in service occupations:
Here: 5.5% city: 7.6%
- Percentage of males in sales and office occupations:
Here: 9.9% city: 15.6%
- Percentage of males in construction, extraction, and maintenance occupations:
Here: 1.9% city: 4.0%
- Percentage of males in production occupations:
Here: 1.4% city: 2.6%
Occupations of females:
- Percentage of females in management occupations (except farmers):
Here: 10.1% city: 11.8%
- Percentage of females in business and financial operations occupations:
Here: 13.4% city: 12.4%
- Percentage of females in computer and mathematical occupations:
Here: 2.7% city: 5.9%
- Percentage of females in life, physical, and social science occupations:
Here: 1.4% city: 0.4%
- Percentage of females in legal occupations:
Here: 3.4% city: 4.3%
- Percentage of females in education, training, and library occupations:
Here: 7.8% city: 8.7%
- Percentage of females in arts, design, entertainment, sports, and media occupations:
Here: 15.7% city: 11.1%
- Percentage of females in healthcare practitioners and technical occupations:
Here: 9.6% city: 8.6%
- Percentage of females in service occupations:
Here: 6.6% city: 12.0%
- Percentage of females in sales and office occupations:
Here: 26.8% city: 16.7%
- Percentage of females in material moving occupations:
Here: 1.2% city: 0.2%
Education in this neighborhood (subdivision or community):
- Percentage of people 3 years and older in K-12 schools:
Downtown (Downtown Culver City): 18.8% Culver City: 13.2%
- Percentage of people 3 years and older in undergraduate colleges:
Downtown (Downtown Culver City): 5.3% Culver City: 4.0%
- Percentage of people 3 years and older in grad. or professional schools:
Downtown (Downtown Culver City): 6.9% Culver City: 2.1%
- Percentage of students K-12 enrolled in private schools:
Downtown (Downtown Culver City): 69.4% Culver City: 15.6%
Percentage of population below poverty level:
| Downtown (Downtown Culver City): | 6.4% |
| Culver City: | 5.9% |
Median year owner moved in (as recorded in 2022):
Median year renter moved in (as recorded in 2022):
| Downtown (Downtown Culver City): | 1997 |
| Culver City: | 2004 |
Median year renter moved in (as recorded in 2022):
| Downtown (Downtown Culver City): | 2016 |
| Culver City: | 2015 |
Percentage of married-couple families with both working:
| Downtown (Downtown Culver City): | 72.4% |
| Culver City: | 74.1% |

- 60.3%Utility gas
- 27.5%Electricity
- 4.7%No fuel used
- 3.5%Solar energy
- 2.4%Other fuel
- 1.6%Bottled, tank, or LP gas
Highways in this neighborhood:
State Rte 187 (Venice Blvd)
Length: 1.60 miles
Directions: E-W, N-S, SW-NE
Address range: 9352 to 10098
Directions: E-W, N-S, SW-NE
Address range: 9352 to 10098
Roads and streets:
Culver Blvd
Length: 1.02 miles
Directions: E-W, N-S, SW-NE
Address range: 9000 to 10098
Directions: E-W, N-S, SW-NE
Address range: 9000 to 10098
Exposition Blvd
Length: 0.81 miles
Directions: E-W, SE-NW
Address range: 8900 to 9798
Directions: E-W, SE-NW
Address range: 8900 to 9798
Washington Blvd (W Washington Blvd)
Length: 0.76 miles
Directions: E-W, SW-NE
Address range: 9000 to 10144
Directions: E-W, SW-NE
Address range: 9000 to 10144
Clarington Ave
Length: 0.73 miles
Direction: SE-NW
Address range: 3400 to 3899
Direction: SE-NW
Address range: 3400 to 3899
Hughes Ave
Length: 0.64 miles
Direction: SE-NW
Address range: 3500 to 3899
Direction: SE-NW
Address range: 3500 to 3899
Madison Ave
Length: 0.61 miles
Directions: E-W, N-S, SE-NW
Address range: 3900 to 4199
Directions: E-W, N-S, SE-NW
Address range: 3900 to 4199
Dunn Dr
Length: 0.60 miles
Direction: SE-NW
Address range: 3500 to 3899
Direction: SE-NW
Address range: 3500 to 3899
Watseka Ave
Length: 0.48 miles
Directions: N-S, SE-NW
Address range: 3600 to 3899
Directions: N-S, SE-NW
Address range: 3600 to 3899
Duquesne Ave
Length: 0.47 miles
Directions: E-W, SE-NW
Address range: 3900 to 4199
Directions: E-W, SE-NW
Address range: 3900 to 4199
Cardiff Ave
Length: 0.43 miles
Directions: N-S, SE-NW
Address range: 3600 to 3899
Directions: N-S, SE-NW
Address range: 3600 to 3899
Regent St
Length: 0.42 miles
Direction: SW-NE
Address range: 9400 to 10099
Direction: SW-NE
Address range: 9400 to 10099
Lincoln Ave
Length: 0.40 miles
Direction: SE-NW
Address range: 4000 to 4199
Direction: SE-NW
Address range: 4000 to 4199
Lafayette Pl
Length: 0.39 miles
Direction: SE-NW
Address range: 4000 to 4199
Direction: SE-NW
Address range: 4000 to 4199
Irving Pl
Length: 0.38 miles
Direction: SE-NW
Address range: 3900 to 4199
Direction: SE-NW
Address range: 3900 to 4199
Van Buren Pl
Length: 0.35 miles
Direction: SE-NW
Address range: 1039 to 4099
Direction: SE-NW
Address range: 1039 to 4099
Ince Blvd
Length: 0.34 miles
Direction: SE-NW
Address range: 3800 to 4173
Direction: SE-NW
Address range: 3800 to 4173
Bagley Ave
Length: 0.30 miles
Directions: N-S, SE-NW
Address range: 3600 to 3774
Directions: N-S, SE-NW
Address range: 3600 to 3774
S Canfield Ave
Length: 0.30 miles
Directions: N-S, SE-NW
Address range: 3650 to 3899
Directions: N-S, SE-NW
Address range: 3650 to 3899
Farragut Dr
Length: 0.29 miles
Direction: SW-NE
Address range: 9500 to 9968
Direction: SW-NE
Address range: 9500 to 9968
Braddock Dr
Length: 0.28 miles
Direction: SW-NE
Address range: 9600 to 9969
Direction: SW-NE
Address range: 9600 to 9969
Delmas Ter
Length: 0.28 miles
Direction: SE-NW
Address range: 3700 to 3899
Direction: SE-NW
Address range: 3700 to 3899
Tabor St
Length: 0.25 miles
Directions: N-S, SW-NE
Address range: 9800 to 10099
Directions: N-S, SW-NE
Address range: 9800 to 10099
Higuera St
Length: 0.22 miles
Directions: N-S, SE-NW
Address range: 3900 to 4099
Directions: N-S, SE-NW
Address range: 3900 to 4099
Exposition Dr
Length: 0.19 miles
Direction: E-W
Address range: 9000 to 9199
Direction: E-W
Address range: 9000 to 9199
Faris Dr
Length: 0.17 miles
Direction: SE-NW
Address range: 3600 to 3699
Direction: SE-NW
Address range: 3600 to 3699
National Blvd
Length: 0.17 miles
Directions: E-W, SW-NE
Address range: 10000 to 10099
Directions: E-W, SW-NE
Address range: 10000 to 10099
Lindblade St
Length: 0.15 miles
Direction: SW-NE
Address range: 9000 to 9099
Direction: SW-NE
Address range: 9000 to 9099
Hubbard St
Length: 0.15 miles
Direction: SW-NE
Address range: 9000 to 9099
Direction: SW-NE
Address range: 9000 to 9099
Hoke Ave
Length: 0.15 miles
Directions: SE-NW, SW-NE
Address range: 3800 to 3899
Directions: SE-NW, SW-NE
Address range: 3800 to 3899
Poinsettia Ct
Length: 0.15 miles
Directions: N-S, SW-NE
Address range: 9000 to 9299
Directions: N-S, SW-NE
Address range: 9000 to 9299
Krueger St
Length: 0.15 miles
Direction: SW-NE
Address range: 9000 to 9099
Direction: SW-NE
Address range: 9000 to 9099
S Robertson Blvd
Length: 0.14 miles
Directions: N-S, SE-NW
Address range: 3370 to 3799
Directions: N-S, SE-NW
Address range: 3370 to 3799
Charnock Ave
Length: 0.14 miles
Direction: SW-NE
Address range: 9700 to 9799
Direction: SW-NE
Address range: 9700 to 9799
Robertson Blvd
Length: 0.12 miles
Direction: N-S
Address range: 3700 to 3799
Direction: N-S
Address range: 3700 to 3799
Main St
Length: 0.11 miles
Directions: E-W, SE-NW
Address range: 3800 to 3899
Directions: E-W, SE-NW
Address range: 3800 to 3899
Hannum Dr
Length: 0.11 miles
Direction: SW-NE
Address range: 9800 to 9899
Direction: SW-NE
Address range: 9800 to 9899
S Durango Ave
Length: 0.11 miles
Direction: SE-NW
Address range: 3700 to 3799
Direction: SE-NW
Address range: 3700 to 3799
Palms Blvd
Length: 0.10 miles
Direction: SW-NE
Address range: 10000 to 10099
Direction: SW-NE
Address range: 10000 to 10099
Robertson Pl
Length: 0.09 miles
Directions: N-S, SE-NW, SW-NE
Address range: 3300 to 3399
Directions: N-S, SE-NW, SW-NE
Address range: 3300 to 3399
School St
Length: 0.08 miles
Direction: SW-NE
Direction: SW-NE
Exposition Boulevard S R
Length: 0.07 miles
Direction: E-W
Address range: 9000 to 9099
Direction: E-W
Address range: 9000 to 9099
Willat Ave
Length: 0.07 miles
Directions: E-W, N-S, SW-NE
Address range: 3800 to 3899
Directions: E-W, N-S, SW-NE
Address range: 3800 to 3899
Livonia Ave
Length: 0.06 miles
Directions: E-W, N-S, SE-NW, SW-NE
Address range: 3356 to 3399
Directions: E-W, N-S, SE-NW, SW-NE
Address range: 3356 to 3399
Railroad features:
Southern Pacific RR
Length: 0.56 miles
Directions: E-W, N-S, SE-NW
Directions: E-W, N-S, SE-NW