Howell Park neighborhood in Baton Rouge, Louisiana (LA), 70805 detailed profile
Settings
X

Business Search - 14 Million verified businesses
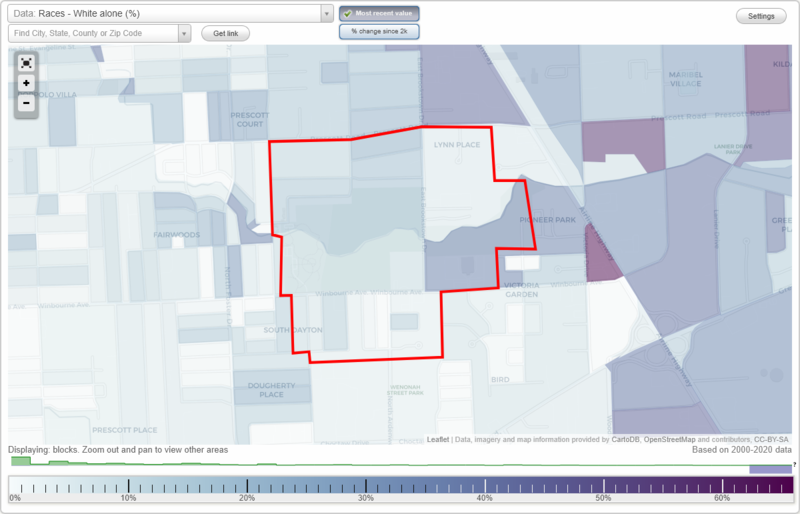
Area: 0.694 square miles
Population: 1,658
Population density:
| Howell Park: | 2,391 people per square mile |
| Baton Rouge: | 2,882 people per square mile |

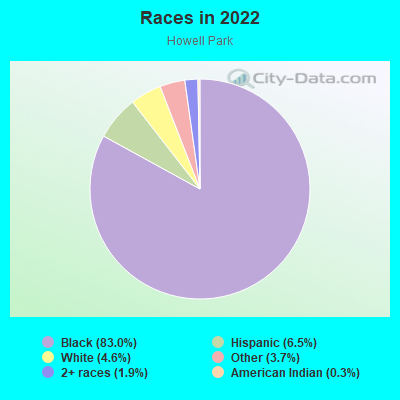
- 1,53483.0%Black
- 1216.5%Hispanic or Latino
- 854.6%White
- 683.7%Some other race
- 361.9%Two or more races
- 50.3%American Indian
Median household income in 2022:
| Howell Park: | $35,680 |
| Baton Rouge: | $50,304 |
Distribution of median household income
![Distribution of median household income]()
- 98Less than $10,000
- 100$10,000 to $19,999
- 178$20,000 to $29,999
- 66$30,000 to $39,999
- 41$40,000 to $49,999
- 44$50,000 to $59,999
- 38$60,000 to $74,999
- 45$75,000 to $99,999
- 19$100,000 to $124,999
- 28$125,000 to $149,999
- 45$150,000 to $199,999
- 19$200,000 or more

Distribution of owner-occupied house/condo value
![Distribution of owner-occupied house/condo value]()
- 55Less than $50,000
- 190$50,000 to $99,999
- 83$100,000 to $149,999
- 22$150,000 to $199,999
- 42$200,000 to $249,999
- 8$250,000 to $299,999
- 7$1,000,000 or more

Distribution of rent paid by renters
![Distribution of rent paid by renters]()
- 20$200 to $299
- 8$300 to $399
- 34$400 to $499
- 43$500 to $599
- 118$600 to $699
- 171$700 to $799
- 31$800 to $899
- 29$900 to $999
- 72$1,000 to $1,249
- 27$1,250 to $1,499
- 3$1,500 to $1,999
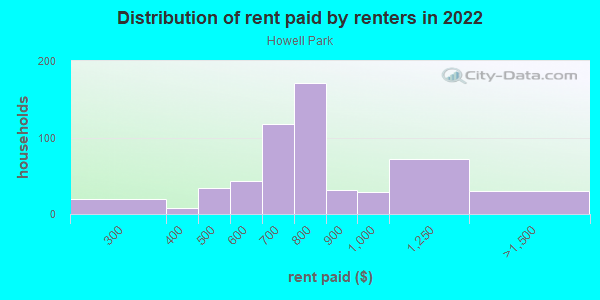
Median rent in 2022:
| Howell Park: | $720 |
| Baton Rouge: | $832 |
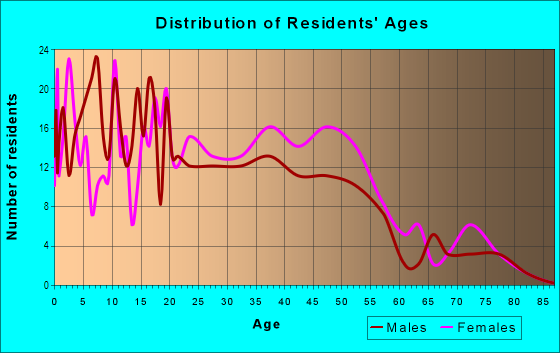
| Males: | 674 |
| Females: | 983 |
Males:
| This neighborhood: | 23.7 years |
| Whole city: | 29.6 years |
| This neighborhood: | 34.8 years |
| Whole city: | 32.8 years |
Average household size:
| Howell Park: | 2.8 people |
| Baton Rouge: | 2.3 people |
Percentage of family households:
| Howell Park: | 41.0% |
| Baton Rouge: | 36.6% |
| Here: | 15.0% |
| Baton Rouge: | 27.8% |
Percentage of married-couple families with children (among all households):
| Howell Park: | 7.1% |
| Baton Rouge: | 15.1% |
Percentage of single-mother households (among all households):
| Howell Park: | 18.1% |
| Baton Rouge: | 22.4% |
Percentage of never married males 15 years old and over:
Percentage of never married females 15 years old and over:
| Howell Park: | 23.0% |
| Baton Rouge: | 27.3% |
Percentage of never married females 15 years old and over:
| Howell Park: | 38.9% |
| city: | 27.2% |
Percentage of people that speak English not well or not at all:
| Howell Park: | 3.9% |
| Baton Rouge: | 1.8% |
Percentage of people born in this state:
Percentage of people born in another U.S. state:
Percentage of native residents but born outside the U.S.:
Percentage of foreign born residents:
| Here: | 90.5% |
| Baton Rouge: | 74.7% |
Percentage of people born in another U.S. state:
| Howell Park: | 6.2% |
| Baton Rouge: | 17.8% |
Percentage of native residents but born outside the U.S.:
| Here: | 1.6% |
| city: | 0.5% |
Percentage of foreign born residents:
| Here: | 3.8% |
| Baton Rouge: | 7.0% |

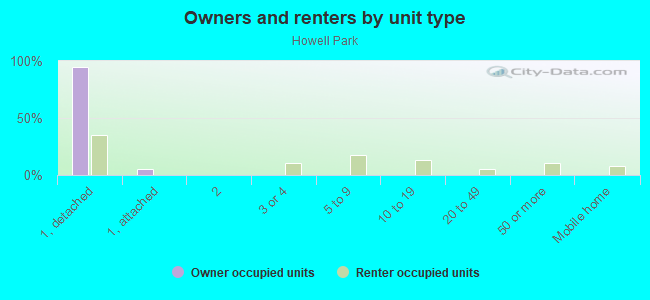
Owner-occupied
Renter-occupied

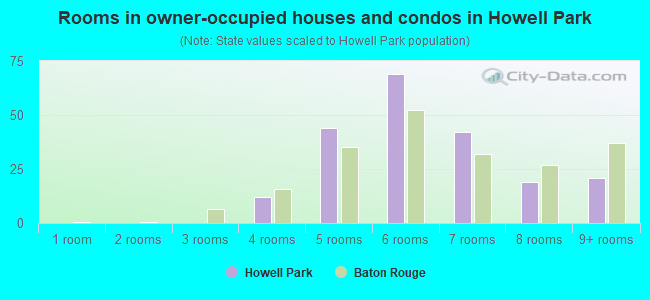
- Rooms in owner-occupied houses and condos in Howell Park
- 01 room
- 02 rooms
- 03 rooms
- 124 rooms
- 445 rooms
- 696 rooms
- 427 rooms
- 198 rooms
- 219+ rooms
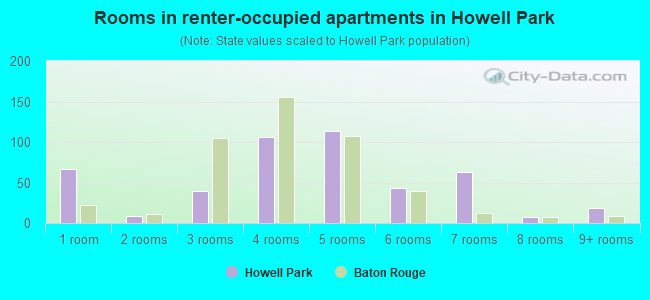
- Rooms in renter-occupied apartments in Howell Park
- 671 room
- 92 rooms
- 393 rooms
- 1064 rooms
- 1145 rooms
- 436 rooms
- 637 rooms
- 88 rooms
- 199+ rooms
Owner-occupied
Renter-occupied
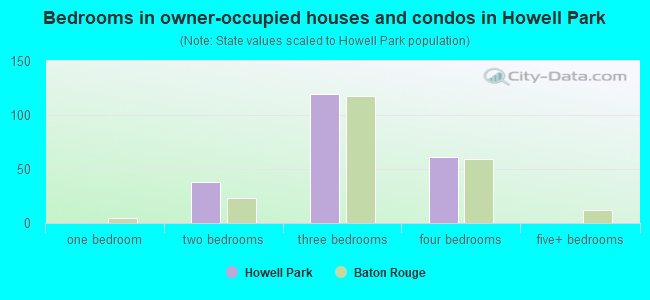
- Bedrooms in owner-occupied houses and condos in Howell Park
- 0no bedroom
- 01 bedroom
- 382 bedrooms
- 1193 bedrooms
- 614 bedrooms
- 05+ bedrooms
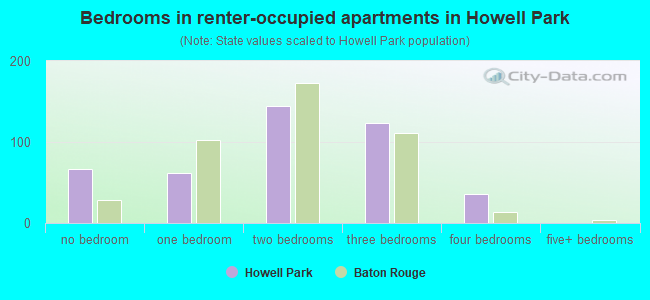
- Bedrooms in renter-occupied apartments in Howell Park
- 67no bedroom
- 621 bedroom
- 1442 bedrooms
- 1233 bedrooms
- 364 bedrooms
- 05+ bedrooms
Average number of cars or other vehicles available in houses/condos:
Average number of cars or other vehicles available in apartments:
| This neighborhood: | 1.8 |
| Baton Rouge: | 1.7 |
Average number of cars or other vehicles available in apartments:
| Here: | 1.1 |
| city: | 1.3 |
Percentage of units with a mortgage:
| Howell Park: | 59.2% |
| Baton Rouge: | 56.3% |
Average estimated value of detached houses in 2022 (54.9% of all units):
| Howell Park: | $99,926 |
| Louisiana: | $273,555 |
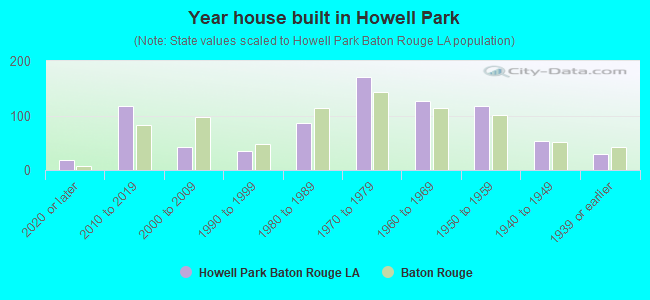
- Year house built in Howell Park
- 192020 or later
- 1182010 to 2019
- 422000 to 2009
- 341990 to 1999
- 871980 to 1989
- 1701970 to 1979
- 1271960 to 1969
- 1171950 to 1959
- 541940 to 1949
- 301939 or earlier
City-data.com crime index for city in 2020 (higher means more crime):
| City: | 544.1 |
| U.S. average: | 219.5 |
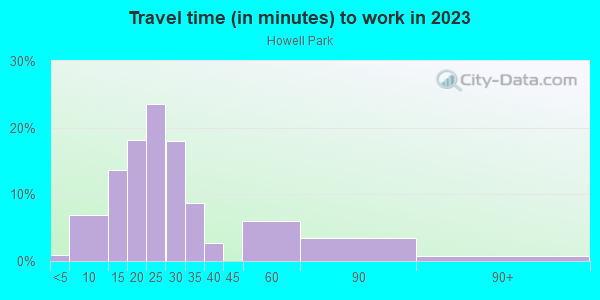
Travel time to work (commute)
![Travel time to work (commute)]()
- 9Less than 5 minutes
- 605 to 9 minutes
- 15210 to 14 minutes
- 14215 to 19 minutes
- 14720 to 24 minutes
- 10725 to 29 minutes
- 5830 to 34 minutes
- 1535 to 39 minutes
- 4945 to 59 minutes
- 1860 to 89 minutes
- 790 or more minutes
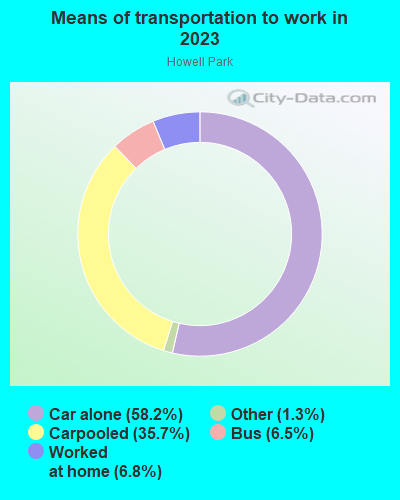
Means of transportation to work
![Means of transportation to work]()
- 62.1%438Drove a car alone
- 33.2%234Carpooled
- 5.7%40Bus
- 2.1%15Walked
- 1.7%12Other means
- 2.3%16Worked at home
Time leaving home to go to work
![Time leaving home to go to work]()
- 3912:00 a.m. to 4:59 a.m.
- 515:00 a.m. to 5:29 a.m.
- 615:30 a.m. to 5:59 a.m.
- 626:00 a.m. to 6:29 a.m.
- 236:30 a.m. to 6:59 a.m.
- 1047:00 a.m. to 7:29 a.m.
- 567:30 a.m. to 7:59 a.m.
- 918:00 a.m. to 8:29 a.m.
- 488:30 a.m. to 8:59 a.m.
- 779:00 a.m. to 9:59 a.m.
- 1210:00 a.m. to 10:59 a.m.
- 2011:00 a.m. to 11:59 a.m.
- 6212:00 p.m. to 3:59 p.m.
- 414:00 p.m. to 11:59 p.m.

Occupations of males:
- Percentage of males in service occupations:
Here: 36.4% city: 16.2%
- Percentage of males in sales and office occupations:
Here: 6.9% city: 12.7%
- Percentage of males in construction, extraction, and maintenance occupations:
Here: 15.9% city: 8.7%
- Percentage of males in production occupations:
Here: 7.0% city: 6.5%
- Percentage of males in transportation occupations:
Here: 6.9% city: 6.6%
- Percentage of males in material moving occupations:
Here: 19.2% city: 7.0%
Occupations of females:
- Percentage of females in management occupations (except farmers):
Here: 3.1% city: 8.6%
- Percentage of females in business and financial operations occupations:
Here: 4.2% city: 4.9%
- Percentage of females in community and social services occupations:
Here: 6.4% city: 3.1%
- Percentage of females in education, training, and library occupations:
Here: 9.3% city: 10.7%
- Percentage of females in healthcare practitioners and technical occupations:
Here: 5.8% city: 7.6%
- Percentage of females in service occupations:
Here: 40.1% city: 24.5%
- Percentage of females in sales and office occupations:
Here: 19.4% city: 26.5%
- Percentage of females in farming, fishing, and forestry occupations:
Here: 1.7% city: 0.3%
- Percentage of females in production occupations:
Here: 4.5% city: 1.8%
- Percentage of females in transportation occupations:
Here: 4.9% city: 1.4%
Education in this neighborhood (subdivision or community):
- Percentage of people 3 years and older in K-12 schools:
Howell Park: 35.7% Baton Rouge: 14.3%
- Percentage of people 3 years and older in undergraduate colleges:
Howell Park: 5.4% Baton Rouge: 14.0%
- Percentage of people 3 years and older in grad. or professional schools:
Howell Park: 2.2% Baton Rouge: 2.5%
- Percentage of students K-12 enrolled in private schools:
Howell Park: 4.0% Baton Rouge: 22.0%
Percentage of population below poverty level:
| Howell Park: | 37.4% |
| Baton Rouge: | 22.4% |
Median year owner moved in (as recorded in 2022):
| Howell Park: | 1998 |
| Baton Rouge: | 2007 |
Percentage of married-couple families with both working:
| Howell Park: | 224.0% |
| Baton Rouge: | 80.7% |
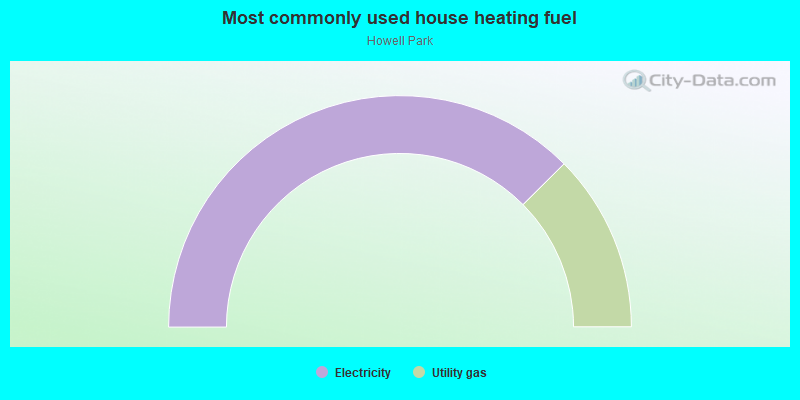
- 75.1%Electricity
- 24.9%Utility gas
Roads and streets:
Winbourne Ave
Length: 0.79 miles
Direction: E-W
Address range: 5400 to 6399
Direction: E-W
Address range: 5400 to 6399
E Brookstown Dr
Length: 0.55 miles
Direction: N-S
Address range: 3300 to 3999
Direction: N-S
Address range: 3300 to 3999
Heidel Ave
Length: 0.32 miles
Direction: E-W
Address range: 5800 to 6198
Direction: E-W
Address range: 5800 to 6198
Linden St
Length: 0.32 miles
Direction: E-W
Address range: 5800 to 6199
Direction: E-W
Address range: 5800 to 6199
Howell Park Ave
Length: 0.27 miles
Direction: E-W
Address range: 5400 to 5799
Direction: E-W
Address range: 5400 to 5799
Blackwell Dr
Length: 0.22 miles
Direction: N-S
Address range: 2900 to 3299
Direction: N-S
Address range: 2900 to 3299
Bootsie Dr
Length: 0.22 miles
Directions: N-S, SW-NE
Address range: 2900 to 3299
Directions: N-S, SW-NE
Address range: 2900 to 3299
Dougherty Dr
Length: 0.22 miles
Direction: N-S
Address range: 2900 to 3299
Direction: N-S
Address range: 2900 to 3299
Garnet Dr
Length: 0.22 miles
Direction: N-S
Address range: 2900 to 3299
Direction: N-S
Address range: 2900 to 3299
N Ardenwood Dr
Length: 0.22 miles
Direction: N-S
Address range: 2901 to 3299
Direction: N-S
Address range: 2901 to 3299
Topaz Dr
Length: 0.22 miles
Directions: N-S, SE-NW
Address range: 2900 to 3299
Directions: N-S, SE-NW
Address range: 2900 to 3299
Hendricks Ave
Length: 0.21 miles
Direction: E-W
Direction: E-W
Frey St
Length: 0.17 miles
Direction: E-W
Address range: 5500 to 5699
Direction: E-W
Address range: 5500 to 5699
Ruby Ct
Length: 0.14 miles
Directions: E-W, SW-NE
Address range: 6000 to 6299
Directions: E-W, SW-NE
Address range: 6000 to 6299
W Brookstown Dr
Length: 0.13 miles
Direction: N-S
Address range: 3800 to 3998
Direction: N-S
Address range: 3800 to 3998
Michelli Dr
Length: 0.13 miles
Direction: N-S
Address range: 3100 to 3299
Direction: N-S
Address range: 3100 to 3299
N Howell Dr
Length: 0.13 miles
Directions: E-W, SE-NW
Address range: 5900 to 6199
Directions: E-W, SE-NW
Address range: 5900 to 6199
S Howell Dr
Length: 0.13 miles
Direction: E-W
Address range: 5900 to 6199
Direction: E-W
Address range: 5900 to 6199
Ruby Ave
Length: 0.12 miles
Directions: E-W, SE-NW
Address range: 5800 to 5999
Directions: E-W, SE-NW
Address range: 5800 to 5999
Cathedral Dr
Length: 0.10 miles
Directions: N-S, SW-NE
Address range: 3700 to 3799
Directions: N-S, SW-NE
Address range: 3700 to 3799
E Howell Dr
Length: 0.06 miles
Directions: N-S, SW-NE
Address range: 3100 to 3199
Directions: N-S, SW-NE
Address range: 3100 to 3199