Lower Sweetwater neighborhood in Chula Vista, California (CA), 91910 detailed profile
Settings
X


Business Search - 14 Million verified businesses
Area: 0.337 square miles
Population: 1,782
Population density:
| Lower Sweetwater: | 5,284 people per square mile |
| Chula Vista: | 5,711 people per square mile |

- 1,05759.1%Hispanic or Latino
- 43824.5%White
- 1367.6%Two or more races
- 925.1%Asian
- 341.9%Black
- 140.8%American Indian
- 100.6%Some other race
- 80.4%Native Hawaiian and Other
Pacific Islander

Median household income in 2022:
| Lower Sweetwater: | $80,834 |
| Chula Vista: | $101,190 |
Distribution of median household income
![Distribution of median household income]()
- 16Less than $10,000
- 24$10,000 to $19,999
- 48$20,000 to $29,999
- 17$30,000 to $39,999
- 45$40,000 to $49,999
- 36$50,000 to $59,999
- 74$60,000 to $74,999
- 82$75,000 to $99,999
- 66$100,000 to $124,999
- 19$125,000 to $149,999
- 93$150,000 to $199,999
- 77$200,000 or more

Distribution of owner-occupied house/condo value
![Distribution of owner-occupied house/condo value]()
- 101Less than $50,000
- 59$50,000 to $99,999
- 8$100,000 to $149,999
- 6$150,000 to $199,999
- 15$200,000 to $249,999
- 20$250,000 to $299,999
- 6$300,000 to $399,999
- 17$400,000 to $499,999
- 113$500,000 to $749,999
- 94$750,000 to $999,999
- 9$1,000,000 or more

Distribution of rent paid by renters
![Distribution of rent paid by renters]()
- 5$300 to $399
- 12$500 to $599
- 11$700 to $799
- 21$800 to $899
- 4$900 to $999
- 11$1,000 to $1,249
- 9$1,250 to $1,499
- 169$1,500 to $1,999
- 134$2,000 or more

Median rent in 2022:
| Lower Sweetwater: | $1,931 |
| Chula Vista: | $1,879 |
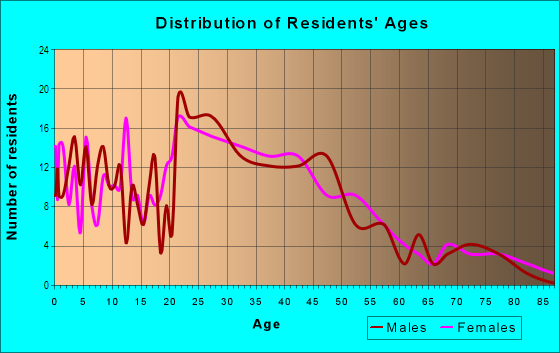
| Males: | 882 |
| Females: | 899 |
Males:
| This neighborhood: | 34.0 years |
| Whole city: | 34.8 years |
| This neighborhood: | 36.7 years |
| Whole city: | 37.4 years |
Average household size:
| Lower Sweetwater: | 3.2 people |
| Chula Vista: | 3.2 people |
Percentage of family households:
| Lower Sweetwater: | 51.4% |
| Chula Vista: | 57.2% |
| Here: | 31.3% |
| Chula Vista: | 54.5% |
Percentage of married-couple families with children (among all households):
| Lower Sweetwater: | 17.3% |
| Chula Vista: | 22.9% |
Percentage of single-mother households (among all households):
| Lower Sweetwater: | 7.5% |
| Chula Vista: | 5.5% |
Percentage of never married males 15 years old and over:
Percentage of never married females 15 years old and over:
| Lower Sweetwater: | 27.2% |
| Chula Vista: | 19.8% |
Percentage of never married females 15 years old and over:
| Lower Sweetwater: | 16.7% |
| city: | 16.5% |
Percentage of people that speak English not well or not at all:
| Lower Sweetwater: | 8.2% |
| Chula Vista: | 8.7% |
Percentage of people born in this state:
Percentage of people born in another U.S. state:
Percentage of native residents but born outside the U.S.:
Percentage of foreign born residents:
| Here: | 50.8% |
| Chula Vista: | 56.5% |
Percentage of people born in another U.S. state:
| Lower Sweetwater: | 21.8% |
| Chula Vista: | 13.1% |
Percentage of native residents but born outside the U.S.:
| Here: | 2.2% |
| city: | 2.8% |
Percentage of foreign born residents:
| Here: | 25.3% |
| Chula Vista: | 27.6% |

Owner-occupied
Renter-occupied


- Rooms in owner-occupied houses and condos in Lower Sweetwater
- 21 room
- 62 rooms
- 103 rooms
- 184 rooms
- 535 rooms
- 886 rooms
- 677 rooms
- 148 rooms
- 69+ rooms

- Rooms in renter-occupied apartments in Lower Sweetwater
- 161 room
- 482 rooms
- 823 rooms
- 824 rooms
- 155 rooms
- 176 rooms
- 87 rooms
- 08 rooms
- 379+ rooms
Owner-occupied
Renter-occupied

- Bedrooms in owner-occupied houses and condos in Lower Sweetwater
- 4no bedroom
- 51 bedroom
- 132 bedrooms
- 623 bedrooms
- 1614 bedrooms
- 305+ bedrooms

- Bedrooms in renter-occupied apartments in Lower Sweetwater
- 16no bedroom
- 1051 bedroom
- 1242 bedrooms
- 243 bedrooms
- 24 bedrooms
- 375+ bedrooms
Average number of cars or other vehicles available in houses/condos:
Average number of cars or other vehicles available in apartments:
| This neighborhood: | 2.2 |
| Chula Vista: | 2.4 |
Average number of cars or other vehicles available in apartments:
| Here: | 2.0 |
| city: | 1.7 |
Percentage of units with a mortgage:
| Lower Sweetwater: | 62.4% |
| Chula Vista: | 76.0% |
Housing prices:
- Average estimated value of detached houses in 2022 (53.1% of all units):
Lower Sweetwater: $481,435 California: $988,808
- Average estimated value of townhouses or other attached units in 2022 (3.0% of all units):
This neighborhood: $598,714 California: $838,546

- Year house built in Lower Sweetwater
- 02020 or later
- 92010 to 2019
- 452000 to 2009
- 1001990 to 1999
- 1881980 to 1989
- 1631970 to 1979
- 671960 to 1969
- 741950 to 1959
- 191940 to 1949
- 571939 or earlier

City-data.com crime index for city in 2020 (higher means more crime):
| City: | 159.8 |
| U.S. average: | 219.5 |
Travel time to work (commute)
![Travel time to work (commute)]()
- 2Less than 5 minutes
- 365 to 9 minutes
- 10410 to 14 minutes
- 6715 to 19 minutes
- 3420 to 24 minutes
- 9725 to 29 minutes
- 15930 to 34 minutes
- 4135 to 39 minutes
- 5940 to 44 minutes
- 2745 to 59 minutes
- 2660 to 89 minutes
- 890 or more minutes

Means of transportation to work
![Means of transportation to work]()
- 64.6%623Drove a car alone
- 21.0%203Carpooled
- 2.1%20Bus
- 2.5%24Long-distance train or commuter rail
- 1.8%17Light rail, streetcar or trolley
- 1.2%12Taxi
- 0.2%2Motorcycle
- 0.9%9Bicycle
- 0.8%8Walked
- 0.2%2Other means
- 8.4%81Worked at home

Time leaving home to go to work
![Time leaving home to go to work]()
- 5612:00 a.m. to 4:59 a.m.
- 535:00 a.m. to 5:29 a.m.
- 225:30 a.m. to 5:59 a.m.
- 566:00 a.m. to 6:29 a.m.
- 726:30 a.m. to 6:59 a.m.
- 947:00 a.m. to 7:29 a.m.
- 397:30 a.m. to 7:59 a.m.
- 1148:00 a.m. to 8:29 a.m.
- 408:30 a.m. to 8:59 a.m.
- 269:00 a.m. to 9:59 a.m.
- 2810:00 a.m. to 10:59 a.m.
- 1011:00 a.m. to 11:59 a.m.
- 2412:00 p.m. to 3:59 p.m.
- 274:00 p.m. to 11:59 p.m.

Occupations of males:
- Percentage of males in management occupations (except farmers):
Here: 8.9% city: 9.9%
- Percentage of males in business and financial operations occupations:
Here: 2.3% city: 6.5%
- Percentage of males in architecture and engineering occupations:
Here: 11.8% city: 4.8%
- Percentage of males in education, training, and library occupations:
Here: 6.9% city: 2.3%
- Percentage of males in arts, design, entertainment, sports, and media occupations:
Here: 3.8% city: 1.8%
- Percentage of males in healthcare practitioners and technical occupations:
Here: 4.2% city: 3.0%
- Percentage of males in service occupations:
Here: 9.1% city: 18.4%
- Percentage of males in sales and office occupations:
Here: 31.1% city: 16.0%
- Percentage of males in construction, extraction, and maintenance occupations:
Here: 2.4% city: 9.2%
- Percentage of males in transportation occupations:
Here: 6.0% city: 5.1%
- Percentage of males in material moving occupations:
Here: 8.4% city: 3.7%
Occupations of females:
- Percentage of females in management occupations (except farmers):
Here: 8.2% city: 8.6%
- Percentage of females in business and financial operations occupations:
Here: 5.5% city: 5.6%
- Percentage of females in education, training, and library occupations:
Here: 9.3% city: 7.6%
- Percentage of females in healthcare practitioners and technical occupations:
Here: 14.6% city: 10.6%
- Percentage of females in service occupations:
Here: 40.1% city: 22.6%
- Percentage of females in sales and office occupations:
Here: 20.9% city: 29.5%
Percentage of people 16-64 in Armed Forces:
| Lower Sweetwater: | 2.1% |
| Chula Vista: | 4.1% |
Education in this neighborhood (subdivision or community):
- Percentage of people 3 years and older in K-12 schools:
Lower Sweetwater: 13.1% Chula Vista: 22.0%
- Percentage of people 3 years and older in undergraduate colleges:
Lower Sweetwater: 12.5% Chula Vista: 7.6%
- Percentage of people 3 years and older in grad. or professional schools:
Lower Sweetwater: 2.9% Chula Vista: 1.2%
- Percentage of students K-12 enrolled in private schools:
Lower Sweetwater: 17.6% Chula Vista: 7.0%
Percentage of population below poverty level:
| Lower Sweetwater: | 11.2% |
| Chula Vista: | 10.1% |
Median year owner moved in (as recorded in 2022):
Median year renter moved in (as recorded in 2022):
| Lower Sweetwater: | 2003 |
| Chula Vista: | 2011 |
Median year renter moved in (as recorded in 2022):
| Lower Sweetwater: | 2016 |
| Chula Vista: | 2018 |
Percentage of married-couple families with both working:
| Lower Sweetwater: | 36.3% |
| Chula Vista: | 69.2% |

- 47.4%Utility gas
- 38.8%Electricity
- 3.5%Solar energy
- 3.2%Other fuel
- 3.2%No fuel used
- 2.7%Bottled, tank, or LP gas
- 1.3%Wood
Highways in this neighborhood:
E St (Co Hwy S17)
Length: 0.11 miles
Direction: E-W
Address range: 61 to 99
Direction: E-W
Address range: 61 to 99
Roads and streets:
D St
Length: 0.47 miles
Directions: E-W, N-S, SW-NE
Address range: 1 to 181
Directions: E-W, N-S, SW-NE
Address range: 1 to 181
Las Flores Dr
Length: 0.46 miles
Directions: E-W, N-S, SE-NW
Address range: 1 to 199
Directions: E-W, N-S, SE-NW
Address range: 1 to 199
Corte Maria Ave
Length: 0.45 miles
Directions: N-S, SE-NW, SW-NE
Address range: 1 to 199
Directions: N-S, SE-NW, SW-NE
Address range: 1 to 199
E Flower St
Length: 0.30 miles
Directions: E-W, N-S, SW-NE
Address range: 30 to 99
Directions: E-W, N-S, SW-NE
Address range: 30 to 99
1st Ave
Length: 0.27 miles
Directions: E-W, N-S, SE-NW
Address range: 1 to 199
Directions: E-W, N-S, SE-NW
Address range: 1 to 199
Hilltop Dr
Length: 0.15 miles
Directions: N-S, SE-NW
Address range: 1 to 128
Directions: N-S, SE-NW
Address range: 1 to 128
Doran Ct
Length: 0.14 miles
Directions: E-W, N-S, SW-NE
Address range: 1 to 99
Directions: E-W, N-S, SW-NE
Address range: 1 to 99
Minot Ave
Length: 0.14 miles
Direction: N-S
Address range: 34 to 118
Direction: N-S
Address range: 34 to 118
Vista Way
Length: 0.11 miles
Directions: N-S, SE-NW
Address range: 2 to 99
Directions: N-S, SE-NW
Address range: 2 to 99
Casselman Ct
Length: 0.05 miles
Direction: E-W
Address range: 1 to 30
Direction: E-W
Address range: 1 to 30
Corte Helena Ave
Length: 0.04 miles
Direction: N-S
Address range: 100 to 199
Direction: N-S
Address range: 100 to 199
Casselman Pl
Length: 0.03 miles
Direction: E-W
Address range: 50 to 81
Direction: E-W
Address range: 50 to 81