Old Orchard neighborhood in Sunnyvale, California (CA), 94087 detailed profile
Settings
X

Business Search - 14 Million verified businesses
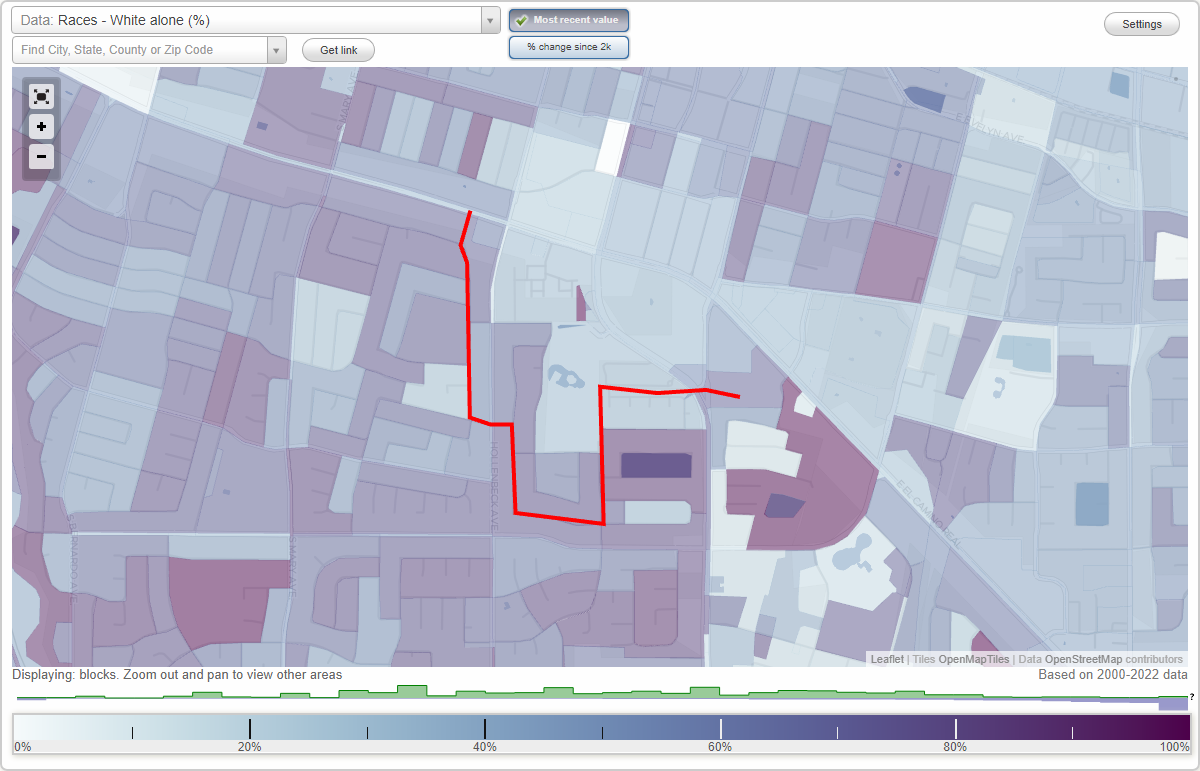
Area: 0.186 square miles
Population: 841
Population density:
| Old Orchard: | 4,526 people per square mile |
| Sunnyvale: | 6,978 people per square mile |

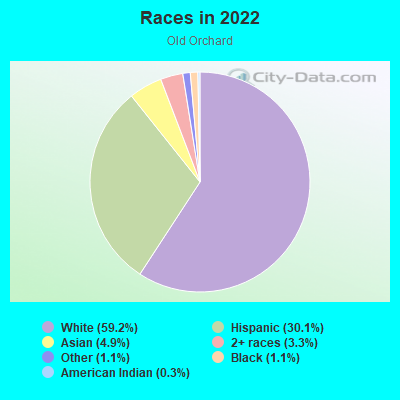
- 49056.0%Asian
- 25729.4%White
- 414.7%Black
- 343.9%Hispanic or Latino
- 293.3%Some other race
- 182.1%Two or more races
- 60.7%Native Hawaiian and Other
Pacific Islander
Median household income in 2022:
| Old Orchard: | $181,087 |
| Sunnyvale: | $169,781 |
Distribution of median household income
![Distribution of median household income]()
- 55Less than $10,000
- 62$10,000 to $19,999
- 30$20,000 to $29,999
- 26$30,000 to $39,999
- 23$40,000 to $49,999
- 12$50,000 to $59,999
- 7$60,000 to $74,999
- 48$75,000 to $99,999
- 31$100,000 to $124,999
- 11$125,000 to $149,999
- 31$150,000 to $199,999
- 129$200,000 or more

Distribution of owner-occupied house/condo value
![Distribution of owner-occupied house/condo value]()
- 5Less than $50,000
- 21$100,000 to $149,999
- 12$200,000 to $249,999
- 13$500,000 to $749,999
- 14$750,000 to $999,999
- 238$1,000,000 or more

Distribution of rent paid by renters
![Distribution of rent paid by renters]()
- 5$500 to $599
- 12$800 to $899
- 5$900 to $999
- 6$1,250 to $1,499
- 21$1,500 to $1,999
- 91$2,000 or more

Median rent in 2022:
| Old Orchard: | $2,900 |
| Sunnyvale: | $2,001 |
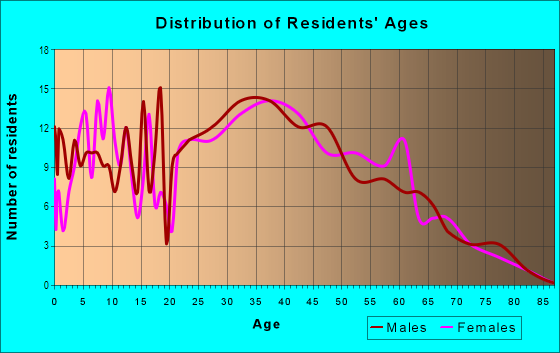
| Males: | 383 |
| Females: | 458 |
Males:
| This neighborhood: | 37.0 years |
| Whole city: | 34.2 years |
| This neighborhood: | 44.8 years |
| Whole city: | 37.1 years |
Average household size:
| Old Orchard: | 2.7 people |
| Sunnyvale: | 2.6 people |
Percentage of family households:
| Old Orchard: | 51.0% |
| Sunnyvale: | 47.1% |
| Here: | 56.3% |
| Sunnyvale: | 50.8% |
Percentage of married-couple families with children (among all households):
| Old Orchard: | 33.1% |
| Sunnyvale: | 33.2% |
Percentage of single-mother households (among all households):
| Old Orchard: | 4.6% |
| Sunnyvale: | 4.2% |
Percentage of never married males 15 years old and over:
Percentage of never married females 15 years old and over:
| Old Orchard: | 10.3% |
| Sunnyvale: | 23.3% |
Percentage of never married females 15 years old and over:
| Old Orchard: | 7.9% |
| city: | 13.4% |
Percentage of people that speak English not well or not at all:
| Old Orchard: | 11.2% |
| Sunnyvale: | 8.1% |
Percentage of people born in this state:
Percentage of people born in another U.S. state:
Percentage of native residents but born outside the U.S.:
Percentage of foreign born residents:
| Here: | 35.6% |
| Sunnyvale: | 37.8% |
Percentage of people born in another U.S. state:
| Old Orchard: | 23.3% |
| Sunnyvale: | 12.0% |
Percentage of native residents but born outside the U.S.:
| Here: | 0.7% |
| city: | 1.7% |
Percentage of foreign born residents:
| Here: | 40.4% |
| Sunnyvale: | 48.5% |
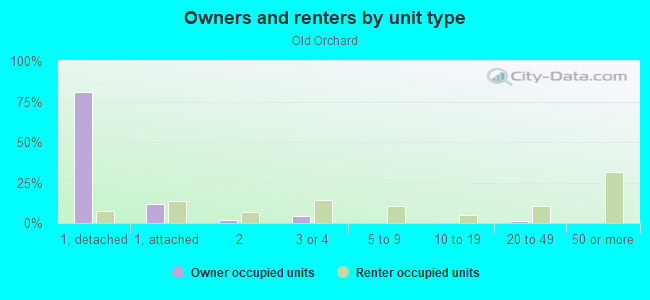
Owner-occupied
Renter-occupied

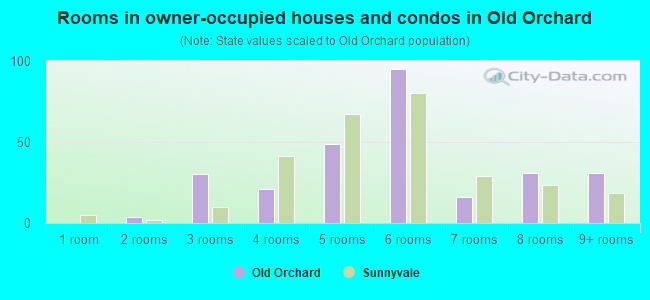
- Rooms in owner-occupied houses and condos in Old Orchard
- 01 room
- 42 rooms
- 303 rooms
- 214 rooms
- 495 rooms
- 956 rooms
- 167 rooms
- 318 rooms
- 319+ rooms
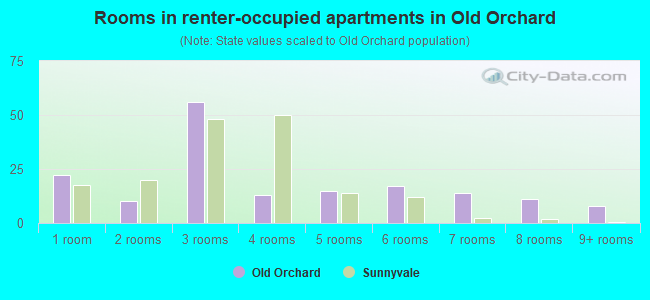
- Rooms in renter-occupied apartments in Old Orchard
- 221 room
- 102 rooms
- 563 rooms
- 134 rooms
- 155 rooms
- 176 rooms
- 147 rooms
- 118 rooms
- 89+ rooms
Owner-occupied
Renter-occupied
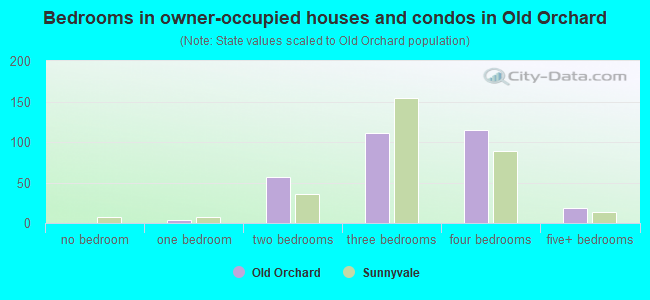
- Bedrooms in owner-occupied houses and condos in Old Orchard
- 0no bedroom
- 41 bedroom
- 572 bedrooms
- 1113 bedrooms
- 1154 bedrooms
- 195+ bedrooms
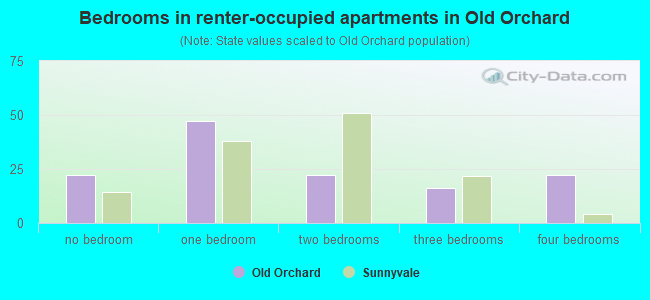
- Bedrooms in renter-occupied apartments in Old Orchard
- 22no bedroom
- 471 bedroom
- 222 bedrooms
- 163 bedrooms
- 224 bedrooms
- 05+ bedrooms
Average number of cars or other vehicles available in houses/condos:
Average number of cars or other vehicles available in apartments:
| This neighborhood: | 1.6 |
| Sunnyvale: | 2.0 |
Average number of cars or other vehicles available in apartments:
| Here: | 1.3 |
| city: | 1.5 |
Percentage of units with a mortgage:
| Old Orchard: | 56.8% |
| Sunnyvale: | 57.7% |
Average estimated value of detached houses in 2022 (71.4% of all units):
| Old Orchard: | $2,543,516 |
| Sunnyvale: | $2,056,322 |
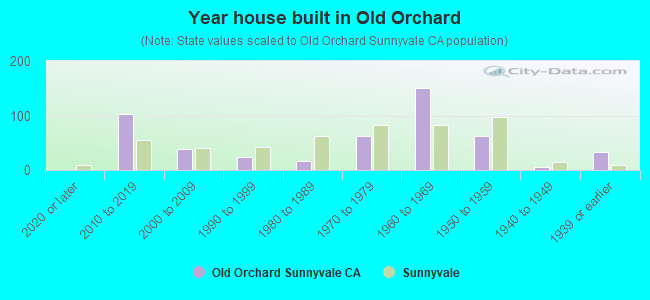
- Year house built in Old Orchard
- 02020 or later
- 1032010 to 2019
- 382000 to 2009
- 241990 to 1999
- 161980 to 1989
- 631970 to 1979
- 1511960 to 1969
- 631950 to 1959
- 51940 to 1949
- 331939 or earlier
City-data.com crime index for city in 2020 (higher means more crime):
| City: | 151.0 |
| U.S. average: | 219.5 |
Travel time to work (commute)
![Travel time to work (commute)]()
- 11Less than 5 minutes
- 415 to 9 minutes
- 8410 to 14 minutes
- 10515 to 19 minutes
- 16020 to 24 minutes
- 4125 to 29 minutes
- 6530 to 34 minutes
- 735 to 39 minutes
- 2840 to 44 minutes
- 445 to 59 minutes
- 2460 to 89 minutes
- 1290 or more minutes

Means of transportation to work
![Means of transportation to work]()
- 64.8%251Drove a car alone
- 4.1%16Carpooled
- 8.0%31Bus
- 1.5%6Long-distance train or commuter rail
- 5.9%23Taxi
- 7.0%27Bicycle
- 2.1%8Walked
- 3.1%12Other means
- 21.4%83Worked at home

Time leaving home to go to work
![Time leaving home to go to work]()
- 712:00 a.m. to 4:59 a.m.
- 75:00 a.m. to 5:29 a.m.
- 425:30 a.m. to 5:59 a.m.
- 236:00 a.m. to 6:29 a.m.
- 236:30 a.m. to 6:59 a.m.
- 427:00 a.m. to 7:29 a.m.
- 657:30 a.m. to 7:59 a.m.
- 1768:00 a.m. to 8:29 a.m.
- 668:30 a.m. to 8:59 a.m.
- 1279:00 a.m. to 9:59 a.m.
- 3710:00 a.m. to 10:59 a.m.
- 511:00 a.m. to 11:59 a.m.
- 2812:00 p.m. to 3:59 p.m.
- 74:00 p.m. to 11:59 p.m.

Occupations of males:
- Percentage of males in management occupations (except farmers):
Here: 18.2% city: 12.9%
- Percentage of males in business and financial operations occupations:
Here: 9.0% city: 3.9%
- Percentage of males in computer and mathematical occupations:
Here: 30.5% city: 36.0%
- Percentage of males in architecture and engineering occupations:
Here: 17.7% city: 11.7%
- Percentage of males in legal occupations:
Here: 5.9% city: 0.5%
- Percentage of males in education, training, and library occupations:
Here: 1.1% city: 1.8%
- Percentage of males in service occupations:
Here: 2.6% city: 6.8%
- Percentage of males in sales and office occupations:
Here: 11.4% city: 9.4%
- Percentage of males in production occupations:
Here: 8.2% city: 2.8%
Occupations of females:
- Percentage of females in management occupations (except farmers):
Here: 21.2% city: 12.6%
- Percentage of females in business and financial operations occupations:
Here: 16.4% city: 9.5%
- Percentage of females in computer and mathematical occupations:
Here: 13.8% city: 17.6%
- Percentage of females in architecture and engineering occupations:
Here: 6.8% city: 5.6%
- Percentage of females in community and social services occupations:
Here: 1.5% city: 1.2%
- Percentage of females in education, training, and library occupations:
Here: 7.5% city: 7.5%
- Percentage of females in healthcare practitioners and technical occupations:
Here: 3.5% city: 5.1%
- Percentage of females in service occupations:
Here: 5.4% city: 12.0%
- Percentage of females in sales and office occupations:
Here: 23.7% city: 16.1%
- Percentage of females in transportation occupations:
Here: 3.2% city: 0.6%
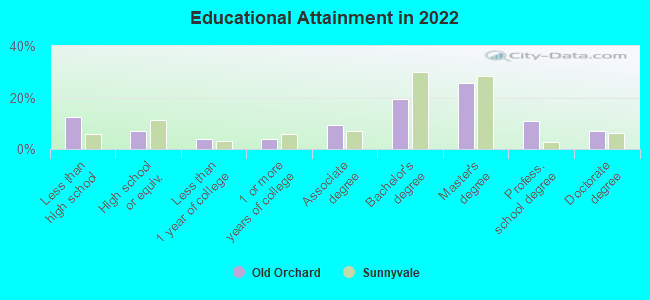
Education in this neighborhood (subdivision or community):
- Percentage of people 3 years and older in K-12 schools:
Old Orchard: 23.6% Sunnyvale: 12.5%
- Percentage of people 3 years and older in undergraduate colleges:
Old Orchard: 10.7% Sunnyvale: 5.1%
- Percentage of people 3 years and older in grad. or professional schools:
Old Orchard: 3.2% Sunnyvale: 2.3%
- Percentage of students K-12 enrolled in private schools:
Old Orchard: 63.5% Sunnyvale: 14.9%
Percentage of population below poverty level:
| Old Orchard: | 6.0% |
| Sunnyvale: | 6.2% |
Median year owner moved in (as recorded in 2022):
| Old Orchard: | 2001 |
| Sunnyvale: | 2008 |
Percentage of married-couple families with both working:
| Old Orchard: | 124.4% |
| Sunnyvale: | 69.8% |
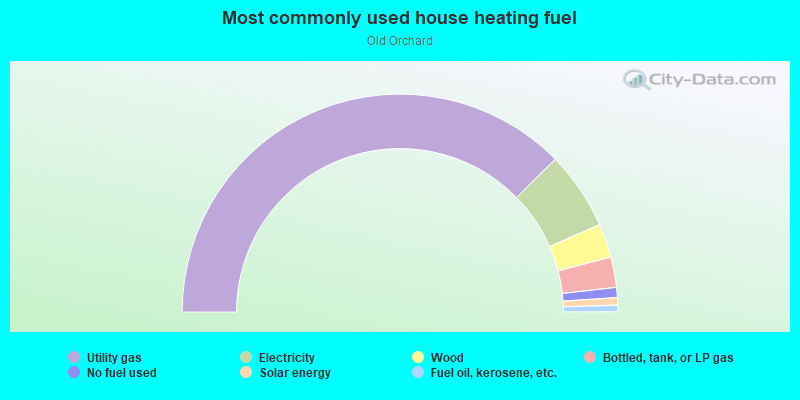
- 75.3%Utility gas
- 11.6%Electricity
- 5.0%Wood
- 4.5%Bottled, tank, or LP gas
- 1.5%No fuel used
- 1.1%Solar energy
- 1.0%Fuel oil, kerosene, etc.
Highways in this neighborhood:
State Hwy 82 (W el Camino Real)
Length: 0.27 miles
Direction: E-W
Address range: 500 to 799
Direction: E-W
Address range: 500 to 799
Roads and streets:
Hollenbeck Ave
Length: 0.48 miles
Direction: N-S
Address range: 600 to 874
Direction: N-S
Address range: 600 to 874
Russet Dr
Length: 0.43 miles
Directions: E-W, N-S, SE-NW, SW-NE
Address range: 800 to 899
Directions: E-W, N-S, SE-NW, SW-NE
Address range: 800 to 899
Danforth Dr
Length: 0.24 miles
Directions: E-W, SE-NW
Address range: 551 to 749
Directions: E-W, SE-NW
Address range: 551 to 749
Rubis Dr
Length: 0.21 miles
Directions: E-W, N-S, SW-NE
Address range: 800 to 874
Directions: E-W, N-S, SW-NE
Address range: 800 to 874
Hyde Park Dr
Length: 0.19 miles
Direction: E-W
Address range: 600 to 691
Direction: E-W
Address range: 600 to 691
Savory Dr
Length: 0.18 miles
Directions: E-W, N-S, SW-NE
Address range: 800 to 899
Directions: E-W, N-S, SW-NE
Address range: 800 to 899
Reseda Dr
Length: 0.13 miles
Direction: N-S
Address range: 601 to 799
Direction: N-S
Address range: 601 to 799
Russet Ter
Length: 0.12 miles
Directions: E-W, N-S, SE-NW, SW-NE
Address range: 700 to 799
Directions: E-W, N-S, SE-NW, SW-NE
Address range: 700 to 799
S Mathilda Ave
Length: 0.11 miles
Direction: N-S
Direction: N-S
Spinosa Dr
Length: 0.11 miles
Direction: N-S
Address range: 800 to 898
Direction: N-S
Address range: 800 to 898
Quetta Ave
Length: 0.10 miles
Direction: N-S
Address range: 717 to 799
Direction: N-S
Address range: 717 to 799
Erie Dr
Length: 0.08 miles
Direction: E-W
Address range: 600 to 699
Direction: E-W
Address range: 600 to 699
Nashua Ct
Length: 0.07 miles
Direction: E-W
Address range: 600 to 699
Direction: E-W
Address range: 600 to 699
Danforth Ter
Length: 0.06 miles
Directions: E-W, N-S, SE-NW
Address range: 700 to 770
Directions: E-W, N-S, SE-NW
Address range: 700 to 770
Harvard Ave
Length: 0.06 miles
Direction: E-W
Address range: 600 to 699
Direction: E-W
Address range: 600 to 699
Oneida Dr
Length: 0.04 miles
Direction: E-W
Address range: 600 to 699
Direction: E-W
Address range: 600 to 699
Allegheny Dr
Length: 0.03 miles
Direction: E-W
Address range: 600 to 699
Direction: E-W
Address range: 600 to 699
Georgetown Ct
Length: 0.02 miles
Direction: E-W
Address range: 600 to 699
Direction: E-W
Address range: 600 to 699