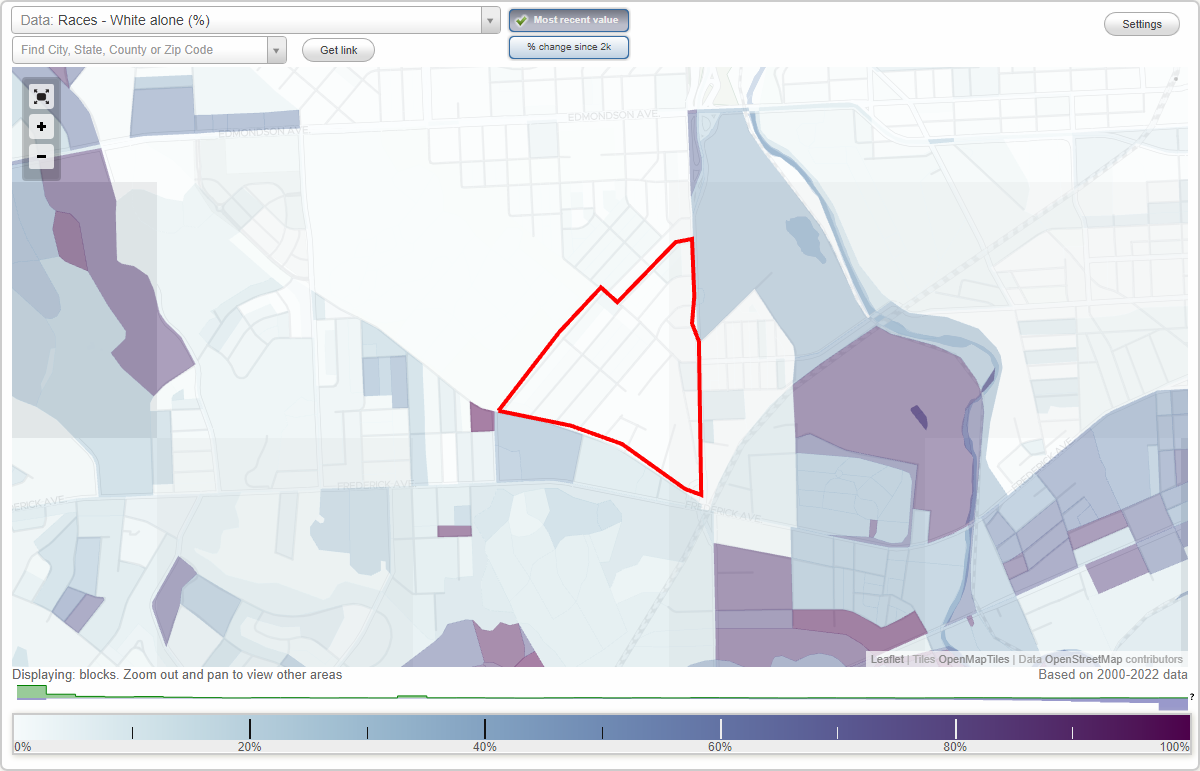
Saint Josephs neighborhood in Baltimore, Maryland (MD), 21229 detailed profile
Settings
X

Business Search - 14 Million verified businesses
Area: 0.140 square miles
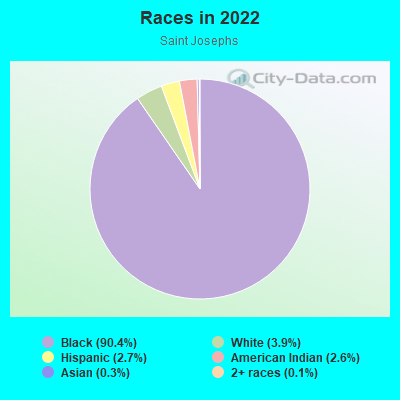
Population: 2,652
Population density:
| Saint Josephs: | 18,949 people per square mile |
| Baltimore: | 7,053 people per square mile |

- 2,52790.4%Black
- 1093.9%White
- 752.7%Hispanic or Latino
- 722.6%American Indian
- 80.3%Asian
- 30.1%Two or more races
Distribution of median household income
![Distribution of median household income]()
- 192Less than $10,000
- 689$10,000 to $19,999
- 60$20,000 to $29,999
- 202$30,000 to $39,999
- 127$40,000 to $49,999
- 283$50,000 to $59,999
- 73$60,000 to $74,999
- 181$75,000 to $99,999
- 78$100,000 to $124,999
- 5$125,000 to $149,999
- 66$150,000 to $199,999
- 13$200,000 or more

Distribution of owner-occupied house/condo value
![Distribution of owner-occupied house/condo value]()
- 91Less than $50,000
- 375$50,000 to $99,999
- 344$100,000 to $149,999
- 67$150,000 to $199,999
- 41$200,000 to $249,999
- 63$250,000 to $299,999
- 65$400,000 to $499,999

Distribution of rent paid by renters
![Distribution of rent paid by renters]()
- 53$100 to $199
- 108$200 to $299
- 39$300 to $399
- 4$400 to $499
- 54$600 to $699
- 285$700 to $799
- 18$800 to $899
- 120$1,000 to $1,249
- 126$1,250 to $1,499
- 43$1,500 to $1,999

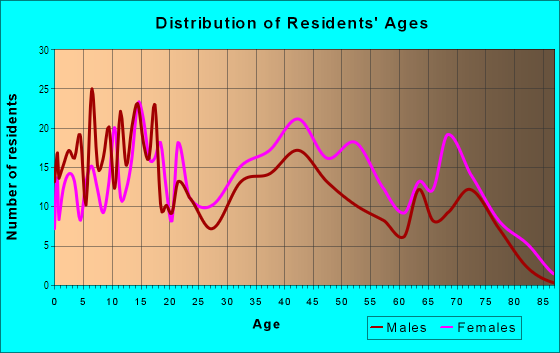
| Males: | 1,195 |
| Females: | 1,456 |
Males:
| This neighborhood: | 32.2 years |
| Whole city: | 35.0 years |
| This neighborhood: | 44.6 years |
| Whole city: | 38.2 years |
Average household size:
| Saint Josephs: | 2.4 people |
| Baltimore: | 2.2 people |
Percentage of family households:
| Saint Josephs: | 36.1% |
| Baltimore: | 34.2% |
| Here: | 6.5% |
| Baltimore: | 23.3% |
Percentage of married-couple families with children (among all households):
| Saint Josephs: | 3.4% |
| Baltimore: | 22.4% |
Percentage of single-mother households (among all households):
| Saint Josephs: | 39.9% |
| Baltimore: | 18.7% |
Percentage of never married males 15 years old and over:
Percentage of never married females 15 years old and over:
| Saint Josephs: | 33.4% |
| Baltimore: | 25.1% |
Percentage of never married females 15 years old and over:
| Saint Josephs: | 32.9% |
| city: | 27.5% |
Percentage of people that speak English not well or not at all:
| Saint Josephs: | 0.9% |
| Baltimore: | 2.3% |
Percentage of people born in this state:
Percentage of people born in another U.S. state:
Percentage of native residents but born outside the U.S.:
Percentage of foreign born residents:
| Here: | 88.4% |
| Baltimore: | 64.4% |
Percentage of people born in another U.S. state:
| Saint Josephs: | 11.3% |
| Baltimore: | 25.0% |
Percentage of native residents but born outside the U.S.:
| Here: | 0.1% |
| city: | 0.9% |
Percentage of foreign born residents:
| Here: | 1.5% |
| Baltimore: | 9.7% |
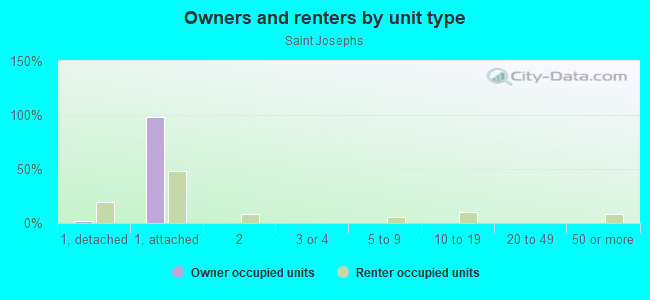
Owner-occupied
Renter-occupied

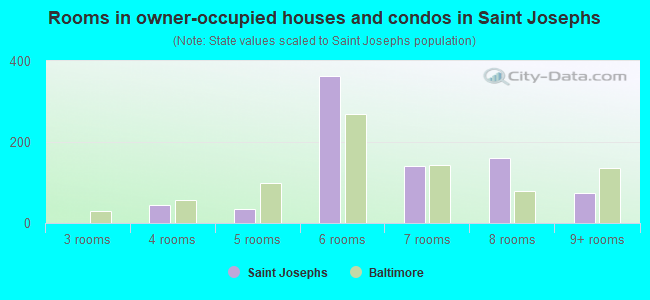
- Rooms in owner-occupied houses and condos in Saint Josephs
- 01 room
- 02 rooms
- 03 rooms
- 444 rooms
- 345 rooms
- 3626 rooms
- 1407 rooms
- 1618 rooms
- 759+ rooms
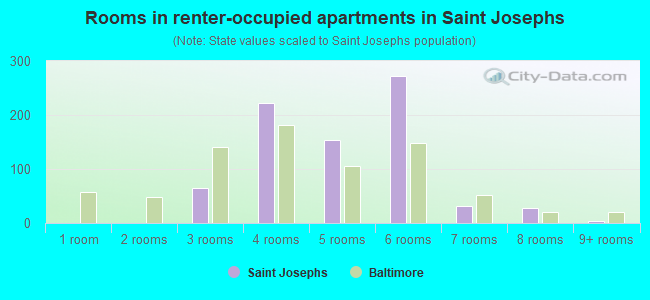
- Rooms in renter-occupied apartments in Saint Josephs
- 01 room
- 02 rooms
- 643 rooms
- 2234 rooms
- 1545 rooms
- 2726 rooms
- 317 rooms
- 278 rooms
- 39+ rooms
Owner-occupied
Renter-occupied
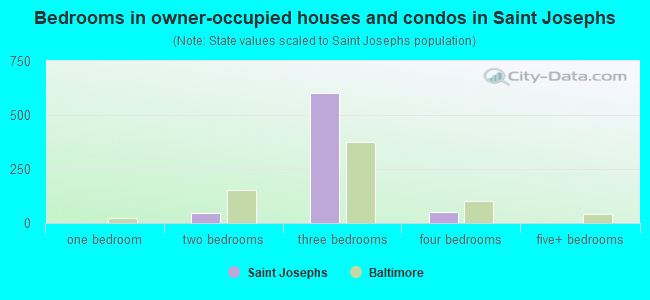
- Bedrooms in owner-occupied houses and condos in Saint Josephs
- 0no bedroom
- 01 bedroom
- 462 bedrooms
- 6033 bedrooms
- 514 bedrooms
- 05+ bedrooms
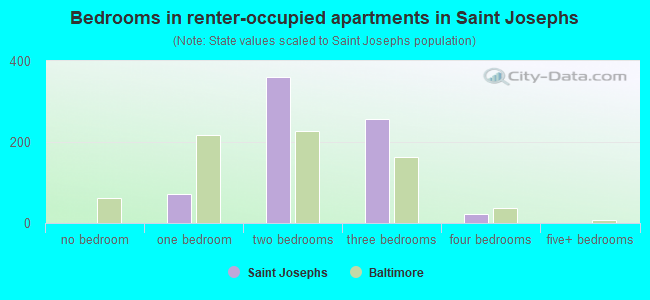
- Bedrooms in renter-occupied apartments in Saint Josephs
- 0no bedroom
- 721 bedroom
- 3602 bedrooms
- 2583 bedrooms
- 224 bedrooms
- 05+ bedrooms
Average number of cars or other vehicles available in houses/condos:
Average number of cars or other vehicles available in apartments:
| This neighborhood: | 0.8 |
| Baltimore: | 1.5 |
Average number of cars or other vehicles available in apartments:
| Here: | 0.5 |
| city: | 0.8 |
Percentage of units with a mortgage:
| Saint Josephs: | 55.2% |
| Baltimore: | 64.3% |
Average estimated value of townhouses or other attached units in 2022 (81.5% of all units):
| This neighborhood: | $106,251 |
| city: | $206,258 |
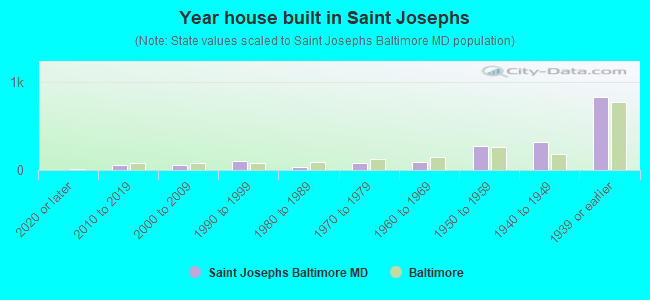
- Year house built in Saint Josephs
- 02020 or later
- 592010 to 2019
- 522000 to 2009
- 991990 to 1999
- 341980 to 1989
- 751970 to 1979
- 931960 to 1969
- 2771950 to 1959
- 3191940 to 1949
- 8251939 or earlier
Travel time to work (commute)
![Travel time to work (commute)]()
- 125 to 9 minutes
- 8210 to 14 minutes
- 4115 to 19 minutes
- 10420 to 24 minutes
- 5525 to 29 minutes
- 24730 to 34 minutes
- 1035 to 39 minutes
- 2140 to 44 minutes
- 845 to 59 minutes
- 2060 to 89 minutes
- 20890 or more minutes

Means of transportation to work
![Means of transportation to work]()
- 46.6%502Drove a car alone
- 14.8%159Carpooled
- 35.5%383Bus
- 0.2%2Long-distance train or commuter rail
- 12.3%133Walked
- 4.5%49Worked at home

Time leaving home to go to work
![Time leaving home to go to work]()
- 6512:00 a.m. to 4:59 a.m.
- 1965:00 a.m. to 5:29 a.m.
- 275:30 a.m. to 5:59 a.m.
- 1366:00 a.m. to 6:29 a.m.
- 296:30 a.m. to 6:59 a.m.
- 577:00 a.m. to 7:29 a.m.
- 737:30 a.m. to 7:59 a.m.
- 908:00 a.m. to 8:29 a.m.
- 328:30 a.m. to 8:59 a.m.
- 269:00 a.m. to 9:59 a.m.
- 4510:00 a.m. to 10:59 a.m.
- 611:00 a.m. to 11:59 a.m.
- 2712:00 p.m. to 3:59 p.m.
- 154:00 p.m. to 11:59 p.m.

Occupations of males:
- Percentage of males in management occupations (except farmers):
Here: 6.8% city: 10.7%
- Percentage of males in computer and mathematical occupations:
Here: 3.0% city: 6.1%
- Percentage of males in service occupations:
Here: 8.0% city: 14.7%
- Percentage of males in sales and office occupations:
Here: 9.4% city: 14.2%
- Percentage of males in construction, extraction, and maintenance occupations:
Here: 5.0% city: 5.6%
- Percentage of males in production occupations:
Here: 2.8% city: 4.2%
- Percentage of males in material moving occupations:
Here: 61.6% city: 7.0%
Occupations of females:
- Percentage of females in management occupations (except farmers):
Here: 2.9% city: 10.1%
- Percentage of females in business and financial operations occupations:
Here: 8.2% city: 6.6%
- Percentage of females in computer and mathematical occupations:
Here: 5.4% city: 2.4%
- Percentage of females in service occupations:
Here: 31.4% city: 20.4%
- Percentage of females in sales and office occupations:
Here: 37.6% city: 22.3%
- Percentage of females in production occupations:
Here: 6.9% city: 2.3%
- Percentage of females in transportation occupations:
Here: 6.6% city: 1.7%
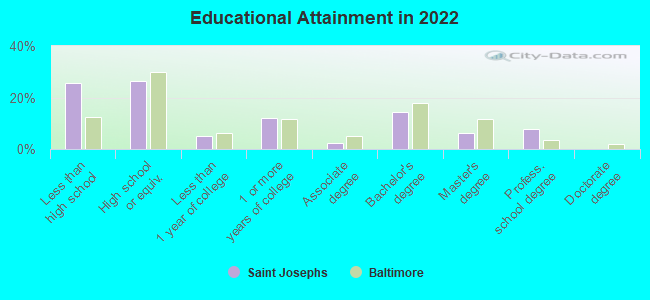
Education in this neighborhood (subdivision or community):
- Percentage of people 3 years and older in K-12 schools:
Saint Josephs: 27.9% Baltimore: 14.7%
- Percentage of people 3 years and older in undergraduate colleges:
Saint Josephs: 7.4% Baltimore: 6.0%
- Percentage of people 3 years and older in grad. or professional schools:
Saint Josephs: 3.6% Baltimore: 2.8%
- Percentage of students K-12 enrolled in private schools:
Saint Josephs: 0.0% Baltimore: 12.7%
Percentage of population below poverty level:
| Saint Josephs: | 25.5% |
| Baltimore: | 18.5% |
Median year owner moved in (as recorded in 2022):
| Saint Josephs: | 2002 |
| Baltimore: | 2009 |
Percentage of married-couple families with both working:
| Saint Josephs: | 228.2% |
| Baltimore: | 79.2% |
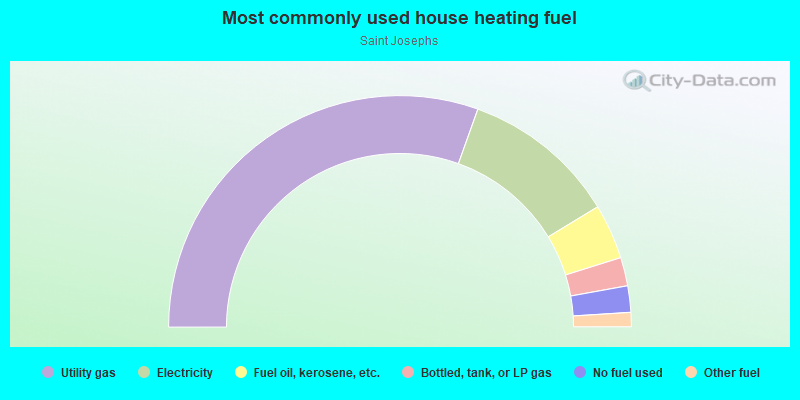
- 61.0%Utility gas
- 21.7%Electricity
- 7.7%Fuel oil, kerosene, etc.
- 4.0%Bottled, tank, or LP gas
- 3.7%No fuel used
- 2.0%Other fuel
Roads and streets:
N Culver St
Length: 0.43 miles
Directions: E-W, SW-NE
Address range: 1 to 399
Directions: E-W, SW-NE
Address range: 1 to 399
S Caton Ave
Length: 0.29 miles
Directions: E-W, N-S, SE-NW
Address range: 1 to 299
Directions: E-W, N-S, SE-NW
Address range: 1 to 299
W Caton Ave
Length: 0.23 miles
Direction: SE-NW
Address range: 3315 to 3599
Direction: SE-NW
Address range: 3315 to 3599
St Joseph St
Length: 0.22 miles
Direction: SE-NW
Address range: 3400 to 3599
Direction: SE-NW
Address range: 3400 to 3599
S Monastery Ave
Length: 0.22 miles
Direction: SW-NE
Address range: 1 to 169
Direction: SW-NE
Address range: 1 to 169
N Kossuth St
Length: 0.21 miles
Directions: E-W, SW-NE
Address range: 1 to 199
Directions: E-W, SW-NE
Address range: 1 to 199
S Culver St
Length: 0.19 miles
Direction: SW-NE
Address range: 1 to 174
Direction: SW-NE
Address range: 1 to 174
S Kossuth St
Length: 0.16 miles
Direction: SW-NE
Address range: 1 to 99
Direction: SW-NE
Address range: 1 to 99
N Monastery Ave
Length: 0.16 miles
Direction: SW-NE
Address range: 1 to 99
Direction: SW-NE
Address range: 1 to 99
S Morley St
Length: 0.16 miles
Direction: SW-NE
Address range: 1 to 99
Direction: SW-NE
Address range: 1 to 99
S Hilton St
Length: 0.13 miles
Direction: N-S
Address range: 1 to 137
Direction: N-S
Address range: 1 to 137
Benkert Ave
Length: 0.13 miles
Direction: SW-NE
Address range: 1 to 99
Direction: SW-NE
Address range: 1 to 99
N Hilton St
Length: 0.11 miles
Direction: N-S
Address range: 1 to 244
Direction: N-S
Address range: 1 to 244
Leeds St
Length: 0.08 miles
Direction: E-W
Address range: 3500 to 3599
Direction: E-W
Address range: 3500 to 3599
W Baltimore St
Length: 0.06 miles
Directions: E-W, SE-NW
Address range: 3300 to 3321
Directions: E-W, SE-NW
Address range: 3300 to 3321
N Morley St
Length: 0.05 miles
Direction: SW-NE
Address range: 1 to 17
Direction: SW-NE
Address range: 1 to 17
W Lexington St
Length: 0.05 miles
Direction: SE-NW
Address range: 3100 to 3199
Direction: SE-NW
Address range: 3100 to 3199
Lohrs St
Length: 0.05 miles
Direction: E-W
Address range: 3300 to 3399
Direction: E-W
Address range: 3300 to 3399
Massachusetts Ave
Length: 0.04 miles
Direction: E-W
Address range: 3300 to 3399
Direction: E-W
Address range: 3300 to 3399
Siegwart Ln
Length: 0.01 miles
Direction: SW-NE
Address range: 100 to 128
Direction: SW-NE
Address range: 100 to 128