Scott Valley neighborhood in Mill Valley, California (CA), 94941 detailed profile
Settings
X


Business Search - 14 Million verified businesses
Area: 0.349 square miles
Population: 1,097
Population density:
| Scott Valley: | 3,147 people per square mile |
| Mill Valley: | 3,010 people per square mile |

- 82575.3%White
- 1019.2%Asian
- 666.0%Two or more races
- 635.7%Hispanic or Latino
- 353.2%Some other race
- 60.5%Black

Median household income in 2022:
| Scott Valley: | $220,445 |
| Mill Valley: | $202,986 |
Distribution of median household income
![Distribution of median household income]()
- 15Less than $10,000
- 8$10,000 to $19,999
- 25$20,000 to $29,999
- 2$30,000 to $39,999
- 19$40,000 to $49,999
- 29$50,000 to $59,999
- 16$60,000 to $74,999
- 23$75,000 to $99,999
- 27$100,000 to $124,999
- 60$125,000 to $149,999
- 36$150,000 to $199,999
- 204$200,000 or more

Distribution of owner-occupied house/condo value
![Distribution of owner-occupied house/condo value]()
- 8Less than $50,000
- 2$150,000 to $199,999
- 3$300,000 to $399,999
- 11$500,000 to $749,999
- 15$750,000 to $999,999
- 295$1,000,000 or more

Distribution of rent paid by renters
![Distribution of rent paid by renters]()
- 17$200 to $299
- 5$900 to $999
- 6$1,000 to $1,249
- 8$1,250 to $1,499
- 5$1,500 to $1,999
- 94$2,000 or more

Median rent in 2022:
| Scott Valley: | $2,880 |
| Mill Valley: | $2,001 |
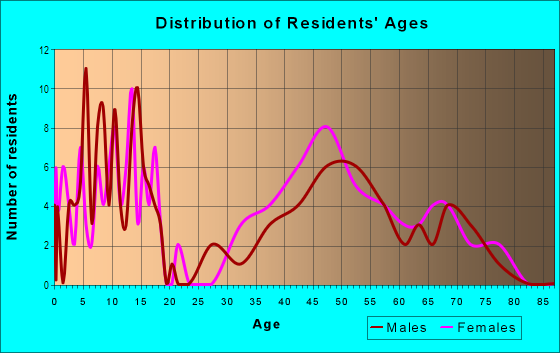
| Males: | 506 |
| Females: | 590 |
Males:
| This neighborhood: | 40.9 years |
| Whole city: | 46.4 years |
| This neighborhood: | 48.8 years |
| Whole city: | 47.3 years |
Average household size:
| Scott Valley: | 2.7 people |
| Mill Valley: | 2.5 people |
Percentage of family households:
| Scott Valley: | 50.4% |
| Mill Valley: | 47.2% |
| Here: | 61.5% |
| Mill Valley: | 56.3% |
Percentage of married-couple families with children (among all households):
| Scott Valley: | 34.5% |
| Mill Valley: | 32.4% |
Percentage of single-mother households (among all households):
| Scott Valley: | 3.4% |
| Mill Valley: | 5.6% |
Percentage of never married males 15 years old and over:
Percentage of never married females 15 years old and over:
| Scott Valley: | 11.1% |
| Mill Valley: | 14.9% |
Percentage of never married females 15 years old and over:
| Scott Valley: | 13.5% |
| city: | 13.2% |
Percentage of people that speak English not well or not at all:
| Scott Valley: | 1.2% |
| Mill Valley: | 0.6% |
Percentage of people born in this state:
Percentage of people born in another U.S. state:
Percentage of native residents but born outside the U.S.:
Percentage of foreign born residents:
| Here: | 43.5% |
| Mill Valley: | 42.0% |
Percentage of people born in another U.S. state:
| Scott Valley: | 33.8% |
| Mill Valley: | 37.9% |
Percentage of native residents but born outside the U.S.:
| Here: | 2.8% |
| city: | 3.5% |
Percentage of foreign born residents:
| Here: | 19.8% |
| Mill Valley: | 16.6% |

Owner-occupied
Renter-occupied


- Rooms in owner-occupied houses and condos in Scott Valley
- 01 room
- 42 rooms
- 63 rooms
- 454 rooms
- 655 rooms
- 596 rooms
- 337 rooms
- 168 rooms
- 969+ rooms

- Rooms in renter-occupied apartments in Scott Valley
- 41 room
- 72 rooms
- 73 rooms
- 664 rooms
- 135 rooms
- 116 rooms
- 57 rooms
- 78 rooms
- 59+ rooms
Owner-occupied
Renter-occupied

- Bedrooms in owner-occupied houses and condos in Scott Valley
- 0no bedroom
- 171 bedroom
- 432 bedrooms
- 1513 bedrooms
- 804 bedrooms
- 395+ bedrooms

- Bedrooms in renter-occupied apartments in Scott Valley
- 4no bedroom
- 71 bedroom
- 712 bedrooms
- 273 bedrooms
- 334 bedrooms
- 05+ bedrooms
Average number of cars or other vehicles available in houses/condos:
Average number of cars or other vehicles available in apartments:
| This neighborhood: | 2.0 |
| Mill Valley: | 2.1 |
Average number of cars or other vehicles available in apartments:
| Here: | 2.1 |
| city: | 1.3 |
Percentage of units with a mortgage:
| Scott Valley: | 76.1% |
| Mill Valley: | 69.0% |
Housing prices:
- Average estimated value of detached houses in 2022 (75.5% of all units):
Scott Valley: $3,244,881 California: $988,808
- Average estimated value of townhouses or other attached units in 2022 (12.8% of all units):
This neighborhood: $610,830 California: $838,546

- Year house built in Scott Valley
- 22020 or later
- 322010 to 2019
- 152000 to 2009
- 41990 to 1999
- 631980 to 1989
- 631970 to 1979
- 851960 to 1969
- 891950 to 1959
- 781940 to 1949
- 161939 or earlier

City-data.com crime index for city in 2020 (higher means more crime):
| City: | 112.2 |
| U.S. average: | 219.5 |
Travel time to work (commute)
![Travel time to work (commute)]()
- 6Less than 5 minutes
- 355 to 9 minutes
- 5710 to 14 minutes
- 3815 to 19 minutes
- 1120 to 24 minutes
- 725 to 29 minutes
- 1830 to 34 minutes
- 535 to 39 minutes
- 1240 to 44 minutes
- 3645 to 59 minutes
- 3360 to 89 minutes
- 590 or more minutes

Means of transportation to work
![Means of transportation to work]()
- 59.6%261Drove a car alone
- 2.3%10Carpooled
- 1.4%6Bus
- 3.4%15Walked
- 0.9%4Other means
- 34.2%150Worked at home

Time leaving home to go to work
![Time leaving home to go to work]()
- 1812:00 a.m. to 4:59 a.m.
- 65:00 a.m. to 5:29 a.m.
- 175:30 a.m. to 5:59 a.m.
- 116:00 a.m. to 6:29 a.m.
- 46:30 a.m. to 6:59 a.m.
- 467:00 a.m. to 7:29 a.m.
- 237:30 a.m. to 7:59 a.m.
- 428:00 a.m. to 8:29 a.m.
- 338:30 a.m. to 8:59 a.m.
- 339:00 a.m. to 9:59 a.m.
- 1710:00 a.m. to 10:59 a.m.
- 1211:00 a.m. to 11:59 a.m.
- 1312:00 p.m. to 3:59 p.m.
- 24:00 p.m. to 11:59 p.m.

Occupations of males:
- Percentage of males in management occupations (except farmers):
Here: 25.7% city: 28.2%
- Percentage of males in business and financial operations occupations:
Here: 12.8% city: 8.7%
- Percentage of males in computer and mathematical occupations:
Here: 5.3% city: 6.1%
- Percentage of males in architecture and engineering occupations:
Here: 2.9% city: 5.1%
- Percentage of males in life, physical, and social science occupations:
Here: 6.1% city: 2.0%
- Percentage of males in community and social services occupations:
Here: 2.1% city: 0.2%
- Percentage of males in legal occupations:
Here: 6.3% city: 5.9%
- Percentage of males in arts, design, entertainment, sports, and media occupations:
Here: 6.6% city: 6.4%
- Percentage of males in healthcare practitioners and technical occupations:
Here: 2.6% city: 6.5%
- Percentage of males in service occupations:
Here: 1.3% city: 4.6%
- Percentage of males in sales and office occupations:
Here: 32.1% city: 18.4%
- Percentage of males in transportation occupations:
Here: 1.3% city: 1.2%
Occupations of females:
- Percentage of females in management occupations (except farmers):
Here: 7.2% city: 22.1%
- Percentage of females in business and financial operations occupations:
Here: 11.0% city: 9.4%
- Percentage of females in computer and mathematical occupations:
Here: 2.5% city: 2.2%
- Percentage of females in architecture and engineering occupations:
Here: 1.4% city: 1.5%
- Percentage of females in life, physical, and social science occupations:
Here: 3.6% city: 3.3%
- Percentage of females in community and social services occupations:
Here: 2.2% city: 2.8%
- Percentage of females in legal occupations:
Here: 12.2% city: 3.7%
- Percentage of females in education, training, and library occupations:
Here: 8.6% city: 12.8%
- Percentage of females in arts, design, entertainment, sports, and media occupations:
Here: 8.2% city: 8.3%
- Percentage of females in healthcare practitioners and technical occupations:
Here: 21.5% city: 12.4%
- Percentage of females in service occupations:
Here: 11.8% city: 7.5%
- Percentage of females in sales and office occupations:
Here: 8.4% city: 11.9%
- Percentage of females in material moving occupations:
Here: 2.6% city: 0.4%
Education in this neighborhood (subdivision or community):
- Percentage of people 3 years and older in K-12 schools:
Scott Valley: 19.8% Mill Valley: 18.4%
- Percentage of people 3 years and older in undergraduate colleges:
Scott Valley: 2.1% Mill Valley: 2.6%
- Percentage of people 3 years and older in grad. or professional schools:
Scott Valley: 1.1% Mill Valley: 1.8%
- Percentage of students K-12 enrolled in private schools:
Scott Valley: 31.6% Mill Valley: 32.0%
Percentage of population below poverty level:
| Scott Valley: | 5.2% |
| Mill Valley: | 4.6% |
Median year owner moved in (as recorded in 2022):
Median year renter moved in (as recorded in 2022):
| Scott Valley: | 2000 |
| Mill Valley: | 2003 |
Median year renter moved in (as recorded in 2022):
| Scott Valley: | 2016 |
| Mill Valley: | 2014 |
Percentage of married-couple families with both working:
| Scott Valley: | 61.3% |
| Mill Valley: | 61.5% |

- 74.5%Utility gas
- 20.1%Electricity
- 2.3%No fuel used
- 1.6%Bottled, tank, or LP gas
- 1.6%Solar energy
Roads and streets:
Underhill Rd
Length: 0.93 miles
Directions: E-W, N-S, SE-NW, SW-NE
Address range: 1 to 199
Directions: E-W, N-S, SE-NW, SW-NE
Address range: 1 to 199
Benson Cir
Length: 0.36 miles
Directions: E-W, N-S, SE-NW, SW-NE
Address range: 1 to 299
Directions: E-W, N-S, SE-NW, SW-NE
Address range: 1 to 299
Cam Alto
Length: 0.36 miles
Directions: E-W, N-S, SE-NW, SW-NE
Address range: 217 to 298
Directions: E-W, N-S, SE-NW, SW-NE
Address range: 217 to 298
Azalea Dr
Length: 0.33 miles
Directions: N-S, SE-NW, SW-NE
Address range: 1 to 499
Directions: N-S, SE-NW, SW-NE
Address range: 1 to 499
Lomita Dr
Length: 0.31 miles
Directions: E-W, N-S, SW-NE
Address range: 28 to 133
Directions: E-W, N-S, SW-NE
Address range: 28 to 133
Stanton Way
Length: 0.31 miles
Directions: E-W, N-S, SE-NW, SW-NE
Address range: 1 to 3499
Directions: E-W, N-S, SE-NW, SW-NE
Address range: 1 to 3499
Vasco Dr
Length: 0.25 miles
Directions: E-W, N-S, SW-NE
Address range: 1 to 98
Directions: E-W, N-S, SW-NE
Address range: 1 to 98
Eton Way
Length: 0.24 miles
Directions: E-W, N-S, SE-NW, SW-NE
Address range: 1 to 99
Directions: E-W, N-S, SE-NW, SW-NE
Address range: 1 to 99
Vasco Ct
Length: 0.23 miles
Directions: E-W, SE-NW
Address range: 1 to 99
Directions: E-W, SE-NW
Address range: 1 to 99
Midhill Dr
Length: 0.21 miles
Directions: E-W, N-S, SW-NE
Address range: 1 to 99
Directions: E-W, N-S, SW-NE
Address range: 1 to 99
Lower Dr
Length: 0.17 miles
Directions: E-W, N-S, SE-NW, SW-NE
Address range: 1 to 99
Directions: E-W, N-S, SE-NW, SW-NE
Address range: 1 to 99
Salt Creek Ln
Length: 0.15 miles
Directions: E-W, N-S, SE-NW, SW-NE
Address range: 1 to 99
Directions: E-W, N-S, SE-NW, SW-NE
Address range: 1 to 99
Upperhill Rd
Length: 0.10 miles
Directions: SE-NW, SW-NE
Address range: 1 to 99
Directions: SE-NW, SW-NE
Address range: 1 to 99
Lula Way
Length: 0.09 miles
Directions: E-W, N-S, SE-NW
Address range: 1 to 99
Directions: E-W, N-S, SE-NW
Address range: 1 to 99
Lois Ct
Length: 0.09 miles
Directions: N-S, SE-NW, SW-NE
Address range: 22 to 99
Directions: N-S, SE-NW, SW-NE
Address range: 22 to 99
Patricia Ln
Length: 0.08 miles
Direction: E-W
Address range: 1 to 99
Direction: E-W
Address range: 1 to 99
Stanton Pl
Length: 0.08 miles
Directions: N-S, SE-NW, SW-NE
Directions: N-S, SE-NW, SW-NE
Hollyhock Ct
Length: 0.07 miles
Direction: E-W
Address range: 1 to 99
Direction: E-W
Address range: 1 to 99
George Ln
Length: 0.06 miles
Directions: N-S, SE-NW, SW-NE
Address range: 1 to 99
Directions: N-S, SE-NW, SW-NE
Address range: 1 to 99
Saltcreek
Length: 0.06 miles
Directions: E-W, SE-NW
Directions: E-W, SE-NW
Middle Ct
Length: 0.06 miles
Directions: N-S, SE-NW
Address range: 1 to 99
Directions: N-S, SE-NW
Address range: 1 to 99
Coach Rd
Length: 0.06 miles
Directions: N-S, SW-NE
Address range: 1 to 99
Directions: N-S, SW-NE
Address range: 1 to 99
Albert Ln
Length: 0.06 miles
Directions: E-W, N-S, SE-NW
Directions: E-W, N-S, SE-NW
Grace Ln
Length: 0.05 miles
Direction: E-W
Address range: 1 to 199
Direction: E-W
Address range: 1 to 199
Morton Ct
Length: 0.04 miles
Directions: E-W, SE-NW
Address range: 1 to 99
Directions: E-W, SE-NW
Address range: 1 to 99
Compton Cir
Length: 0.04 miles
Direction: SW-NE
Address range: 1 to 99
Direction: SW-NE
Address range: 1 to 99
Aster Ct
Length: 0.02 miles
Direction: E-W
Address range: 1 to 99
Direction: E-W
Address range: 1 to 99