Tinkers Creek neighborhood in Bedford, Ohio (OH), 44137, 44146 detailed profile
Settings
X


Business Search - 14 Million verified businesses
Area: 1.001 square miles
Population: 709
Population density:
| Tinkers Creek: | 708 people per square mile |
| Bedford: | 2,435 people per square mile |

- 45262.3%Black
- 25034.5%White
- 111.5%Some other race
- 60.8%Asian
- 30.4%Two or more races
- 30.4%Hispanic or Latino

Median household income in 2022:
| Tinkers Creek: | $85,605 |
| Bedford: | $55,198 |
Distribution of median household income
![Distribution of median household income]()
- 15Less than $10,000
- 39$10,000 to $19,999
- 9$20,000 to $29,999
- 49$30,000 to $39,999
- 145$40,000 to $49,999
- 58$50,000 to $59,999
- 51$60,000 to $74,999
- 21$75,000 to $99,999
- 21$100,000 to $124,999
- 11$125,000 to $149,999
- 5$150,000 to $199,999
- 13$200,000 or more

Distribution of owner-occupied house/condo value
![Distribution of owner-occupied house/condo value]()
- 15Less than $50,000
- 72$50,000 to $99,999
- 28$100,000 to $149,999
- 15$150,000 to $199,999
- 38$200,000 to $249,999
- 11$250,000 to $299,999
- 17$300,000 to $399,999
- 5$400,000 to $499,999
- 2$500,000 to $749,999

Distribution of rent paid by renters
![Distribution of rent paid by renters]()
- 5$300 to $399
- 3$500 to $599
- 17$600 to $699
- 77$700 to $799
- 77$800 to $899
- 238$900 to $999
- 5$1,000 to $1,249
- 16$1,250 to $1,499
- 2$1,500 to $1,999

Median rent in 2022:
| Tinkers Creek: | $960 |
| Bedford: | $897 |
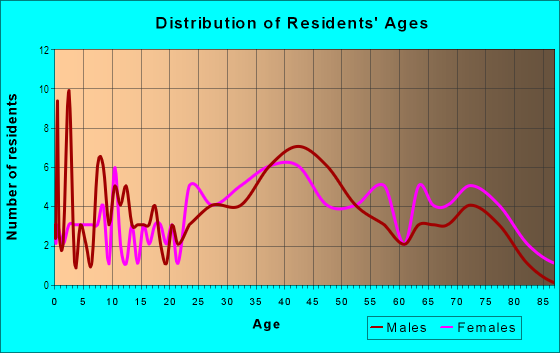
| Males: | 380 |
| Females: | 329 |
Males:
| This neighborhood: | 52.8 years |
| Whole city: | 37.2 years |
| This neighborhood: | 56.3 years |
| Whole city: | 46.0 years |
Average household size:
| Tinkers Creek: | 1.9 people |
| Bedford: | 2.1 people |
Percentage of family households:
| Tinkers Creek: | 30.9% |
| Bedford: | 34.3% |
| Here: | 21.9% |
| Bedford: | 25.8% |
Percentage of married-couple families with children (among all households):
| Tinkers Creek: | 5.8% |
| Bedford: | 13.3% |
Percentage of single-mother households (among all households):
| Tinkers Creek: | 46.9% |
| Bedford: | 27.1% |
Percentage of never married males 15 years old and over:
Percentage of never married females 15 years old and over:
| Tinkers Creek: | 20.6% |
| Bedford: | 20.7% |
Percentage of never married females 15 years old and over:
| Tinkers Creek: | 24.5% |
| city: | 18.9% |
Percentage of people that speak English not well or not at all:
| Tinkers Creek: | 0.3% |
| Bedford: | 0.6% |
Percentage of people born in this state:
Percentage of people born in another U.S. state:
Percentage of native residents but born outside the U.S.:
Percentage of foreign born residents:
| Here: | 81.6% |
| Bedford: | 83.1% |
Percentage of people born in another U.S. state:
| Tinkers Creek: | 13.1% |
| Bedford: | 12.3% |
Percentage of native residents but born outside the U.S.:
| Here: | 4.6% |
| city: | 1.4% |
Percentage of foreign born residents:
| Here: | 0.7% |
| Bedford: | 3.2% |

Owner-occupied
Renter-occupied


- Rooms in owner-occupied houses and condos in Tinkers Creek
- 11 room
- 02 rooms
- 03 rooms
- 294 rooms
- 85 rooms
- 696 rooms
- 227 rooms
- 288 rooms
- 219+ rooms

- Rooms in renter-occupied apartments in Tinkers Creek
- 41 room
- 252 rooms
- 523 rooms
- 2164 rooms
- 375 rooms
- 226 rooms
- 87 rooms
- 58 rooms
- 09+ rooms
Owner-occupied
Renter-occupied

- Bedrooms in owner-occupied houses and condos in Tinkers Creek
- 1no bedroom
- 01 bedroom
- 112 bedrooms
- 1133 bedrooms
- 254 bedrooms
- 05+ bedrooms

- Bedrooms in renter-occupied apartments in Tinkers Creek
- 4no bedroom
- 2001 bedroom
- 982 bedrooms
- 283 bedrooms
- 14 bedrooms
- 05+ bedrooms
Average number of cars or other vehicles available in houses/condos:
Average number of cars or other vehicles available in apartments:
| This neighborhood: | 2.4 |
| Bedford: | 1.9 |
Average number of cars or other vehicles available in apartments:
| Here: | 1.4 |
| city: | 1.2 |
Percentage of units with a mortgage:
| Tinkers Creek: | 67.5% |
| Bedford: | 64.6% |
Average estimated value of detached houses in 2022 (44.1% of all units):
| Tinkers Creek: | $165,154 |
| Ohio: | $254,366 |

- Year house built in Tinkers Creek
- 02020 or later
- 12010 to 2019
- 72000 to 2009
- 171990 to 1999
- 1061980 to 1989
- 521970 to 1979
- 941960 to 1969
- 911950 to 1959
- 231940 to 1949
- 471939 or earlier

City-data.com crime index for city in 2020 (higher means more crime):
| City: | 81.2 |
| U.S. average: | 219.5 |
Travel time to work (commute)
![Travel time to work (commute)]()
- 6Less than 5 minutes
- 375 to 9 minutes
- 3210 to 14 minutes
- 5715 to 19 minutes
- 4920 to 24 minutes
- 4725 to 29 minutes
- 7230 to 34 minutes
- 735 to 39 minutes
- 640 to 44 minutes
- 1645 to 59 minutes
- 660 to 89 minutes
- 290 or more minutes

Means of transportation to work
![Means of transportation to work]()
- 87.3%314Drove a car alone
- 1.7%6Carpooled
- 3.1%11Bus
- 1.7%6Other means
- 7.8%28Worked at home

Time leaving home to go to work
![Time leaving home to go to work]()
- 2112:00 a.m. to 4:59 a.m.
- 75:00 a.m. to 5:29 a.m.
- 75:30 a.m. to 5:59 a.m.
- 136:00 a.m. to 6:29 a.m.
- 316:30 a.m. to 6:59 a.m.
- 257:00 a.m. to 7:29 a.m.
- 337:30 a.m. to 7:59 a.m.
- 578:00 a.m. to 8:29 a.m.
- 608:30 a.m. to 8:59 a.m.
- 139:00 a.m. to 9:59 a.m.
- 1010:00 a.m. to 10:59 a.m.
- 111:00 a.m. to 11:59 a.m.
- 1312:00 p.m. to 3:59 p.m.
- 354:00 p.m. to 11:59 p.m.

Occupations of males:
- Percentage of males in management occupations (except farmers):
Here: 21.1% city: 13.4%
- Percentage of males in computer and mathematical occupations:
Here: 3.6% city: 2.3%
- Percentage of males in architecture and engineering occupations:
Here: 3.8% city: 1.8%
- Percentage of males in healthcare practitioners and technical occupations:
Here: 1.5% city: 1.1%
- Percentage of males in service occupations:
Here: 2.3% city: 10.9%
- Percentage of males in sales and office occupations:
Here: 13.1% city: 13.0%
- Percentage of males in production occupations:
Here: 16.2% city: 12.4%
- Percentage of males in transportation occupations:
Here: 11.9% city: 8.1%
- Percentage of males in material moving occupations:
Here: 22.0% city: 10.9%
Occupations of females:
- Percentage of females in computer and mathematical occupations:
Here: 3.1% city: 0.8%
- Percentage of females in architecture and engineering occupations:
Here: 2.0% city: 1.1%
- Percentage of females in life, physical, and social science occupations:
Here: 3.5% city: 1.8%
- Percentage of females in community and social services occupations:
Here: 1.4% city: 2.7%
- Percentage of females in arts, design, entertainment, sports, and media occupations:
Here: 1.2% city: 0.9%
- Percentage of females in healthcare practitioners and technical occupations:
Here: 5.5% city: 3.1%
- Percentage of females in service occupations:
Here: 7.5% city: 16.2%
- Percentage of females in sales and office occupations:
Here: 51.9% city: 40.8%
- Percentage of females in production occupations:
Here: 9.9% city: 7.2%
- Percentage of females in material moving occupations:
Here: 13.0% city: 2.5%
Education in this neighborhood (subdivision or community):
- Percentage of people 3 years and older in K-12 schools:
Tinkers Creek: 17.6% Bedford: 15.7%
- Percentage of people 3 years and older in undergraduate colleges:
Tinkers Creek: 5.2% Bedford: 2.8%
- Percentage of people 3 years and older in grad. or professional schools:
Tinkers Creek: 0.6% Bedford: 0.8%
- Percentage of students K-12 enrolled in private schools:
Tinkers Creek: 36.9% Bedford: 21.9%
Percentage of population below poverty level:
| Tinkers Creek: | 9.0% |
| Bedford: | 11.6% |
Median year owner moved in (as recorded in 2022):
Median year renter moved in (as recorded in 2022):
| Tinkers Creek: | 2000 |
| Bedford: | 2004 |
Median year renter moved in (as recorded in 2022):
| Tinkers Creek: | 2015 |
| Bedford: | 2016 |
Percentage of married-couple families with both working:
| Tinkers Creek: | 108.6% |
| Bedford: | 66.9% |

- 60.3%Utility gas
- 32.3%Electricity
- 4.5%Other fuel
- 1.4%Bottled, tank, or LP gas
- 1.0%No fuel used
- 0.5%Wood
Roads and streets:
Button Rd (W Grace St)
Length: 0.63 miles
Direction: SW-NE
Address range: 488 to 679
Direction: SW-NE
Address range: 488 to 679
Button Rd
Length: 0.48 miles
Directions: E-W, SW-NE
Address range: 680 to 799
Directions: E-W, SW-NE
Address range: 680 to 799
Santin Cir
Length: 0.46 miles
Directions: E-W, N-S, SW-NE
Address range: 1 to 169
Directions: E-W, N-S, SW-NE
Address range: 1 to 169
Shawnee Ln
Length: 0.25 miles
Directions: N-S, SE-NW, SW-NE
Address range: 500 to 675
Directions: N-S, SE-NW, SW-NE
Address range: 500 to 675
Broadmore Ave
Length: 0.22 miles
Direction: E-W
Address range: 1 to 99
Direction: E-W
Address range: 1 to 99
Beverly Dr
Length: 0.14 miles
Direction: E-W
Address range: 1 to 99
Direction: E-W
Address range: 1 to 99
South Cir
Length: 0.10 miles
Directions: N-S, SE-NW, SW-NE
Address range: 1 to 100
Directions: N-S, SE-NW, SW-NE
Address range: 1 to 100
W Glendale St
Length: 0.08 miles
Direction: N-S
Address range: 700 to 799
Direction: N-S
Address range: 700 to 799
Other features:
Tinkers Crk
Length: 2.24 miles
Directions: E-W, N-S, SE-NW, SW-NE
Directions: E-W, N-S, SE-NW, SW-NE