Village Center neighborhood in Chula Vista, California (CA), 91913, 91914, 91915 detailed profile
Settings
X


Business Search - 14 Million verified businesses
Area: 0.106 square miles
Population: 771
Population density:
| Village Center: | 7,244 people per square mile |
| Chula Vista: | 5,711 people per square mile |

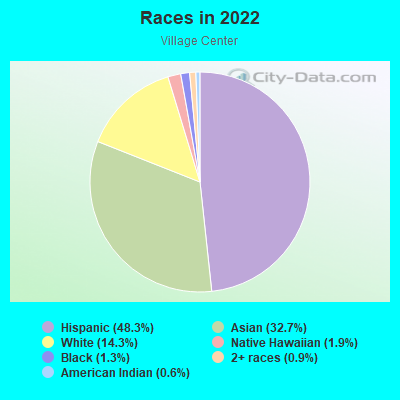
- 37948.3%Hispanic or Latino
- 25732.7%Asian
- 11214.3%White
- 151.9%Native Hawaiian and Other
Pacific Islander - 101.3%Black
- 70.9%Two or more races
- 50.6%American Indian
Median household income in 2022:
| Village Center: | $102,711 |
| Chula Vista: | $101,190 |
Distribution of median household income
![Distribution of median household income]()
- 8Less than $10,000
- 30$10,000 to $19,999
- 101$20,000 to $29,999
- 37$30,000 to $39,999
- 42$40,000 to $49,999
- 11$50,000 to $59,999
- 14$60,000 to $74,999
- 54$75,000 to $99,999
- 42$100,000 to $124,999
- 21$125,000 to $149,999
- 21$150,000 to $199,999
- 68$200,000 or more

Distribution of owner-occupied house/condo value
![Distribution of owner-occupied house/condo value]()
- 43Less than $50,000
- 88$50,000 to $99,999
- 50$100,000 to $149,999
- 9$150,000 to $199,999
- 12$200,000 to $249,999
- 7$250,000 to $299,999
- 27$300,000 to $399,999
- 31$400,000 to $499,999
- 79$500,000 to $749,999
- 55$750,000 to $999,999
- 6$1,000,000 or more

Distribution of rent paid by renters
![Distribution of rent paid by renters]()
- 10$1,000 to $1,249
- 19$1,500 to $1,999
- 265$2,000 or more

| Males: | 377 |
| Females: | 394 |
Males:
| This neighborhood: | 39.0 years |
| Whole city: | 34.8 years |
| This neighborhood: | 40.0 years |
| Whole city: | 37.4 years |
Average household size:
| Village Center: | 2.8 people |
| Chula Vista: | 3.2 people |
Percentage of family households:
| Village Center: | 64.6% |
| Chula Vista: | 57.2% |
| Here: | 52.8% |
| Chula Vista: | 54.5% |
Percentage of married-couple families with children (among all households):
| Village Center: | 32.8% |
| Chula Vista: | 22.9% |
Percentage of single-mother households (among all households):
| Village Center: | 24.5% |
| Chula Vista: | 5.5% |
Percentage of never married males 15 years old and over:
Percentage of never married females 15 years old and over:
| Village Center: | 26.3% |
| Chula Vista: | 19.8% |
Percentage of never married females 15 years old and over:
| Village Center: | 13.5% |
| city: | 16.5% |
Percentage of people that speak English not well or not at all:
| Village Center: | 3.4% |
| Chula Vista: | 8.7% |
Percentage of people born in this state:
Percentage of people born in another U.S. state:
Percentage of native residents but born outside the U.S.:
Percentage of foreign born residents:
| Here: | 52.4% |
| Chula Vista: | 56.5% |
Percentage of people born in another U.S. state:
| Village Center: | 16.5% |
| Chula Vista: | 13.1% |
Percentage of native residents but born outside the U.S.:
| Here: | 3.5% |
| city: | 2.8% |
Percentage of foreign born residents:
| Here: | 27.6% |
| Chula Vista: | 27.6% |
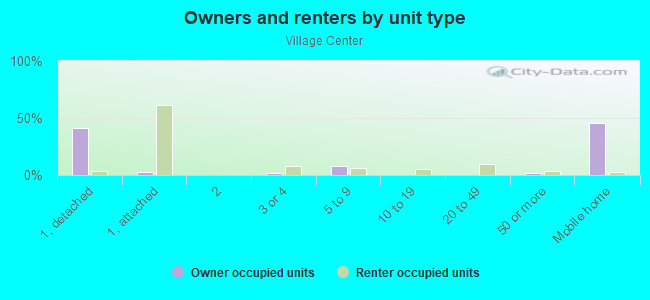
Owner-occupied
Renter-occupied


- Rooms in owner-occupied houses and condos in Village Center
- 01 room
- 12 rooms
- 53 rooms
- 804 rooms
- 345 rooms
- 356 rooms
- 87 rooms
- 258 rooms
- 159+ rooms

- Rooms in renter-occupied apartments in Village Center
- 01 room
- 02 rooms
- 53 rooms
- 834 rooms
- 125 rooms
- 536 rooms
- 07 rooms
- 188 rooms
- 09+ rooms
Owner-occupied
Renter-occupied
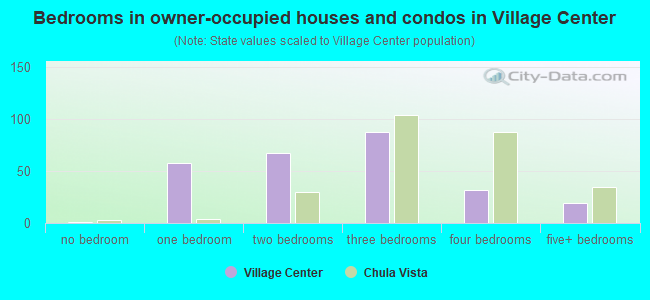
- Bedrooms in owner-occupied houses and condos in Village Center
- 1no bedroom
- 581 bedroom
- 672 bedrooms
- 883 bedrooms
- 324 bedrooms
- 195+ bedrooms
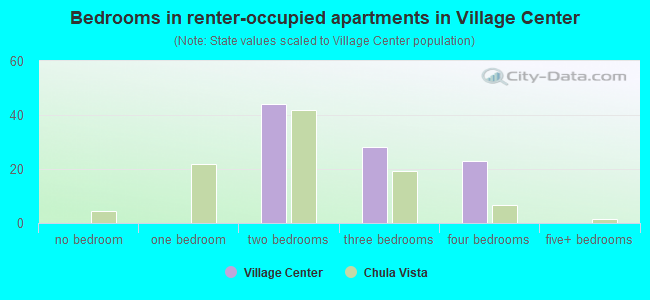
- Bedrooms in renter-occupied apartments in Village Center
- 0no bedroom
- 01 bedroom
- 442 bedrooms
- 283 bedrooms
- 234 bedrooms
- 05+ bedrooms
Average number of cars or other vehicles available in houses/condos:
Average number of cars or other vehicles available in apartments:
| This neighborhood: | 1.7 |
| Chula Vista: | 2.4 |
Average number of cars or other vehicles available in apartments:
| Here: | 2.1 |
| city: | 1.7 |
Percentage of units with a mortgage:
| Village Center: | 69.8% |
| Chula Vista: | 76.0% |
Average estimated value of detached houses in 2022 (59.1% of all units):
| Village Center: | $791,573 |
| California: | $988,808 |
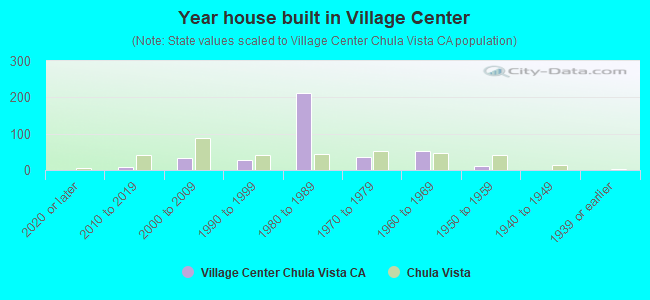
- Year house built in Village Center
- 02020 or later
- 92010 to 2019
- 332000 to 2009
- 271990 to 1999
- 2111980 to 1989
- 351970 to 1979
- 511960 to 1969
- 111950 to 1959
- 01940 to 1949
- 01939 or earlier
City-data.com crime index for city in 2020 (higher means more crime):
| City: | 159.8 |
| U.S. average: | 219.5 |
Travel time to work (commute)
![Travel time to work (commute)]()
- 1735 to 9 minutes
- 8510 to 14 minutes
- 18215 to 19 minutes
- 7920 to 24 minutes
- 5125 to 29 minutes
- 39830 to 34 minutes
- 13835 to 39 minutes
- 12340 to 44 minutes
- 5945 to 59 minutes
- 13660 to 89 minutes

Means of transportation to work
![Means of transportation to work]()
- 80.4%372Drove a car alone
- 5.4%25Carpooled
- 2.2%10Motorcycle
- 4.8%22Other means
- 14.3%66Worked at home

Time leaving home to go to work
![Time leaving home to go to work]()
- 8212:00 a.m. to 4:59 a.m.
- 2515:00 a.m. to 5:29 a.m.
- 375:30 a.m. to 5:59 a.m.
- 1876:00 a.m. to 6:29 a.m.
- 796:30 a.m. to 6:59 a.m.
- 2237:00 a.m. to 7:29 a.m.
- 907:30 a.m. to 7:59 a.m.
- 1458:00 a.m. to 8:29 a.m.
- 208:30 a.m. to 8:59 a.m.
- 1189:00 a.m. to 9:59 a.m.
- 810:00 a.m. to 10:59 a.m.
- 5211:00 a.m. to 11:59 a.m.
- 8112:00 p.m. to 3:59 p.m.
- 1484:00 p.m. to 11:59 p.m.

Occupations of males:
- Percentage of males in management occupations (except farmers):
Here: 9.8% city: 9.9%
- Percentage of males in architecture and engineering occupations:
Here: 11.3% city: 4.8%
- Percentage of males in life, physical, and social science occupations:
Here: 10.0% city: 1.2%
- Percentage of males in education, training, and library occupations:
Here: 6.5% city: 2.3%
- Percentage of males in service occupations:
Here: 6.6% city: 18.4%
- Percentage of males in sales and office occupations:
Here: 17.6% city: 16.0%
- Percentage of males in construction, extraction, and maintenance occupations:
Here: 22.2% city: 9.2%
- Percentage of males in production occupations:
Here: 11.8% city: 5.7%
- Percentage of males in transportation occupations:
Here: 10.0% city: 5.1%
Occupations of females:
- Percentage of females in management occupations (except farmers):
Here: 17.4% city: 8.6%
- Percentage of females in business and financial operations occupations:
Here: 3.1% city: 5.6%
- Percentage of females in education, training, and library occupations:
Here: 7.6% city: 7.6%
- Percentage of females in healthcare practitioners and technical occupations:
Here: 23.2% city: 10.6%
- Percentage of females in service occupations:
Here: 5.9% city: 22.6%
- Percentage of females in sales and office occupations:
Here: 49.4% city: 29.5%
Percentage of people 16-64 in Armed Forces:
| Village Center: | 1.8% |
| Chula Vista: | 4.1% |
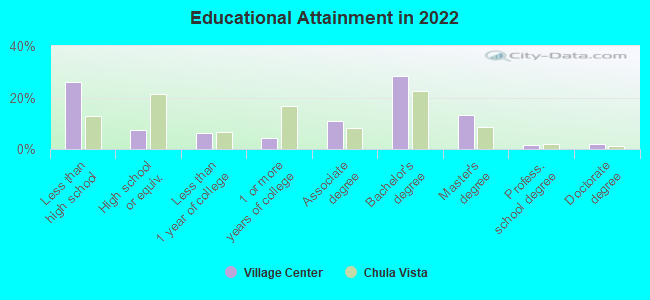
Education in this neighborhood (subdivision or community):
- Percentage of people 3 years and older in K-12 schools:
Village Center: 22.2% Chula Vista: 22.0%
- Percentage of people 3 years and older in undergraduate colleges:
Village Center: 5.6% Chula Vista: 7.6%
- Percentage of people 3 years and older in grad. or professional schools:
Village Center: 3.6% Chula Vista: 1.2%
- Percentage of students K-12 enrolled in private schools:
Village Center: 2.9% Chula Vista: 7.0%
Percentage of population below poverty level:
| Village Center: | 10.0% |
| Chula Vista: | 10.1% |
Median year owner moved in (as recorded in 2022):
| Village Center: | 2008 |
| Chula Vista: | 2011 |
Percentage of married-couple families with both working:
| Village Center: | 61.0% |
| Chula Vista: | 69.2% |
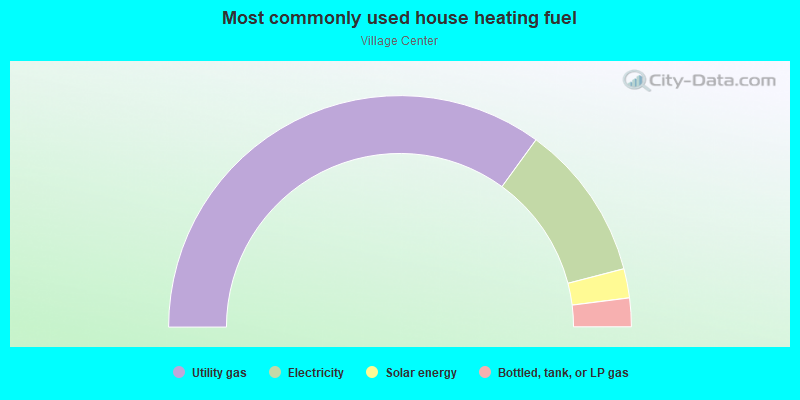
- 70.0%Utility gas
- 21.9%Electricity
- 4.1%Solar energy
- 4.0%Bottled, tank, or LP gas
Roads and streets:
Eastlake Pkwy
Length: 0.31 miles
Directions: N-S, SE-NW
Address range: 800 to 955
Directions: N-S, SE-NW
Address range: 800 to 955
Miller Dr
Length: 0.10 miles
Direction: SW-NE
Direction: SW-NE