Races in Brambleton, Virginia (VA) Detailed Stats
Data:
Races - White alone (%)
Races - White alone (% change since 2000)
Races - Black alone (%)
Races - Black alone (% change since 2000)
Races - American Indian alone (%)
Races - American Indian alone (% change since 2000)
Races - Asian alone (%)
Races - Asian alone (% change since 2000)
Races - Hispanic (%)
Races - Hispanic (% change since 2000)
Races - Native Hawaiian and Other Pacific Islander alone (%)
Races - Native Hawaiian and Other Pacific Islander alone (% change since 2000)
Races - Two or more races(%)
Races - Two or more races(% change since 2000)
Races - Other race alone (%)
Races - Other race alone (% change since 2000)
Racial diversity
Place of birth - Born in state of residence (%)
Place of birth - Born in state of residence (%) - White
Place of birth - Born in state of residence (%) - Black or African American
Place of birth - Born in state of residence (%) - Asian
Place of birth - Born in state of residence (%) - Hispanic or Latino
Place of birth - Born in state of residence (%) - American Indian and Alaska Native
Place of birth - Born in state of residence (%) - Multirace
Place of birth - Born in state of residence (%) - Other Race
Place of birth - Born in other state (%)
Place of birth - Born in other state (%) - White
Place of birth - Born in other state (%) - Black or African American
Place of birth - Born in other state (%) - Asian
Place of birth - Born in other state (%) - Hispanic or Latino
Place of birth - Born in other state (%) - American Indian and Alaska Native
Place of birth - Born in other state (%) - Multirace
Place of birth - Born in other state (%) - Other Race
Place of birth - Native, outside of US (%)
Place of birth - Native, outside of US (%) - White
Place of birth - Native, outside of US (%) - Black or African American
Place of birth - Native, outside of US (%) - Asian
Place of birth - Native, outside of US (%) - Hispanic or Latino
Place of birth - Native, outside of US (%) - American Indian and Alaska Native
Place of birth - Native, outside of US (%) - Multirace
Place of birth - Native, outside of US (%) - Other Race
Place of birth - Foreign born (%)
Place of birth - Foreign born (%) - White
Place of birth - Foreign born (%) - Black or African American
Place of birth - Foreign born (%) - Asian
Place of birth - Foreign born (%) - Hispanic or Latino
Place of birth - Foreign born (%) - American Indian and Alaska Native
Place of birth - Foreign born (%) - Multirace
Place of birth - Foreign born (%) - Other Race
Residents speaking English at home (%)
Residents speaking English at home - Born in the United States (%)
Residents speaking English at home - Native, born elsewhere (%)
Residents speaking English at home - Foreign born (%)
Residents speaking Spanish at home (%)
Residents speaking Spanish at home - Born in the United States (%)
Residents speaking Spanish at home - Native, born elsewhere (%)
Residents speaking Spanish at home - Foreign born (%)
Residents speaking other language at home (%)
Residents speaking other language at home - Born in the United States (%)
Residents speaking other language at home - Native, born elsewhere (%)
Residents speaking other language at home - Foreign born (%)
Marital status - Never married (%)
Marital status - Now married (%)
Marital status - Separated (%)
Marital status - Widowed (%)
Marital status - Divorced (%)
Ancestries Reported - Arab (%)
Ancestries Reported - Czech (%)
Ancestries Reported - Danish (%)
Ancestries Reported - Dutch (%)
Ancestries Reported - English (%)
Ancestries Reported - French (%)
Ancestries Reported - French Canadian (%)
Ancestries Reported - German (%)
Ancestries Reported - Greek (%)
Ancestries Reported - Hungarian (%)
Ancestries Reported - Irish (%)
Ancestries Reported - Italian (%)
Ancestries Reported - Lithuanian (%)
Ancestries Reported - Norwegian (%)
Ancestries Reported - Polish (%)
Ancestries Reported - Portuguese (%)
Ancestries Reported - Russian (%)
Ancestries Reported - Scotch-Irish (%)
Ancestries Reported - Scottish (%)
Ancestries Reported - Slovak (%)
Ancestries Reported - Subsaharan African (%)
Ancestries Reported - Swedish (%)
Ancestries Reported - Swiss (%)
Ancestries Reported - Ukrainian (%)
Ancestries Reported - United States (%)
Ancestries Reported - Welsh (%)
Ancestries Reported - West Indian (%)
Ancestries Reported - Other (%)
Geographical mobility - Same house 1 year ago (%)
Geographical mobility - Same house 1 year ago (%) - White
Geographical mobility - Same house 1 year ago (%) - Black or African American
Geographical mobility - Same house 1 year ago (%) - Asian
Geographical mobility - Same house 1 year ago (%) - Hispanic or Latino
Geographical mobility - Same house 1 year ago (%) - American Indian and Alaska Native
Geographical mobility - Same house 1 year ago (%) - Multirace
Geographical mobility - Same house 1 year ago (%) - Other Race
Geographical mobility - Moved within same county (%)
Geographical mobility - Moved within same county (%) - White
Geographical mobility - Moved within same county (%) - Black or African American
Geographical mobility - Moved within same county (%) - Asian
Geographical mobility - Moved within same county (%) - Hispanic or Latino
Geographical mobility - Moved within same county (%) - American Indian and Alaska Native
Geographical mobility - Moved within same county (%) - Multirace
Geographical mobility - Moved within same county (%) - Other Race
Geographical mobility - Moved from different county within same state (%)
Geographical mobility - Moved from different county within same state (%) - White
Geographical mobility - Moved from different county within same state (%) - Black or African American
Geographical mobility - Moved from different county within same state (%) - Asian
Geographical mobility - Moved from different county within same state (%) - Hispanic or Latino
Geographical mobility - Moved from different county within same state (%) - American Indian and Alaska Native
Geographical mobility - Moved from different county within same state (%) - Multirace
Geographical mobility - Moved from different county within same state (%) - Other Race
Geographical mobility - Moved from different state (%)
Geographical mobility - Moved from different state (%) - White
Geographical mobility - Moved from different state (%) - Black or African American
Geographical mobility - Moved from different state (%) - Asian
Geographical mobility - Moved from different state (%) - Hispanic or Latino
Geographical mobility - Moved from different state (%) - American Indian and Alaska Native
Geographical mobility - Moved from different state (%) - Multirace
Geographical mobility - Moved from different state (%) - Other Race
Geographical mobility - Moved from abroad (%)
Geographical mobility - Moved from abroad (%) - White
Geographical mobility - Moved from abroad (%) - Black or African American
Geographical mobility - Moved from abroad (%) - Asian
Geographical mobility - Moved from abroad (%) - Hispanic or Latino
Geographical mobility - Moved from abroad (%) - American Indian and Alaska Native
Geographical mobility - Moved from abroad (%) - Multirace
Geographical mobility - Moved from abroad (%) - Other Race
Place of birth for the foreign-born population - Ireland (%)
Place of birth for the foreign-born population - Denmark (%)
Place of birth for the foreign-born population - Norway (%)
Place of birth for the foreign-born population - Sweden (%)
Place of birth for the foreign-born population - United Kingdom (%)
Place of birth for the foreign-born population - England (%)
Place of birth for the foreign-born population - Scotland (%)
Place of birth for the foreign-born population - Other Northern Europe (%)
Place of birth for the foreign-born population - Austria (%)
Place of birth for the foreign-born population - Belgium (%)
Place of birth for the foreign-born population - France (%)
Place of birth for the foreign-born population - Germany (%)
Place of birth for the foreign-born population - Netherlands (%)
Place of birth for the foreign-born population - Switzerland (%)
Place of birth for the foreign-born population - Other Western Europe (%)
Place of birth for the foreign-born population - Greece (%)
Place of birth for the foreign-born population - Italy (%)
Place of birth for the foreign-born population - Portugal (%)
Place of birth for the foreign-born population - Spain (%)
Place of birth for the foreign-born population - Other Southern Europe (%)
Place of birth for the foreign-born population - Albania (%)
Place of birth for the foreign-born population - Belarus (%)
Place of birth for the foreign-born population - Bosnia and Herzegovina (%)
Place of birth for the foreign-born population - Bulgaria (%)
Place of birth for the foreign-born population - Croatia (%)
Place of birth for the foreign-born population - Czechoslovakia (%)
Place of birth for the foreign-born population - Hungary (%)
Place of birth for the foreign-born population - Latvia (%)
Place of birth for the foreign-born population - Lithuania (%)
Place of birth for the foreign-born population - North Macedonia (Macedonia) (%)
Place of birth for the foreign-born population - Moldova (%)
Place of birth for the foreign-born population - Poland (%)
Place of birth for the foreign-born population - Romania (%)
Place of birth for the foreign-born population - Russia (%)
Place of birth for the foreign-born population - Serbia (%)
Place of birth for the foreign-born population - Ukraine (%)
Place of birth for the foreign-born population - Other Eastern Europe (%)
Place of birth for the foreign-born population - China (%)
Place of birth for the foreign-born population - Hong Kong (%)
Place of birth for the foreign-born population - Taiwan (%)
Place of birth for the foreign-born population - Japan (%)
Place of birth for the foreign-born population - Korea (%)
Place of birth for the foreign-born population - Other Eastern Asia (%)
Place of birth for the foreign-born population - Afghanistan (%)
Place of birth for the foreign-born population - Bangladesh (%)
Place of birth for the foreign-born population - India (%)
Place of birth for the foreign-born population - Iran (%)
Place of birth for the foreign-born population - Kazakhstan (%)
Place of birth for the foreign-born population - Nepal (%)
Place of birth for the foreign-born population - Pakistan (%)
Place of birth for the foreign-born population - Sri Lanka (%)
Place of birth for the foreign-born population - Uzbekistan (%)
Place of birth for the foreign-born population - Other South Central Asia (%)
Place of birth for the foreign-born population - Burma (%)
Place of birth for the foreign-born population - Cambodia (%)
Place of birth for the foreign-born population - Indonesia (%)
Place of birth for the foreign-born population - Laos (%)
Place of birth for the foreign-born population - Malaysia (%)
Place of birth for the foreign-born population - Philippines (%)
Place of birth for the foreign-born population - Singapore (%)
Place of birth for the foreign-born population - Thailand (%)
Place of birth for the foreign-born population - Vietnam (%)
Place of birth for the foreign-born population - Other South Eastern Asia (%)
Place of birth for the foreign-born population - Armenia (%)
Place of birth for the foreign-born population - Iraq (%)
Place of birth for the foreign-born population - Israel (%)
Place of birth for the foreign-born population - Jordan (%)
Place of birth for the foreign-born population - Kuwait (%)
Place of birth for the foreign-born population - Lebanon (%)
Place of birth for the foreign-born population - Saudi Arabia (%)
Place of birth for the foreign-born population - Syria (%)
Place of birth for the foreign-born population - Turkey (%)
Place of birth for the foreign-born population - Yemen (%)
Place of birth for the foreign-born population - Other Western Asia (%)
Place of birth for the foreign-born population - Eritrea (%)
Place of birth for the foreign-born population - Ethiopia (%)
Place of birth for the foreign-born population - Kenya (%)
Place of birth for the foreign-born population - Somalia (%)
Place of birth for the foreign-born population - Uganda (%)
Place of birth for the foreign-born population - Zimbabwe (%)
Place of birth for the foreign-born population - Other Eastern Africa (%)
Place of birth for the foreign-born population - Cameroon (%)
Place of birth for the foreign-born population - Congo (%)
Place of birth for the foreign-born population - Democratic Republic of Congo (Zaire) (%)
Place of birth for the foreign-born population - Other Middle Africa (%)
Place of birth for the foreign-born population - Egypt (%)
Place of birth for the foreign-born population - Morocco (%)
Place of birth for the foreign-born population - Sudan (%)
Place of birth for the foreign-born population - Other Northern Africa (%)
Place of birth for the foreign-born population - South Africa (%)
Place of birth for the foreign-born population - Other Southern Africa (%)
Place of birth for the foreign-born population - Cabo Verde (%)
Place of birth for the foreign-born population - Ghana (%)
Place of birth for the foreign-born population - Liberia (%)
Place of birth for the foreign-born population - Nigeria (%)
Place of birth for the foreign-born population - Senegal (%)
Place of birth for the foreign-born population - Sierra Leone (%)
Place of birth for the foreign-born population - Other Western Africa (%)
Place of birth for the foreign-born population - Australia (%)
Place of birth for the foreign-born population - New Zealand (%)
Place of birth for the foreign-born population - Fiji (%)
Place of birth for the foreign-born population - Micronesia (%)
Place of birth for the foreign-born population - Bahamas (%)
Place of birth for the foreign-born population - Barbados (%)
Place of birth for the foreign-born population - Cuba (%)
Place of birth for the foreign-born population - Dominica (%)
Place of birth for the foreign-born population - Dominican Republic (%)
Place of birth for the foreign-born population - Grenada (%)
Place of birth for the foreign-born population - Haiti (%)
Place of birth for the foreign-born population - Jamaica (%)
Place of birth for the foreign-born population - St. Vincent and the Grenadines (%)
Place of birth for the foreign-born population - Trinidad and Tobago (%)
Place of birth for the foreign-born population - West Indies (%)
Place of birth for the foreign-born population - Other Caribbean (%)
Place of birth for the foreign-born population - Belize (%)
Place of birth for the foreign-born population - Costa Rica (%)
Place of birth for the foreign-born population - El Salvador (%)
Place of birth for the foreign-born population - Guatemala (%)
Place of birth for the foreign-born population - Honduras (%)
Place of birth for the foreign-born population - Mexico (%)
Place of birth for the foreign-born population - Nicaragua (%)
Place of birth for the foreign-born population - Panama (%)
Place of birth for the foreign-born population - Other Central America (%)
Place of birth for the foreign-born population - Argentina (%)
Place of birth for the foreign-born population - Bolivia (%)
Place of birth for the foreign-born population - Brazil (%)
Place of birth for the foreign-born population - Chile (%)
Place of birth for the foreign-born population - Colombia (%)
Place of birth for the foreign-born population - Ecuador (%)
Place of birth for the foreign-born population - Guyana (%)
Place of birth for the foreign-born population - Peru (%)
Place of birth for the foreign-born population - Uruguay (%)
Place of birth for the foreign-born population - Venezuela (%)
Place of birth for the foreign-born population - Other South America (%)
Place of birth for the foreign-born population - Canada (%)
Place of birth for the foreign-born population - Other Northern America (%)
Place of birth for the foreign-born population - Other (%)
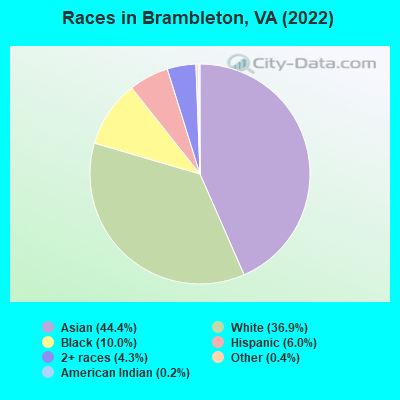
According to 2022 data, the most numerous races in Brambleton, VA are White alone (8,636 residents), Black alone (2,335 residents), and Hispanic (1,414 residents). 54.9% of Brambleton residents speak English at home.
Race distribution in Brambleton 10,386 44.4% Asian alone 8,636 36.9% White alone 2,335 10.0% Black alone 1,414 6.0% Hispanic 1,013 4.3% Two or more races 102 0.4% Other race alone 36 0.2% American Indian alone 13 0.06% Native Hawaiian and Other
2000 2022
4,965,637 70.2% White alone 1,376,378 19.4% Black alone 329,540 4.7% Hispanic 259,277 3.7% Asian alone 114,022 1.6% Two or more races 18,596 0.3% American Indian alone 11,685 0.2% Other race alone 3,380 0.05% Native Hawaiian and Other
5,095,130 58.7% White alone 1,594,785 18.4% Black alone 905,750 10.4% Hispanic 602,881 6.9% Asian alone 406,047 4.7% Two or more races 60,419 0.7% Other race alone 11,738 0.1% American Indian alone 6,869 0.08% Native Hawaiian and Other
Income and house value in Brambleton Median household income in 2022 over $200,000 White non-Hispanic householders$189,392 Black householdersover $200,000 American Indian and Alaska Native householdersover $200,000 Asian householdersover $200,000 Some other race householders$175,514 Two or more races householders$133,851 Hispanic or Latino race householders
Median age by race in Brambleton
40.0 Median age for White residents39.8 39.9 42.1 Median age for Black or African American residents43.0 42.6 40.4 Median age for American Indian / Alaska Native residents58.0 9.6 38.4 Median age for Asian residents38.1 38.4 60.6 Median age for Native Hawaiian / Pacific Islander residents28.3 -714,150,046.8 23.1 Median age for Other race residents25.0 30.5 20.1 Median age for Two or more races residents26.9 18.2 40.8 Median age for White alone residents41.2 40.2 29.2 Median age for Hispanic or Latino residents33.4 29.2
Owner/renter occupied households by race in Brambleton
House owners and renters - White residents 2,607 82.7% Owner occupied546 17.3% Renter occupiedHouse owners and renters - Black or African American residents 350 51.2% Owner occupied333 48.8% Renter occupiedHouse owners and renters - American Indian / Alaska Native residents 23 77.5% Owner occupied7 22.5% Renter occupiedHouse owners and renters - Asian residents 3,038 92.6% Owner occupied244 7.4% Renter occupiedHouse owners and renters - Native Hawaiian / Pacific Islander residents 7 50.5% Owner occupied7 49.5% Renter occupiedHouse owners and renters - Other race residents 37 78.8% Owner occupied10 21.2% Renter occupiedHouse owners and renters - Two or more races residents 276 67.5% Owner occupied133 32.5% Renter occupiedHouse owners and renters - White alone residents 2,618 84.8% Owner occupied470 15.2% Renter occupiedHouse owners and renters - Hispanic or Latino residents 194 56.4% Owner occupied150 43.6% Renter occupied
Language usage in Brambleton
English speakers - Total 54.9% of residents of Brambleton speak English at home.
4.4% of residents speak Spanish at home 743 77.2% Speak English very well220 22.8% Speak English less than very well43.0% of residents speak other language at home 7,180 76.4% Speak English very well2,223 23.6% Speak English less than very well
English speakers - Born in the United States 91.1% of residents of Brambleton speak English at home.
1.5% of residents speak Spanish at home 90 76.3% Speak English very well28 23.7% Speak English less than very well8.0% of residents speak other language at home 597 93.9% Speak English very well39 6.1% Speak English less than very well
English speakers - Native, born elsewhere 42.4% of residents of Brambleton speak English at home.
51.3% of residents speak Spanish at home 249 95.8% Speak English very well11 4.2% Speak English less than very well4.7% of residents speak other language at home 24 100.0% Speak English very well
English speakers - Foreign-born 8.9% of residents of Brambleton speak English at home.
4.8% of residents speak Spanish at home 254 61.7% Speak English very well158 38.3% Speak English less than very well88.8% of residents speak other language at home 5,609 73.1% Speak English very well2,065 26.9% Speak English less than very well
White (Caucasian) - Speak only English Native:
94.5% (7,062)Foreign-born:
19.0% (155)
White (Caucasian) - Speak another language Native:
5.5% (409)Foreign-born:
81.1% (665)
Black or African American - Speak only English Native:
96.1% (1,696)Foreign-born:
5.9% (28)
Black or African American - Speak another language Native:
3.1% (55)Foreign-born:
100.0% (479)
Asian - Speak only English Native:
52.3% (1,634)Foreign-born:
8.5% (582)
Asian - Speak another language Native:
47.5% (1,485)Foreign-born:
91.4% (6,228)
Other race - Speak another language Native:
56.5% (116)Foreign-born:
100.0% (114)
Two or more races - Speak only English Native:
82.8% (840)Foreign-born:
13.7% (54)
Two or more races - Speak another language Native:
12.0% (122)Foreign-born:
86.8% (342)
White alone - Speak only English Native:
96.6% (7,057)Foreign-born:
17.4% (144)
White alone - Speak another language Native:
2.6% (187)Foreign-born:
84.3% (697)
Hispanic or Latino - Speak only English Native:
38.9% (300)Foreign-born:
13.3% (61)
Hispanic or Latino - Speak another language Native:
60.8% (469)Foreign-born:
87.1% (399)
Foreign-born residents in Brambleton
Marital status for residents in Brambleton Marital status - White (Caucasian) population 15 years and over
Males 21.0% Never married68.4% Now married0.3% Separated1.5% Widowed8.8% DivorcedFemales 21.2% Never married70.0% Now married0.2% Separated3.2% Widowed5.4% DivorcedWomen who gave birth in the past 12 months Now married:
100.0% (45)Unmarried:
0.0% (0)
Women who did not give birth in the past 12 months Now married:
68.5% (1,330)Unmarried:
31.5% (613)
Marital status - Black or African American population 15 years and over
Males 34.7% Never married51.0% Now married0.0% Separated2.6% Widowed11.8% DivorcedFemales 12.9% Never married69.2% Now married0.0% Separated0.0% Widowed17.9% DivorcedWomen who gave birth in the past 12 months Now married:
100.0% (54)Unmarried:
0.0% (0)
Women who did not give birth in the past 12 months Now married:
69.3% (265)Unmarried:
30.7% (118)
Marital status - American Indian / Alaska Native population 15 years and over
Males 19.2% Never married80.8% Now married0.0% Separated0.0% Widowed0.0% DivorcedFemales 0.0% Never married0.0% Now married0.0% Separated0.0% Widowed100.0% DivorcedMarital status - Asian population 15 years and over
Males 11.6% Never married86.0% Now married0.0% Separated2.1% Widowed0.3% DivorcedFemales 12.2% Never married84.8% Now married0.0% Separated3.0% Widowed0.0% DivorcedWomen who gave birth in the past 12 months Now married:
100.0% (64)Unmarried:
0.0% (0)
Women who did not give birth in the past 12 months Now married:
85.7% (2,691)Unmarried:
14.3% (449)
Marital status - Other race population 15 years and over
Males 67.8% Never married32.2% Now married0.0% Separated0.0% Widowed0.0% DivorcedFemales 47.2% Never married52.8% Now married0.0% Separated0.0% Widowed0.0% DivorcedWomen who did not give birth in the past 12 months Now married:
51.0% (65)Unmarried:
49.0% (63)
Marital status - Two or more races population 15 years and over
Males 20.9% Never married79.1% Now married0.0% Separated0.0% Widowed0.0% DivorcedFemales 61.1% Never married31.8% Now married0.0% Separated0.0% Widowed7.2% DivorcedWomen who did not give birth in the past 12 months Now married:
26.2% (138)Unmarried:
73.8% (388)
Marital status - White alone, not Hispanic / Latino population 15 years and over
Males 18.9% Never married69.9% Now married0.3% Separated1.6% Widowed9.3% DivorcedFemales 21.3% Never married71.3% Now married0.2% Separated1.6% Widowed5.7% DivorcedWomen who gave birth in the past 12 months Now married:
100.0% (47)Unmarried:
0.0% (0)
Women who did not give birth in the past 12 months Now married:
68.6% (1,346)Unmarried:
31.4% (617)
Marital status - Hispanic or Latino population 15 years and over
Males 38.9% Never married61.1% Now married0.0% Separated0.0% Widowed0.0% DivorcedFemales 49.4% Never married32.7% Now married0.0% Separated11.0% Widowed6.9% DivorcedWomen who did not give birth in the past 12 months Now married:
32.1% (121)Unmarried:
67.9% (256)
Ancestries in Brambleton
648 4.7% Irish613 4.4% American411 3.0% English277 2.0% Egyptian252 1.8% European246 1.8% German231 1.7% Afghan185 1.3% Polish163 1.2% Scottish150 1.1% Haitian120 0.9% Iranian99 0.7% Italian77 0.6% Turkish63 0.5% Armenian54 0.4% New Zealander54 0.4% Scotch-Irish52 0.4% French52 0.4% Ethiopian51 0.4% Sudanese46 0.3% Swedish44 0.3% Greek43 0.3% Nigerian37 0.3% British36 0.3% Lebanese35 0.3% Finnish33 0.2% Norwegian29 0.2% Brazilian25 0.2% Dutch25 0.2% Slovak24 0.2% Czech22 0.2% Scandinavian19 0.1% Russian18 0.1% Lithuanian11 0.08% Croatian10 0.07% Austrian
Geographical mobility in Brambleton Same house 1 year ago 7,568 86.2% White (Caucasian)1,824 78.7% Black or African American21 43.7% American Indian / Alaska Native9,547 91.4% Asian19 95.3% Native Hawaiian / Pacific Islander332 100.0% Other race1,360 76.9% Two or more races7,362 86.1% White alone, not Hispanic / Latino1,241 87.9% Hispanic or LatinoMoved within same county 524 6.0% White / Caucasian416 17.9% Black or African American23 47.1% American Indian / Alaska Native280 2.7% Asian60 3.4% Two or more races486 5.7% White alone, not Hispanic / Latino64 4.5% Hispanic or LatinoMoved within same state 602 6.9% White / Caucasian334 3.2% Asian224 12.7% Two or more races648 7.6% White alone, not Hispanic / Latino98 6.9% Hispanic or LatinoMoved from different state 103 1.2% White / Caucasian225 9.7% Black or African American13 26.6% American Indian / Alaska Native44 0.4% Asian129 7.3% Two or more races94 1.1% White alone, not Hispanic / Latino23 1.6% Hispanic or LatinoMoved from abroad 8 0.1% White84 0.8% Asian9 0.1% White alone, not Hispanic / Latino
Children Nativity (place of birth) in Brambleton
Children under 6 years - Living with two parents Both parents native 443 100.0% NativeBoth parents foreign-born 698 100.0% NativeOne native, one foreign-born parent 584 100.0% NativeChildren under 6 years - Living with one parent Native parent 148 100.0% NativeForeign-born parent 144 100.0% NativeChildren 6 to 17 years - Living with two parents Both parents native 1,945 100.0% NativeBoth parents foreign-born 1,972 86.5% Native308 13.5% Foreign-bornOne native, one foreign-born parent 396 91.3% Native38 8.7% Foreign-bornChildren 6 to 17 years - Living with one parent Native parent 284 100.0% NativeForeign-born parent 297 48.3% Native317 51.7% Foreign-born