Races in Camas, Washington (WA) Detailed Stats
Data:
Races - White alone (%)
Races - White alone (% change since 2000)
Races - Black alone (%)
Races - Black alone (% change since 2000)
Races - American Indian alone (%)
Races - American Indian alone (% change since 2000)
Races - Asian alone (%)
Races - Asian alone (% change since 2000)
Races - Hispanic (%)
Races - Hispanic (% change since 2000)
Races - Native Hawaiian and Other Pacific Islander alone (%)
Races - Native Hawaiian and Other Pacific Islander alone (% change since 2000)
Races - Two or more races(%)
Races - Two or more races(% change since 2000)
Races - Other race alone (%)
Races - Other race alone (% change since 2000)
Racial diversity
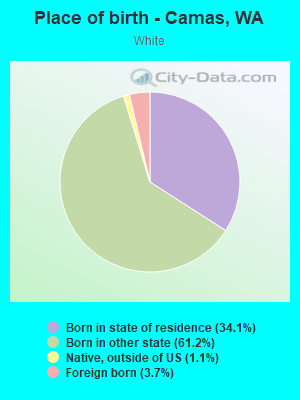
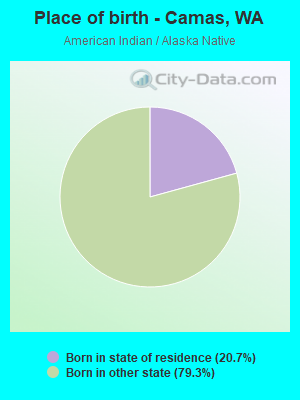
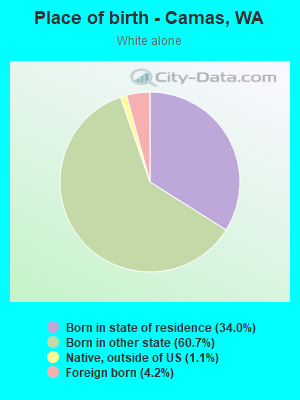
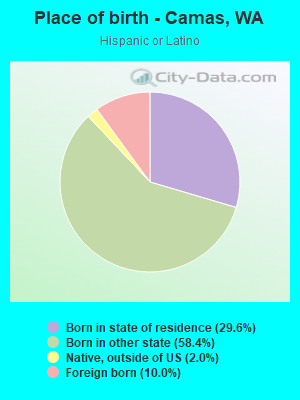
Place of birth - Born in state of residence (%)
Place of birth - Born in state of residence (%) - White
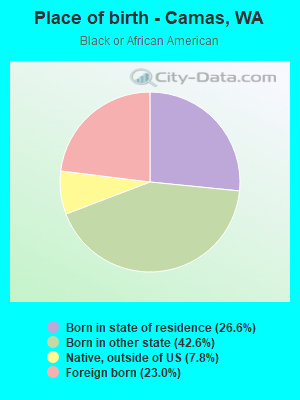
Place of birth - Born in state of residence (%) - Black or African American
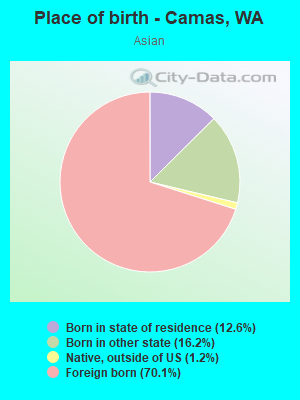
Place of birth - Born in state of residence (%) - Asian
Place of birth - Born in state of residence (%) - Hispanic or Latino
Place of birth - Born in state of residence (%) - American Indian and Alaska Native
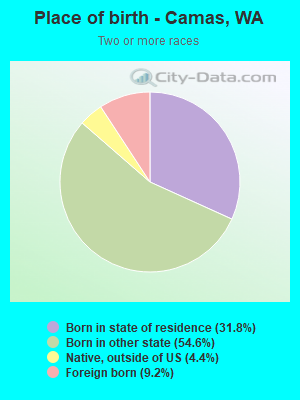
Place of birth - Born in state of residence (%) - Multirace
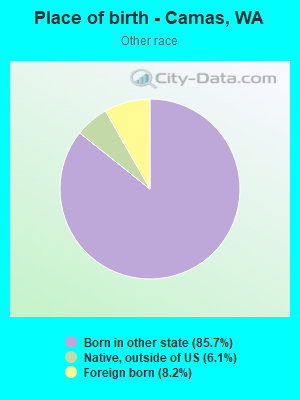
Place of birth - Born in state of residence (%) - Other Race
Place of birth - Born in other state (%)
Place of birth - Born in other state (%) - White
Place of birth - Born in other state (%) - Black or African American
Place of birth - Born in other state (%) - Asian
Place of birth - Born in other state (%) - Hispanic or Latino
Place of birth - Born in other state (%) - American Indian and Alaska Native
Place of birth - Born in other state (%) - Multirace
Place of birth - Born in other state (%) - Other Race
Place of birth - Native, outside of US (%)
Place of birth - Native, outside of US (%) - White
Place of birth - Native, outside of US (%) - Black or African American
Place of birth - Native, outside of US (%) - Asian
Place of birth - Native, outside of US (%) - Hispanic or Latino
Place of birth - Native, outside of US (%) - American Indian and Alaska Native
Place of birth - Native, outside of US (%) - Multirace
Place of birth - Native, outside of US (%) - Other Race
Place of birth - Foreign born (%)
Place of birth - Foreign born (%) - White
Place of birth - Foreign born (%) - Black or African American
Place of birth - Foreign born (%) - Asian
Place of birth - Foreign born (%) - Hispanic or Latino
Place of birth - Foreign born (%) - American Indian and Alaska Native
Place of birth - Foreign born (%) - Multirace
Place of birth - Foreign born (%) - Other Race
Residents speaking English at home (%)
Residents speaking English at home - Born in the United States (%)
Residents speaking English at home - Native, born elsewhere (%)
Residents speaking English at home - Foreign born (%)
Residents speaking Spanish at home (%)
Residents speaking Spanish at home - Born in the United States (%)
Residents speaking Spanish at home - Native, born elsewhere (%)
Residents speaking Spanish at home - Foreign born (%)
Residents speaking other language at home (%)
Residents speaking other language at home - Born in the United States (%)
Residents speaking other language at home - Native, born elsewhere (%)
Residents speaking other language at home - Foreign born (%)
Marital status - Never married (%)
Marital status - Now married (%)
Marital status - Separated (%)
Marital status - Widowed (%)
Marital status - Divorced (%)
Ancestries Reported - Arab (%)
Ancestries Reported - Czech (%)
Ancestries Reported - Danish (%)
Ancestries Reported - Dutch (%)
Ancestries Reported - English (%)
Ancestries Reported - French (%)
Ancestries Reported - French Canadian (%)
Ancestries Reported - German (%)
Ancestries Reported - Greek (%)
Ancestries Reported - Hungarian (%)
Ancestries Reported - Irish (%)
Ancestries Reported - Italian (%)
Ancestries Reported - Lithuanian (%)
Ancestries Reported - Norwegian (%)
Ancestries Reported - Polish (%)
Ancestries Reported - Portuguese (%)
Ancestries Reported - Russian (%)
Ancestries Reported - Scotch-Irish (%)
Ancestries Reported - Scottish (%)
Ancestries Reported - Slovak (%)
Ancestries Reported - Subsaharan African (%)
Ancestries Reported - Swedish (%)
Ancestries Reported - Swiss (%)
Ancestries Reported - Ukrainian (%)
Ancestries Reported - United States (%)
Ancestries Reported - Welsh (%)
Ancestries Reported - West Indian (%)
Ancestries Reported - Other (%)
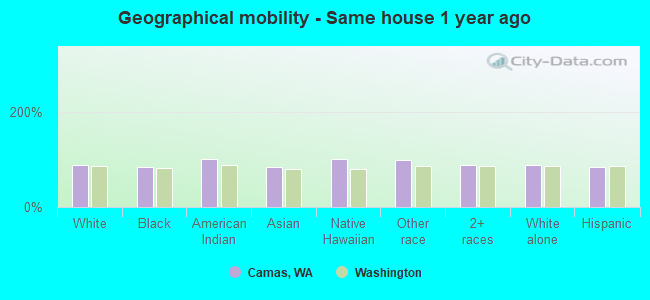
Geographical mobility - Same house 1 year ago (%)
Geographical mobility - Same house 1 year ago (%) - White
Geographical mobility - Same house 1 year ago (%) - Black or African American
Geographical mobility - Same house 1 year ago (%) - Asian
Geographical mobility - Same house 1 year ago (%) - Hispanic or Latino
Geographical mobility - Same house 1 year ago (%) - American Indian and Alaska Native
Geographical mobility - Same house 1 year ago (%) - Multirace
Geographical mobility - Same house 1 year ago (%) - Other Race
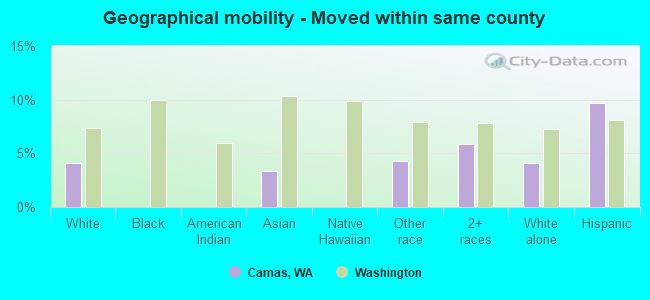
Geographical mobility - Moved within same county (%)
Geographical mobility - Moved within same county (%) - White
Geographical mobility - Moved within same county (%) - Black or African American
Geographical mobility - Moved within same county (%) - Asian
Geographical mobility - Moved within same county (%) - Hispanic or Latino
Geographical mobility - Moved within same county (%) - American Indian and Alaska Native
Geographical mobility - Moved within same county (%) - Multirace
Geographical mobility - Moved within same county (%) - Other Race
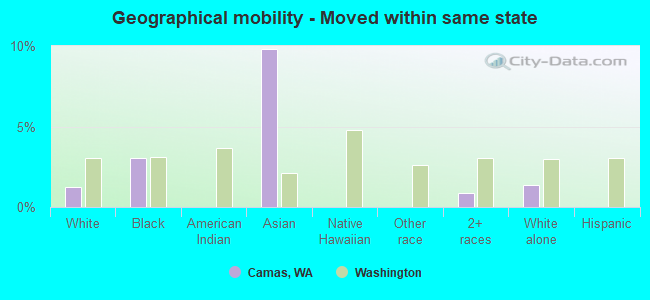
Geographical mobility - Moved from different county within same state (%)
Geographical mobility - Moved from different county within same state (%) - White
Geographical mobility - Moved from different county within same state (%) - Black or African American
Geographical mobility - Moved from different county within same state (%) - Asian
Geographical mobility - Moved from different county within same state (%) - Hispanic or Latino
Geographical mobility - Moved from different county within same state (%) - American Indian and Alaska Native
Geographical mobility - Moved from different county within same state (%) - Multirace
Geographical mobility - Moved from different county within same state (%) - Other Race
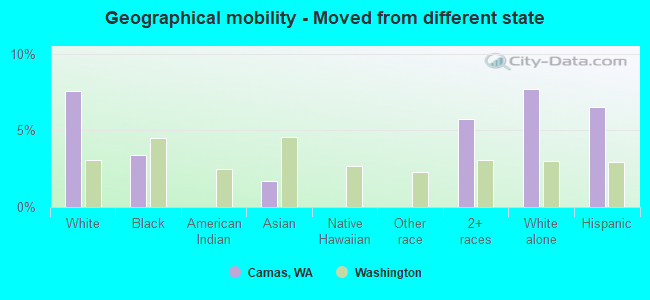
Geographical mobility - Moved from different state (%)
Geographical mobility - Moved from different state (%) - White
Geographical mobility - Moved from different state (%) - Black or African American
Geographical mobility - Moved from different state (%) - Asian
Geographical mobility - Moved from different state (%) - Hispanic or Latino
Geographical mobility - Moved from different state (%) - American Indian and Alaska Native
Geographical mobility - Moved from different state (%) - Multirace
Geographical mobility - Moved from different state (%) - Other Race
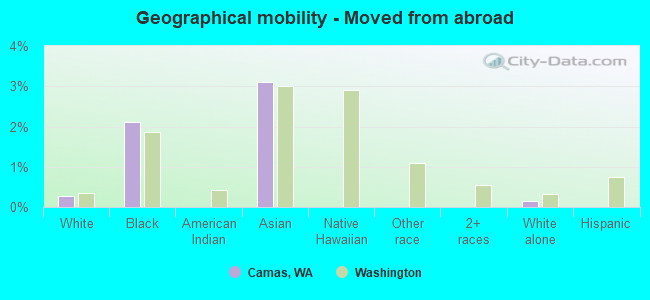
Geographical mobility - Moved from abroad (%)
Geographical mobility - Moved from abroad (%) - White
Geographical mobility - Moved from abroad (%) - Black or African American
Geographical mobility - Moved from abroad (%) - Asian
Geographical mobility - Moved from abroad (%) - Hispanic or Latino
Geographical mobility - Moved from abroad (%) - American Indian and Alaska Native
Geographical mobility - Moved from abroad (%) - Multirace
Geographical mobility - Moved from abroad (%) - Other Race
Place of birth for the foreign-born population - Ireland (%)
Place of birth for the foreign-born population - Denmark (%)
Place of birth for the foreign-born population - Norway (%)
Place of birth for the foreign-born population - Sweden (%)
Place of birth for the foreign-born population - United Kingdom (%)
Place of birth for the foreign-born population - England (%)
Place of birth for the foreign-born population - Scotland (%)
Place of birth for the foreign-born population - Other Northern Europe (%)
Place of birth for the foreign-born population - Austria (%)
Place of birth for the foreign-born population - Belgium (%)
Place of birth for the foreign-born population - France (%)
Place of birth for the foreign-born population - Germany (%)
Place of birth for the foreign-born population - Netherlands (%)
Place of birth for the foreign-born population - Switzerland (%)
Place of birth for the foreign-born population - Other Western Europe (%)
Place of birth for the foreign-born population - Greece (%)
Place of birth for the foreign-born population - Italy (%)
Place of birth for the foreign-born population - Portugal (%)
Place of birth for the foreign-born population - Spain (%)
Place of birth for the foreign-born population - Other Southern Europe (%)
Place of birth for the foreign-born population - Albania (%)
Place of birth for the foreign-born population - Belarus (%)
Place of birth for the foreign-born population - Bosnia and Herzegovina (%)
Place of birth for the foreign-born population - Bulgaria (%)
Place of birth for the foreign-born population - Croatia (%)
Place of birth for the foreign-born population - Czechoslovakia (%)
Place of birth for the foreign-born population - Hungary (%)
Place of birth for the foreign-born population - Latvia (%)
Place of birth for the foreign-born population - Lithuania (%)
Place of birth for the foreign-born population - North Macedonia (Macedonia) (%)
Place of birth for the foreign-born population - Moldova (%)
Place of birth for the foreign-born population - Poland (%)
Place of birth for the foreign-born population - Romania (%)
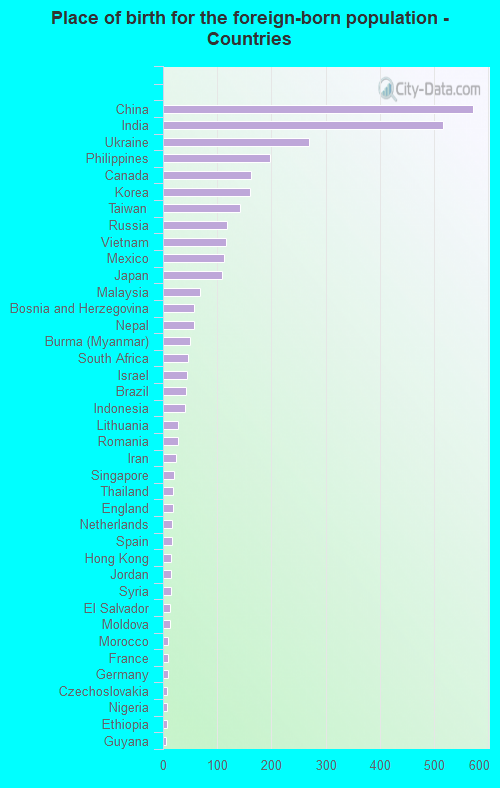
Place of birth for the foreign-born population - Russia (%)
Place of birth for the foreign-born population - Serbia (%)
Place of birth for the foreign-born population - Ukraine (%)
Place of birth for the foreign-born population - Other Eastern Europe (%)
Place of birth for the foreign-born population - China (%)
Place of birth for the foreign-born population - Hong Kong (%)
Place of birth for the foreign-born population - Taiwan (%)
Place of birth for the foreign-born population - Japan (%)
Place of birth for the foreign-born population - Korea (%)
Place of birth for the foreign-born population - Other Eastern Asia (%)
Place of birth for the foreign-born population - Afghanistan (%)
Place of birth for the foreign-born population - Bangladesh (%)
Place of birth for the foreign-born population - India (%)
Place of birth for the foreign-born population - Iran (%)
Place of birth for the foreign-born population - Kazakhstan (%)
Place of birth for the foreign-born population - Nepal (%)
Place of birth for the foreign-born population - Pakistan (%)
Place of birth for the foreign-born population - Sri Lanka (%)
Place of birth for the foreign-born population - Uzbekistan (%)
Place of birth for the foreign-born population - Other South Central Asia (%)
Place of birth for the foreign-born population - Burma (%)
Place of birth for the foreign-born population - Cambodia (%)
Place of birth for the foreign-born population - Indonesia (%)
Place of birth for the foreign-born population - Laos (%)
Place of birth for the foreign-born population - Malaysia (%)
Place of birth for the foreign-born population - Philippines (%)
Place of birth for the foreign-born population - Singapore (%)
Place of birth for the foreign-born population - Thailand (%)
Place of birth for the foreign-born population - Vietnam (%)
Place of birth for the foreign-born population - Other South Eastern Asia (%)
Place of birth for the foreign-born population - Armenia (%)
Place of birth for the foreign-born population - Iraq (%)
Place of birth for the foreign-born population - Israel (%)
Place of birth for the foreign-born population - Jordan (%)
Place of birth for the foreign-born population - Kuwait (%)
Place of birth for the foreign-born population - Lebanon (%)
Place of birth for the foreign-born population - Saudi Arabia (%)
Place of birth for the foreign-born population - Syria (%)
Place of birth for the foreign-born population - Turkey (%)
Place of birth for the foreign-born population - Yemen (%)
Place of birth for the foreign-born population - Other Western Asia (%)
Place of birth for the foreign-born population - Eritrea (%)
Place of birth for the foreign-born population - Ethiopia (%)
Place of birth for the foreign-born population - Kenya (%)
Place of birth for the foreign-born population - Somalia (%)
Place of birth for the foreign-born population - Uganda (%)
Place of birth for the foreign-born population - Zimbabwe (%)
Place of birth for the foreign-born population - Other Eastern Africa (%)
Place of birth for the foreign-born population - Cameroon (%)
Place of birth for the foreign-born population - Congo (%)
Place of birth for the foreign-born population - Democratic Republic of Congo (Zaire) (%)
Place of birth for the foreign-born population - Other Middle Africa (%)
Place of birth for the foreign-born population - Egypt (%)
Place of birth for the foreign-born population - Morocco (%)
Place of birth for the foreign-born population - Sudan (%)
Place of birth for the foreign-born population - Other Northern Africa (%)
Place of birth for the foreign-born population - South Africa (%)
Place of birth for the foreign-born population - Other Southern Africa (%)
Place of birth for the foreign-born population - Cabo Verde (%)
Place of birth for the foreign-born population - Ghana (%)
Place of birth for the foreign-born population - Liberia (%)
Place of birth for the foreign-born population - Nigeria (%)
Place of birth for the foreign-born population - Senegal (%)
Place of birth for the foreign-born population - Sierra Leone (%)
Place of birth for the foreign-born population - Other Western Africa (%)
Place of birth for the foreign-born population - Australia (%)
Place of birth for the foreign-born population - New Zealand (%)
Place of birth for the foreign-born population - Fiji (%)
Place of birth for the foreign-born population - Micronesia (%)
Place of birth for the foreign-born population - Bahamas (%)
Place of birth for the foreign-born population - Barbados (%)
Place of birth for the foreign-born population - Cuba (%)
Place of birth for the foreign-born population - Dominica (%)
Place of birth for the foreign-born population - Dominican Republic (%)
Place of birth for the foreign-born population - Grenada (%)
Place of birth for the foreign-born population - Haiti (%)
Place of birth for the foreign-born population - Jamaica (%)
Place of birth for the foreign-born population - St. Vincent and the Grenadines (%)
Place of birth for the foreign-born population - Trinidad and Tobago (%)
Place of birth for the foreign-born population - West Indies (%)
Place of birth for the foreign-born population - Other Caribbean (%)
Place of birth for the foreign-born population - Belize (%)
Place of birth for the foreign-born population - Costa Rica (%)
Place of birth for the foreign-born population - El Salvador (%)
Place of birth for the foreign-born population - Guatemala (%)
Place of birth for the foreign-born population - Honduras (%)
Place of birth for the foreign-born population - Mexico (%)
Place of birth for the foreign-born population - Nicaragua (%)
Place of birth for the foreign-born population - Panama (%)
Place of birth for the foreign-born population - Other Central America (%)
Place of birth for the foreign-born population - Argentina (%)
Place of birth for the foreign-born population - Bolivia (%)
Place of birth for the foreign-born population - Brazil (%)
Place of birth for the foreign-born population - Chile (%)
Place of birth for the foreign-born population - Colombia (%)
Place of birth for the foreign-born population - Ecuador (%)
Place of birth for the foreign-born population - Guyana (%)
Place of birth for the foreign-born population - Peru (%)
Place of birth for the foreign-born population - Uruguay (%)
Place of birth for the foreign-born population - Venezuela (%)
Place of birth for the foreign-born population - Other South America (%)
Place of birth for the foreign-born population - Canada (%)
Place of birth for the foreign-born population - Other Northern America (%)
Place of birth for the foreign-born population - Other (%)
Latest news about races in Camas, WA collected exclusively by city-data.com from local newspapers, TV, and radio stations
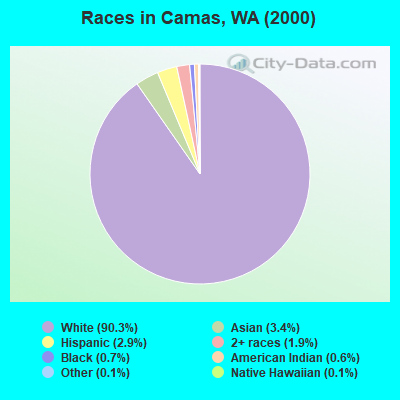
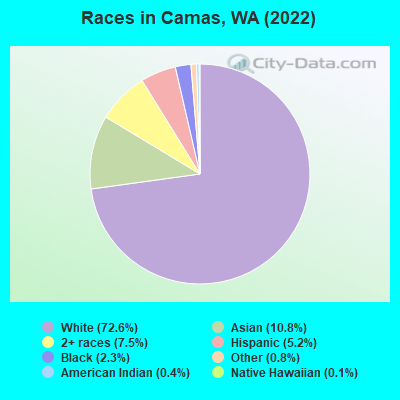
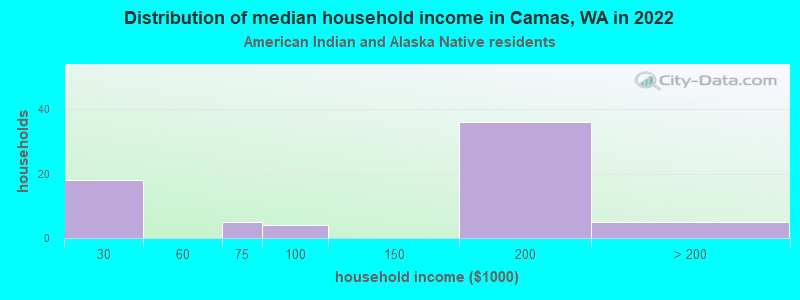
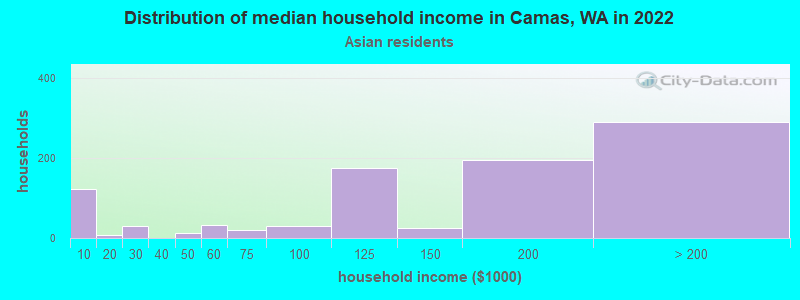
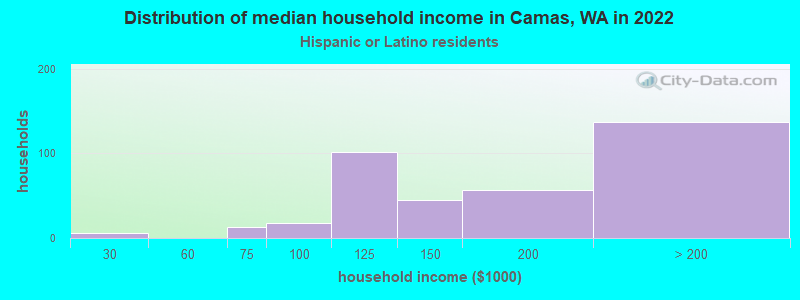
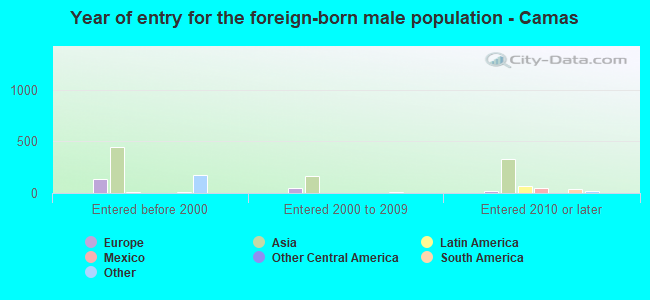
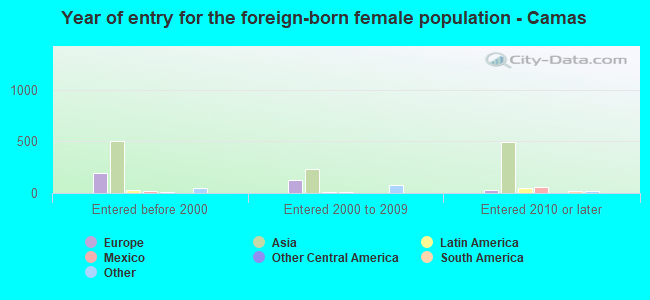
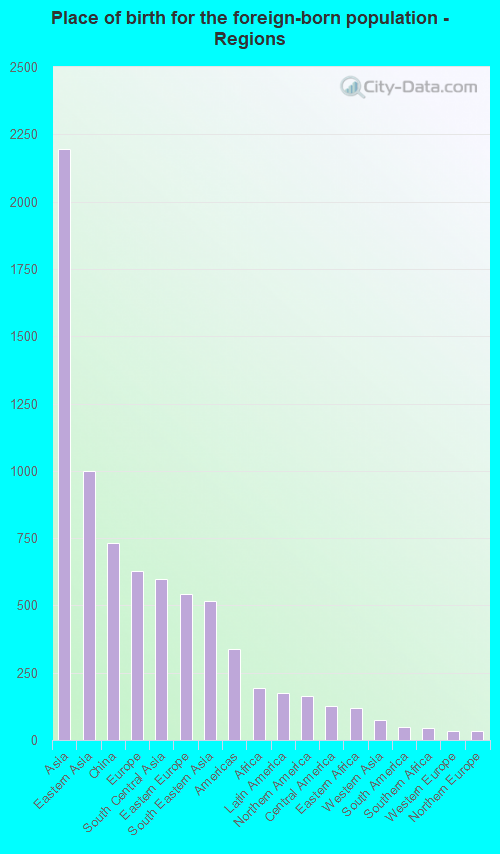
According to 2022 data, the most numerous races in Camas, WA are White alone (19,648 residents), Hispanic (1,418 residents), and Asian alone (2,925 residents). 86.2% of Camas residents speak English at home. 12.4% of Camas, WA residents are foreign-born (8.0% born in Asia, 2.3% born in Europe), which is 21.1% less than the foreign-born rate of 15.0% across the entire state of Washington.
Race distribution in Camas
2000 2022
4,652,490 78.9% White alone 441,509 7.5% Hispanic 319,401 5.4% Asian alone 184,631 3.1% Black alone 175,926 3.0% Two or more races 85,396 1.4% American Indian alone 22,779 0.4% Native Hawaiian and Other 11,989 0.2% Other race alone
4,941,456 63.5% White alone 1,093,313 14.0% Hispanic 755,832 9.7% Asian alone 523,448 6.7% Two or more races 299,537 3.8% Black alone 69,024 0.9% American Indian alone 52,231 0.7% Native Hawaiian and Other 50,945 0.7% Other race alone
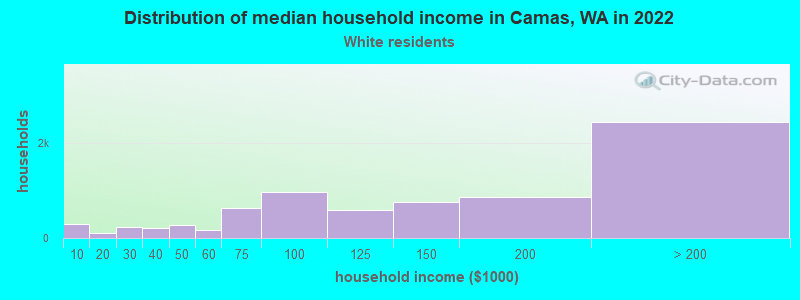
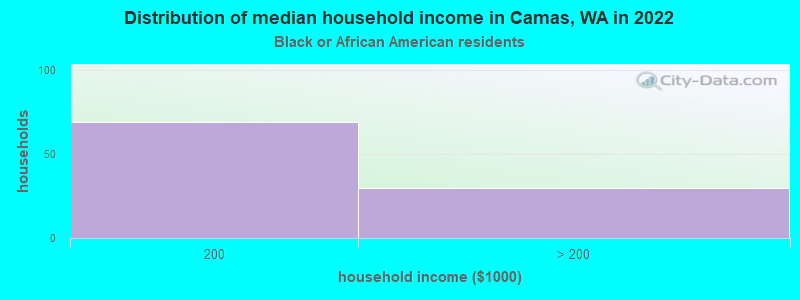
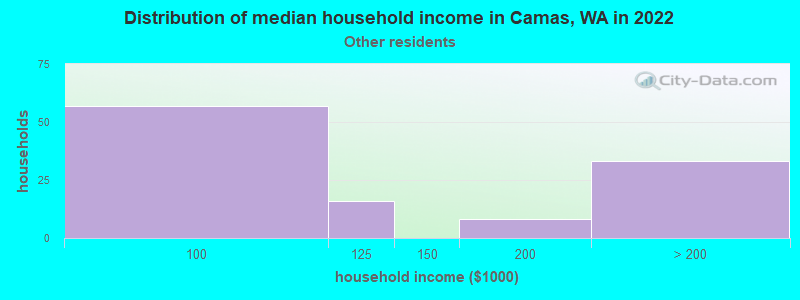
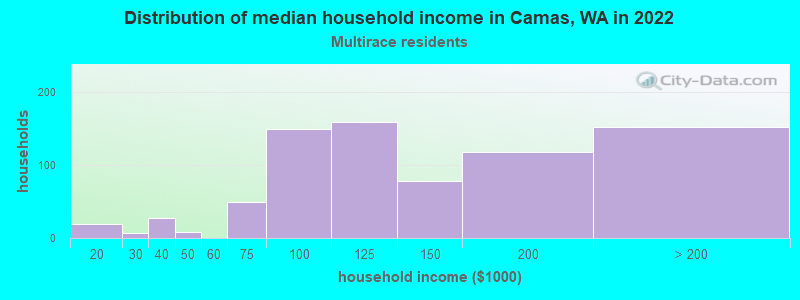
Income and house value in Camas Median household income in 2022 $129,919 White non-Hispanic householders$170,373 Black householders$160,815 American Indian and Alaska Native householders$170,899 Asian householders$136,069 Two or more races householders$185,959 Hispanic or Latino race householdersMedian 2022 house value $705,037 White Non-Hispanic householdersover $1,000,000 Black or African American householders$967,894 American Indian or Alaska Native householders over $1,000,000 Asian householders$835,352 Native Hawaiian and other Pacific Islander householdersover $1,000,000 Some other race householders$553,560 Two or more races householdersover $1,000,000 Hispanic or Latino householders
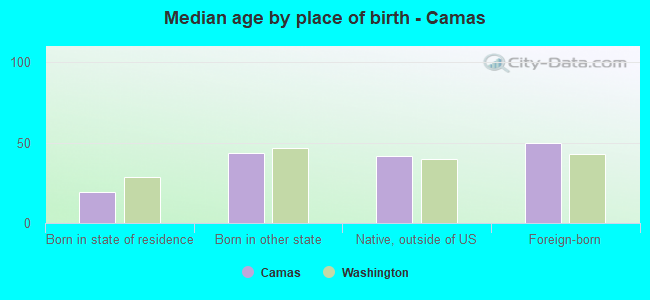
Median age by race in Camas
42.6 Median age for White residents43.0 42.7 37.0 Median age for Black or African American residents31.9 39.2 28.2 Median age for American Indian / Alaska Native residents6.0 37.1 41.2 Median age for Asian residents41.3 41.5 -779,279,278.5 Median age for Native Hawaiian / Pacific Islander residents-779,310,344.0 -928,017,717.8 67.0 Median age for Other race residents83.9 66.4 19.2 Median age for Two or more races residents18.3 20.2 42.4 Median age for White alone residents42.4 42.6 21.6 Median age for Hispanic or Latino residents22.9 21.2
Owner/renter occupied households by race in Camas
House owners and renters - White residents 6,051 81.2% Owner occupied1,404 18.8% Renter occupiedHouse owners and renters - Black or African American residents 58 84.6% Owner occupied11 15.4% Renter occupiedHouse owners and renters - American Indian / Alaska Native residents 43 60.9% Owner occupied28 39.1% Renter occupiedHouse owners and renters - Asian residents 690 82.3% Owner occupied148 17.7% Renter occupiedHouse owners and renters - Native Hawaiian / Pacific Islander residents 18 100.0% Renter occupiedHouse owners and renters - Other race residents 125 100.0% Owner occupiedHouse owners and renters - Two or more races residents 641 75.6% Owner occupied207 24.4% Renter occupiedHouse owners and renters - White alone residents 6,068 80.6% Owner occupied1,457 19.4% Renter occupiedHouse owners and renters - Hispanic or Latino residents 236 71.6% Owner occupied94 28.4% Renter occupied
Language usage in Camas
English speakers - Total 86.2% of residents of Camas speak English at home.
1.8% of residents speak Spanish at home 403 87.4% Speak English very well58 12.6% Speak English less than very well11.6% of residents speak other language at home 2,231 74.9% Speak English very well748 25.1% Speak English less than very well
English speakers - Born in the United States 93.4% of residents of Camas speak English at home.
1.8% of residents speak Spanish at home 251 95.8% Speak English very well11 4.2% Speak English less than very well4.6% of residents speak other language at home 673 98.7% Speak English very well9 1.3% Speak English less than very well
English speakers - Native, born elsewhere 92.3% of residents of Camas speak English at home.
3.2% of residents speak Spanish at home 15 100.0% Speak English very well6.0% of residents speak other language at home 28 100.0% Speak English very well
English speakers - Foreign-born 30.0% of residents of Camas speak English at home.
4.0% of residents speak Spanish at home 96 76.8% Speak English very well29 23.2% Speak English less than very well64.7% of residents speak other language at home 1,332 66.2% Speak English very well679 33.8% Speak English less than very well
White (Caucasian) - Speak only English Native:
97.2% (17,298)Foreign-born:
34.7% (247)
White (Caucasian) - Speak another language Native:
2.9% (510)Foreign-born:
67.5% (481)
Black or African American - Speak only English Native:
100.0% (388)Foreign-born:
40.5% (64)
Asian - Speak only English Native:
56.9% (425)Foreign-born:
34.6% (708)
Asian - Speak another language Native:
43.6% (326)Foreign-born:
68.5% (1,401)
Other race - Speak only English Native:
100.0% (255)Foreign-born:
24.5% (6)
Other race - Speak another language Native:
6.6% (17)Foreign-born:
58.5% (14)
Two or more races - Speak only English Native:
84.5% (2,640)Foreign-born:
4.6% (16)
Two or more races - Speak another language Native:
12.4% (389)Foreign-born:
92.4% (318)
White alone - Speak only English Native:
96.4% (17,281)Foreign-born:
30.7% (253)
White alone - Speak another language Native:
3.6% (639)Foreign-born:
69.7% (575)
Hispanic or Latino - Speak only English Native:
84.3% (998)Foreign-born:
12.2% (18)
Hispanic or Latino - Speak another language Native:
14.6% (173)Foreign-born:
91.0% (132)
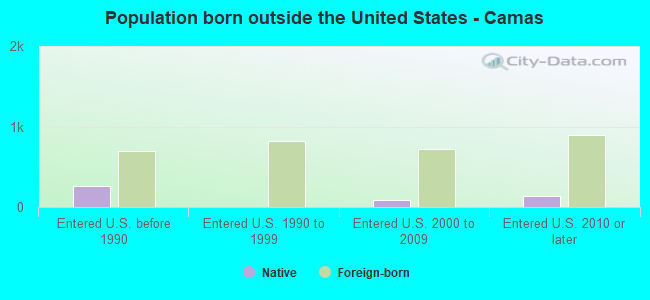
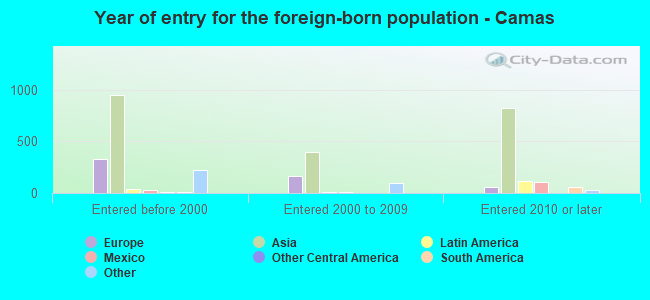
Foreign-born residents in Camas 3,352 residents are foreign born (8.0% Asia , 2.3% Europe ).
This city:
12.4%Washington:
14.9%
Marital status for residents in Camas Marital status - White (Caucasian) population 15 years and over
Males 25.9% Never married65.0% Now married0.8% Separated0.6% Widowed7.8% DivorcedFemales 23.1% Never married62.7% Now married0.0% Separated5.6% Widowed8.7% DivorcedWomen who gave birth in the past 12 months Now married:
97.0% (280)Unmarried:
3.0% (9)
Women who did not give birth in the past 12 months Now married:
55.5% (2,433)Unmarried:
44.5% (1,949)
Marital status - Black or African American population 15 years and over
Males 34.3% Never married28.1% Now married0.0% Separated0.0% Widowed37.6% DivorcedFemales 0.0% Never married39.5% Now married0.0% Separated10.9% Widowed49.6% DivorcedWomen who did not give birth in the past 12 months Now married:
23.4% (18)Unmarried:
76.6% (59)
Marital status - American Indian / Alaska Native population 15 years and over
Males 0.0% Never married35.7% Now married0.0% Separated0.0% Widowed64.3% DivorcedFemales 13.2% Never married60.5% Now married0.0% Separated18.4% Widowed7.9% DivorcedWomen who gave birth in the past 12 months Now married:
100.0% (17)Unmarried:
0.0% (0)
Women who did not give birth in the past 12 months Now married:
45.5% (24)Unmarried:
54.5% (28)
Marital status - Asian population 15 years and over
Males 8.5% Never married82.4% Now married3.9% Separated0.0% Widowed5.2% DivorcedFemales 19.0% Never married71.7% Now married0.0% Separated4.6% Widowed4.7% DivorcedWomen who gave birth in the past 12 months Now married:
100.0% (28)Unmarried:
0.0% (0)
Women who did not give birth in the past 12 months Now married:
67.8% (597)Unmarried:
32.2% (283)
Marital status - Other race population 15 years and over
Males 0.0% Never married92.5% Now married0.0% Separated0.0% Widowed7.5% DivorcedFemales 11.3% Never married80.6% Now married8.1% Separated0.0% Widowed0.0% DivorcedWomen who did not give birth in the past 12 months Now married:
58.8% (21)Unmarried:
41.2% (15)
Marital status - Two or more races population 15 years and over
Males 33.2% Never married60.5% Now married0.0% Separated0.0% Widowed6.2% DivorcedFemales 32.9% Never married58.1% Now married2.1% Separated2.2% Widowed4.7% DivorcedWomen who gave birth in the past 12 months Now married:
100.0% (72)Unmarried:
0.0% (0)
Women who did not give birth in the past 12 months Now married:
44.8% (268)Unmarried:
55.2% (330)
Marital status - White alone, not Hispanic / Latino population 15 years and over
Males 26.0% Never married64.8% Now married0.8% Separated0.6% Widowed7.8% DivorcedFemales 22.9% Never married62.7% Now married0.0% Separated5.6% Widowed8.8% DivorcedWomen who gave birth in the past 12 months Now married:
96.9% (282)Unmarried:
3.1% (9)
Women who did not give birth in the past 12 months Now married:
55.7% (2,492)Unmarried:
44.3% (1,985)
Marital status - Hispanic or Latino population 15 years and over
Males 26.6% Never married65.7% Now married0.0% Separated0.0% Widowed7.7% DivorcedFemales 34.3% Never married59.0% Now married6.6% Separated0.0% Widowed0.0% DivorcedWomen who gave birth in the past 12 months Now married:
100.0% (71)Unmarried:
0.0% (0)
Women who did not give birth in the past 12 months Now married:
45.6% (119)Unmarried:
54.4% (142)
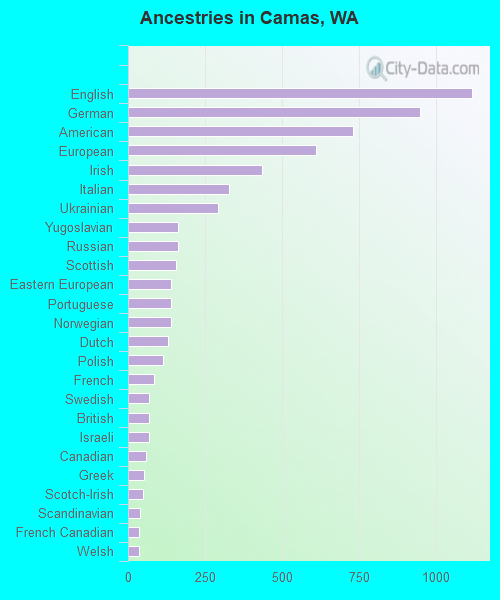
Ancestries in Camas
1,118 10.0% English951 8.5% German731 6.5% American611 5.5% European436 3.9% Irish330 3.0% Italian294 2.6% Ukrainian163 1.5% Yugoslavian162 1.4% Russian157 1.4% Scottish141 1.3% Eastern European140 1.3% Portuguese140 1.3% Norwegian129 1.2% Dutch115 1.0% Polish86 0.8% French69 0.6% Swedish67 0.6% British67 0.6% Israeli60 0.5% Canadian52 0.5% Greek50 0.4% Scotch-Irish39 0.3% Scandinavian37 0.3% French Canadian37 0.3% Welsh31 0.3% Finnish31 0.3% African25 0.2% Slavic24 0.2% Northern European23 0.2% Danish21 0.2% Romanian18 0.2% Lithuanian17 0.2% Czech15 0.1% Ethiopian11 0.10% Croatian11 0.10% Palestinian11 0.10% Iranian9 0.08% Serbian8 0.07% Moroccan4 0.04% Jordanian2 0.02% Bulgarian
Geographical mobility in Camas Same house 1 year ago 16,869 88.2% White (Caucasian)555 83.5% Black or African American219 100.0% American Indian / Alaska Native2,437 84.2% Asian40 100.0% Native Hawaiian / Pacific Islander245 98.5% Other race3,211 88.1% Two or more races17,114 87.9% White alone, not Hispanic / Latino1,115 83.9% Hispanic or LatinoMoved within same county 789 4.1% White / Caucasian96 3.3% Asian11 4.3% Other race212 5.8% Two or more races802 4.1% White alone, not Hispanic / Latino129 9.7% Hispanic or LatinoMoved within same state 243 1.3% White / Caucasian20 3.0% Black or African American284 9.8% Asian32 0.9% Two or more races263 1.3% White alone, not Hispanic / LatinoMoved from different state 1,445 7.6% White / Caucasian23 3.4% Black or African American48 1.7% Asian210 5.8% Two or more races1,492 7.7% White alone, not Hispanic / Latino86 6.5% Hispanic or LatinoMoved from abroad 50 0.3% White14 2.1% Black or African American90 3.1% Asian30 0.2% White alone, not Hispanic / Latino
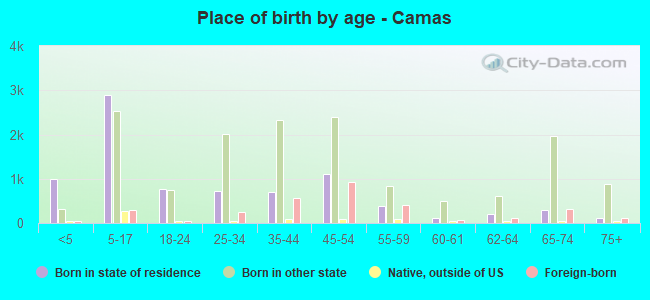
Children Nativity (place of birth) in Camas
Children under 6 years - Living with two parents Both parents native 1,189 100.0% NativeBoth parents foreign-born 106 72.2% Native41 27.8% Foreign-bornOne native, one foreign-born parent 153 100.0% NativeChildren under 6 years - Living with one parent Native parent 208 100.0% NativeChildren 6 to 17 years - Living with two parents Both parents native 3,413 98.8% Native42 1.2% Foreign-bornBoth parents foreign-born 568 83.9% Native109 16.1% Foreign-bornOne native, one foreign-born parent 402 91.9% Native35 8.1% Foreign-bornChildren 6 to 17 years - Living with one parent Native parent 656 100.0% NativeForeign-born parent 149 54.0% Native126 46.0% Foreign-born
Grandparents responsible for own grandchildren in Camas
Grandparents (30 to 59 years) White / Caucasian 22 38.7% Responsible for grandchildren35 61.3% Not responsible for grandchildrenAmerican Indian / Alaska Native 4 100.0% Responsible for grandchildrenTwo or more races 11 100.0% Responsible for grandchildrenWhite alone, not Hispanic / Latino 22 34.9% Responsible for grandchildren41 65.1% Not responsible for grandchildrenGrandparents (60 years and over) White / Caucasian 8 14.6% Responsible for grandchildren46 85.4% Not responsible for grandchildrenTwo or more races 1 91.1% Responsible for grandchildrenWhite alone, not Hispanic / Latino 8 14.8% Responsible for grandchildren48 85.2% Not responsible for grandchildren