Races in Cold Springs, Nevada (NV) Detailed Stats
Data:
Races - White alone (%)
Races - White alone (% change since 2000)
Races - Black alone (%)
Races - Black alone (% change since 2000)
Races - American Indian alone (%)
Races - American Indian alone (% change since 2000)
Races - Asian alone (%)
Races - Asian alone (% change since 2000)
Races - Hispanic (%)
Races - Hispanic (% change since 2000)
Races - Native Hawaiian and Other Pacific Islander alone (%)
Races - Native Hawaiian and Other Pacific Islander alone (% change since 2000)
Races - Two or more races(%)
Races - Two or more races(% change since 2000)
Races - Other race alone (%)
Races - Other race alone (% change since 2000)
Racial diversity
Place of birth - Born in state of residence (%)
Place of birth - Born in state of residence (%) - White
Place of birth - Born in state of residence (%) - Black or African American
Place of birth - Born in state of residence (%) - Asian
Place of birth - Born in state of residence (%) - Hispanic or Latino
Place of birth - Born in state of residence (%) - American Indian and Alaska Native
Place of birth - Born in state of residence (%) - Multirace
Place of birth - Born in state of residence (%) - Other Race
Place of birth - Born in other state (%)
Place of birth - Born in other state (%) - White
Place of birth - Born in other state (%) - Black or African American
Place of birth - Born in other state (%) - Asian
Place of birth - Born in other state (%) - Hispanic or Latino
Place of birth - Born in other state (%) - American Indian and Alaska Native
Place of birth - Born in other state (%) - Multirace
Place of birth - Born in other state (%) - Other Race
Place of birth - Native, outside of US (%)
Place of birth - Native, outside of US (%) - White
Place of birth - Native, outside of US (%) - Black or African American
Place of birth - Native, outside of US (%) - Asian
Place of birth - Native, outside of US (%) - Hispanic or Latino
Place of birth - Native, outside of US (%) - American Indian and Alaska Native
Place of birth - Native, outside of US (%) - Multirace
Place of birth - Native, outside of US (%) - Other Race
Place of birth - Foreign born (%)
Place of birth - Foreign born (%) - White
Place of birth - Foreign born (%) - Black or African American
Place of birth - Foreign born (%) - Asian
Place of birth - Foreign born (%) - Hispanic or Latino
Place of birth - Foreign born (%) - American Indian and Alaska Native
Place of birth - Foreign born (%) - Multirace
Place of birth - Foreign born (%) - Other Race
Residents speaking English at home (%)
Residents speaking English at home - Born in the United States (%)
Residents speaking English at home - Native, born elsewhere (%)
Residents speaking English at home - Foreign born (%)
Residents speaking Spanish at home (%)
Residents speaking Spanish at home - Born in the United States (%)
Residents speaking Spanish at home - Native, born elsewhere (%)
Residents speaking Spanish at home - Foreign born (%)
Residents speaking other language at home (%)
Residents speaking other language at home - Born in the United States (%)
Residents speaking other language at home - Native, born elsewhere (%)
Residents speaking other language at home - Foreign born (%)
Marital status - Never married (%)
Marital status - Now married (%)
Marital status - Separated (%)
Marital status - Widowed (%)
Marital status - Divorced (%)
Ancestries Reported - Arab (%)
Ancestries Reported - Czech (%)
Ancestries Reported - Danish (%)
Ancestries Reported - Dutch (%)
Ancestries Reported - English (%)
Ancestries Reported - French (%)
Ancestries Reported - French Canadian (%)
Ancestries Reported - German (%)
Ancestries Reported - Greek (%)
Ancestries Reported - Hungarian (%)
Ancestries Reported - Irish (%)
Ancestries Reported - Italian (%)
Ancestries Reported - Lithuanian (%)
Ancestries Reported - Norwegian (%)
Ancestries Reported - Polish (%)
Ancestries Reported - Portuguese (%)
Ancestries Reported - Russian (%)
Ancestries Reported - Scotch-Irish (%)
Ancestries Reported - Scottish (%)
Ancestries Reported - Slovak (%)
Ancestries Reported - Subsaharan African (%)
Ancestries Reported - Swedish (%)
Ancestries Reported - Swiss (%)
Ancestries Reported - Ukrainian (%)
Ancestries Reported - United States (%)
Ancestries Reported - Welsh (%)
Ancestries Reported - West Indian (%)
Ancestries Reported - Other (%)
Geographical mobility - Same house 1 year ago (%)
Geographical mobility - Same house 1 year ago (%) - White
Geographical mobility - Same house 1 year ago (%) - Black or African American
Geographical mobility - Same house 1 year ago (%) - Asian
Geographical mobility - Same house 1 year ago (%) - Hispanic or Latino
Geographical mobility - Same house 1 year ago (%) - American Indian and Alaska Native
Geographical mobility - Same house 1 year ago (%) - Multirace
Geographical mobility - Same house 1 year ago (%) - Other Race
Geographical mobility - Moved within same county (%)
Geographical mobility - Moved within same county (%) - White
Geographical mobility - Moved within same county (%) - Black or African American
Geographical mobility - Moved within same county (%) - Asian
Geographical mobility - Moved within same county (%) - Hispanic or Latino
Geographical mobility - Moved within same county (%) - American Indian and Alaska Native
Geographical mobility - Moved within same county (%) - Multirace
Geographical mobility - Moved within same county (%) - Other Race
Geographical mobility - Moved from different county within same state (%)
Geographical mobility - Moved from different county within same state (%) - White
Geographical mobility - Moved from different county within same state (%) - Black or African American
Geographical mobility - Moved from different county within same state (%) - Asian
Geographical mobility - Moved from different county within same state (%) - Hispanic or Latino
Geographical mobility - Moved from different county within same state (%) - American Indian and Alaska Native
Geographical mobility - Moved from different county within same state (%) - Multirace
Geographical mobility - Moved from different county within same state (%) - Other Race
Geographical mobility - Moved from different state (%)
Geographical mobility - Moved from different state (%) - White
Geographical mobility - Moved from different state (%) - Black or African American
Geographical mobility - Moved from different state (%) - Asian
Geographical mobility - Moved from different state (%) - Hispanic or Latino
Geographical mobility - Moved from different state (%) - American Indian and Alaska Native
Geographical mobility - Moved from different state (%) - Multirace
Geographical mobility - Moved from different state (%) - Other Race
Geographical mobility - Moved from abroad (%)
Geographical mobility - Moved from abroad (%) - White
Geographical mobility - Moved from abroad (%) - Black or African American
Geographical mobility - Moved from abroad (%) - Asian
Geographical mobility - Moved from abroad (%) - Hispanic or Latino
Geographical mobility - Moved from abroad (%) - American Indian and Alaska Native
Geographical mobility - Moved from abroad (%) - Multirace
Geographical mobility - Moved from abroad (%) - Other Race
Place of birth for the foreign-born population - Ireland (%)
Place of birth for the foreign-born population - Denmark (%)
Place of birth for the foreign-born population - Norway (%)
Place of birth for the foreign-born population - Sweden (%)
Place of birth for the foreign-born population - United Kingdom (%)
Place of birth for the foreign-born population - England (%)
Place of birth for the foreign-born population - Scotland (%)
Place of birth for the foreign-born population - Other Northern Europe (%)
Place of birth for the foreign-born population - Austria (%)
Place of birth for the foreign-born population - Belgium (%)
Place of birth for the foreign-born population - France (%)
Place of birth for the foreign-born population - Germany (%)
Place of birth for the foreign-born population - Netherlands (%)
Place of birth for the foreign-born population - Switzerland (%)
Place of birth for the foreign-born population - Other Western Europe (%)
Place of birth for the foreign-born population - Greece (%)
Place of birth for the foreign-born population - Italy (%)
Place of birth for the foreign-born population - Portugal (%)
Place of birth for the foreign-born population - Spain (%)
Place of birth for the foreign-born population - Other Southern Europe (%)
Place of birth for the foreign-born population - Albania (%)
Place of birth for the foreign-born population - Belarus (%)
Place of birth for the foreign-born population - Bosnia and Herzegovina (%)
Place of birth for the foreign-born population - Bulgaria (%)
Place of birth for the foreign-born population - Croatia (%)
Place of birth for the foreign-born population - Czechoslovakia (%)
Place of birth for the foreign-born population - Hungary (%)
Place of birth for the foreign-born population - Latvia (%)
Place of birth for the foreign-born population - Lithuania (%)
Place of birth for the foreign-born population - North Macedonia (Macedonia) (%)
Place of birth for the foreign-born population - Moldova (%)
Place of birth for the foreign-born population - Poland (%)
Place of birth for the foreign-born population - Romania (%)
Place of birth for the foreign-born population - Russia (%)
Place of birth for the foreign-born population - Serbia (%)
Place of birth for the foreign-born population - Ukraine (%)
Place of birth for the foreign-born population - Other Eastern Europe (%)
Place of birth for the foreign-born population - China (%)
Place of birth for the foreign-born population - Hong Kong (%)
Place of birth for the foreign-born population - Taiwan (%)
Place of birth for the foreign-born population - Japan (%)
Place of birth for the foreign-born population - Korea (%)
Place of birth for the foreign-born population - Other Eastern Asia (%)
Place of birth for the foreign-born population - Afghanistan (%)
Place of birth for the foreign-born population - Bangladesh (%)
Place of birth for the foreign-born population - India (%)
Place of birth for the foreign-born population - Iran (%)
Place of birth for the foreign-born population - Kazakhstan (%)
Place of birth for the foreign-born population - Nepal (%)
Place of birth for the foreign-born population - Pakistan (%)
Place of birth for the foreign-born population - Sri Lanka (%)
Place of birth for the foreign-born population - Uzbekistan (%)
Place of birth for the foreign-born population - Other South Central Asia (%)
Place of birth for the foreign-born population - Burma (%)
Place of birth for the foreign-born population - Cambodia (%)
Place of birth for the foreign-born population - Indonesia (%)
Place of birth for the foreign-born population - Laos (%)
Place of birth for the foreign-born population - Malaysia (%)
Place of birth for the foreign-born population - Philippines (%)
Place of birth for the foreign-born population - Singapore (%)
Place of birth for the foreign-born population - Thailand (%)
Place of birth for the foreign-born population - Vietnam (%)
Place of birth for the foreign-born population - Other South Eastern Asia (%)
Place of birth for the foreign-born population - Armenia (%)
Place of birth for the foreign-born population - Iraq (%)
Place of birth for the foreign-born population - Israel (%)
Place of birth for the foreign-born population - Jordan (%)
Place of birth for the foreign-born population - Kuwait (%)
Place of birth for the foreign-born population - Lebanon (%)
Place of birth for the foreign-born population - Saudi Arabia (%)
Place of birth for the foreign-born population - Syria (%)
Place of birth for the foreign-born population - Turkey (%)
Place of birth for the foreign-born population - Yemen (%)
Place of birth for the foreign-born population - Other Western Asia (%)
Place of birth for the foreign-born population - Eritrea (%)
Place of birth for the foreign-born population - Ethiopia (%)
Place of birth for the foreign-born population - Kenya (%)
Place of birth for the foreign-born population - Somalia (%)
Place of birth for the foreign-born population - Uganda (%)
Place of birth for the foreign-born population - Zimbabwe (%)
Place of birth for the foreign-born population - Other Eastern Africa (%)
Place of birth for the foreign-born population - Cameroon (%)
Place of birth for the foreign-born population - Congo (%)
Place of birth for the foreign-born population - Democratic Republic of Congo (Zaire) (%)
Place of birth for the foreign-born population - Other Middle Africa (%)
Place of birth for the foreign-born population - Egypt (%)
Place of birth for the foreign-born population - Morocco (%)
Place of birth for the foreign-born population - Sudan (%)
Place of birth for the foreign-born population - Other Northern Africa (%)
Place of birth for the foreign-born population - South Africa (%)
Place of birth for the foreign-born population - Other Southern Africa (%)
Place of birth for the foreign-born population - Cabo Verde (%)
Place of birth for the foreign-born population - Ghana (%)
Place of birth for the foreign-born population - Liberia (%)
Place of birth for the foreign-born population - Nigeria (%)
Place of birth for the foreign-born population - Senegal (%)
Place of birth for the foreign-born population - Sierra Leone (%)
Place of birth for the foreign-born population - Other Western Africa (%)
Place of birth for the foreign-born population - Australia (%)
Place of birth for the foreign-born population - New Zealand (%)
Place of birth for the foreign-born population - Fiji (%)
Place of birth for the foreign-born population - Micronesia (%)
Place of birth for the foreign-born population - Bahamas (%)
Place of birth for the foreign-born population - Barbados (%)
Place of birth for the foreign-born population - Cuba (%)
Place of birth for the foreign-born population - Dominica (%)
Place of birth for the foreign-born population - Dominican Republic (%)
Place of birth for the foreign-born population - Grenada (%)
Place of birth for the foreign-born population - Haiti (%)
Place of birth for the foreign-born population - Jamaica (%)
Place of birth for the foreign-born population - St. Vincent and the Grenadines (%)
Place of birth for the foreign-born population - Trinidad and Tobago (%)
Place of birth for the foreign-born population - West Indies (%)
Place of birth for the foreign-born population - Other Caribbean (%)
Place of birth for the foreign-born population - Belize (%)
Place of birth for the foreign-born population - Costa Rica (%)
Place of birth for the foreign-born population - El Salvador (%)
Place of birth for the foreign-born population - Guatemala (%)
Place of birth for the foreign-born population - Honduras (%)
Place of birth for the foreign-born population - Mexico (%)
Place of birth for the foreign-born population - Nicaragua (%)
Place of birth for the foreign-born population - Panama (%)
Place of birth for the foreign-born population - Other Central America (%)
Place of birth for the foreign-born population - Argentina (%)
Place of birth for the foreign-born population - Bolivia (%)
Place of birth for the foreign-born population - Brazil (%)
Place of birth for the foreign-born population - Chile (%)
Place of birth for the foreign-born population - Colombia (%)
Place of birth for the foreign-born population - Ecuador (%)
Place of birth for the foreign-born population - Guyana (%)
Place of birth for the foreign-born population - Peru (%)
Place of birth for the foreign-born population - Uruguay (%)
Place of birth for the foreign-born population - Venezuela (%)
Place of birth for the foreign-born population - Other South America (%)
Place of birth for the foreign-born population - Canada (%)
Place of birth for the foreign-born population - Other Northern America (%)
Place of birth for the foreign-born population - Other (%)
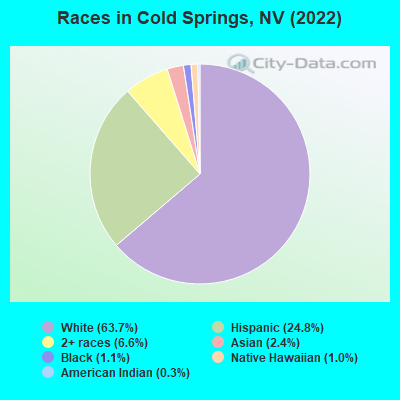
According to 2022 data, the most numerous races in Cold Springs, NV are White alone (7,173 residents), Hispanic (2,795 residents), and Black alone (119 residents). 91.5% of Cold Springs residents speak English at home. 7.4% of Cold Springs, NV residents are foreign-born (3.8% born in Latin America, 2.2% born in Europe, 1.0% born in Asia), which is 144.7% less than the foreign-born rate of 18.0% across the entire state of Nevada.
Race distribution in Cold Springs
2000 2022
1,303,001 65.2% White alone 393,970 19.7% Hispanic 131,509 6.6% Black alone 88,593 4.4% Asian alone 49,231 2.5% Two or more races 21,397 1.1% American Indian alone 7,769 0.4% Native Hawaiian and Other 2,787 0.1% Other race alone
1,410,145 44.4% White alone 961,357 30.3% Hispanic 286,471 9.0% Black alone 281,149 8.8% Asian alone 182,151 5.7% Two or more races 20,102 0.6% Native Hawaiian and Other 18,781 0.6% Other race alone 17,616 0.6% American Indian alone
Income and house value in Cold Springs Median household income in 2022 $78,740 White non-Hispanic householders$124,012 Some other race householders$91,054 Two or more races householders$98,253 Hispanic or Latino race householdersMedian 2022 house value $456,068 White Non-Hispanic householders$692,972 Black or African American householders$415,783 American Indian or Alaska Native householders $683,733 Asian householders$415,783 Some other race householders$600,576 Two or more races householders$445,720 Hispanic or Latino householders
Median age by race in Cold Springs
38.6 Median age for White residents43.5 36.5 17.3 Median age for Black or African American residents16.9 -709,480,121.6 4.9 Median age for American Indian / Alaska Native residents-750,733,137.1 48.9 38.7 Median age for Asian residents69.7 31.0 48.7 Median age for Native Hawaiian / Pacific Islander residents45.7 -725,146,198.1 17.3 Median age for Other race residents16.1 39.2 17.7 Median age for Two or more races residents13.5 18.7 37.6 Median age for White alone residents43.5 35.1 23.5 Median age for Hispanic or Latino residents16.6 35.1
Owner/renter occupied households by race in Cold Springs
House owners and renters - White residents 2,579 90.3% Owner occupied277 9.7% Renter occupiedHouse owners and renters - Black or African American residents 21 100.0% Owner occupiedHouse owners and renters - American Indian / Alaska Native residents 11 100.0% Owner occupiedHouse owners and renters - Asian residents 41 100.0% Owner occupiedHouse owners and renters - Native Hawaiian / Pacific Islander residents 73 100.0% Owner occupiedHouse owners and renters - Other race residents 184 100.0% Owner occupiedHouse owners and renters - Two or more races residents 443 88.1% Owner occupied60 11.9% Renter occupiedHouse owners and renters - White alone residents 2,548 90.7% Owner occupied262 9.3% Renter occupiedHouse owners and renters - Hispanic or Latino residents 494 87.2% Owner occupied73 12.8% Renter occupied
Language usage in Cold Springs
English speakers - Total 91.5% of residents of Cold Springs speak English at home.
5.9% of residents speak Spanish at home 507 83.0% Speak English very well104 17.0% Speak English less than very well3.2% of residents speak other language at home 217 64.8% Speak English very well118 35.2% Speak English less than very well
English speakers - Born in the United States 92.1% of residents of Cold Springs speak English at home.
6.7% of residents speak Spanish at home 298 81.4% Speak English very well68 18.6% Speak English less than very well1.0% of residents speak other language at home 56 100.0% Speak English very well
English speakers - Native, born elsewhere 81.5% of residents of Cold Springs speak English at home.
4.2% of residents speak other language at home 10 90.9% Speak English very well1 9.1% Speak English less than very well
English speakers - Foreign-born 41.8% of residents of Cold Springs speak English at home.
25.5% of residents speak Spanish at home 205 100.0% Speak English very well30.3% of residents speak other language at home 127 52.0% Speak English very well117 48.0% Speak English less than very well
White (Caucasian) - Speak only English Native:
99.2% (6,539)Foreign-born:
46.9% (87)
White (Caucasian) - Speak another language Native:
2.0% (130)Foreign-born:
52.3% (97)
Black or African American - Speak only English Native:
100.0% (106)Foreign-born:
97.6% (19)
Asian - Speak another language Native:
19.8% (25)Foreign-born:
98.8% (101)
Other race - Speak only English Native:
100.0% (1,217)Foreign-born:
83.4% (275)
Other race - Speak another language Native:
6.7% (82)Foreign-born:
30.1% (99)
Two or more races - Speak another language Native:
17.4% (226)Foreign-born:
100.0% (121)
White alone - Speak only English Native:
98.2% (6,224)Foreign-born:
36.0% (90)
White alone - Speak another language Native:
1.9% (118)Foreign-born:
60.6% (151)
Hispanic or Latino - Speak only English Native:
86.5% (1,913)Foreign-born:
59.6% (255)
Hispanic or Latino - Speak another language Native:
15.2% (336)Foreign-born:
50.9% (218)
Foreign-born residents in Cold Springs 828 residents are foreign born (3.8% Latin America , 2.2% Europe , 1.0% Asia ).
This city:
7.4%Nevada:
19.1%
Marital status for residents in Cold Springs Marital status - White (Caucasian) population 15 years and over
Males 21.6% Never married59.5% Now married1.3% Separated2.0% Widowed15.6% DivorcedFemales 21.5% Never married58.6% Now married3.0% Separated2.6% Widowed14.2% DivorcedWomen who gave birth in the past 12 months Now married:
97.6% (153)Unmarried:
2.4% (4)
Women who did not give birth in the past 12 months Now married:
49.7% (810)Unmarried:
50.3% (818)
Marital status - Black or African American population 15 years and over
Males 93.0% Never married7.0% Now married0.0% Separated0.0% Widowed0.0% DivorcedFemales 0.0% Never married100.0% Now married0.0% Separated0.0% Widowed0.0% DivorcedMarital status - Asian population 15 years and over
Males 0.0% Never married68.1% Now married0.0% Separated31.9% Widowed0.0% DivorcedFemales 8.9% Never married74.7% Now married0.0% Separated1.9% Widowed14.6% DivorcedWomen who did not give birth in the past 12 months Now married:
87.0% (99)Unmarried:
13.0% (15)
Marital status - Other race population 15 years and over
Males 56.0% Never married44.0% Now married0.0% Separated0.0% Widowed0.0% DivorcedFemales 31.5% Never married61.3% Now married0.0% Separated3.3% Widowed3.9% DivorcedWomen who did not give birth in the past 12 months Now married:
39.2% (78)Unmarried:
60.8% (121)
Marital status - Two or more races population 15 years and over
Males 36.0% Never married61.2% Now married0.0% Separated0.0% Widowed2.8% DivorcedFemales 31.6% Never married58.4% Now married0.0% Separated0.0% Widowed10.1% DivorcedWomen who gave birth in the past 12 months Now married:
100.0% (10)Unmarried:
0.0% (0)
Women who did not give birth in the past 12 months Now married:
55.9% (241)Unmarried:
44.1% (190)
Marital status - White alone, not Hispanic / Latino population 15 years and over
Males 20.1% Never married59.8% Now married1.4% Separated2.2% Widowed16.5% DivorcedFemales 21.6% Never married58.5% Now married3.2% Separated2.8% Widowed14.0% DivorcedWomen who gave birth in the past 12 months Now married:
97.6% (162)Unmarried:
2.4% (4)
Women who did not give birth in the past 12 months Now married:
50.3% (810)Unmarried:
49.7% (801)
Marital status - Hispanic or Latino population 15 years and over
Males 47.3% Never married51.2% Now married0.0% Separated0.0% Widowed1.5% DivorcedFemales 29.0% Never married58.4% Now married0.0% Separated1.3% Widowed11.3% DivorcedWomen who did not give birth in the past 12 months Now married:
47.8% (264)Unmarried:
52.2% (288)
Ancestries in Cold Springs
680 11.6% English490 8.3% American457 7.8% German319 5.4% Irish184 3.1% Italian153 2.6% European87 1.5% Russian77 1.3% French54 0.9% Norwegian52 0.9% Scotch-Irish40 0.7% Dutch36 0.6% Swedish28 0.5% Polish27 0.5% Danish23 0.4% Hungarian22 0.4% Swiss19 0.3% Finnish16 0.3% British16 0.3% Portuguese15 0.3% French Canadian14 0.2% Eastern European12 0.2% Canadian12 0.2% Icelander8 0.1% Austrian8 0.1% Belizean7 0.1% Belgian7 0.1% Ukrainian6 0.1% Croatian
Children Nativity (place of birth) in Cold Springs
Children under 6 years - Living with two parents Both parents native 675 100.0% NativeOne native, one foreign-born parent 249 100.0% NativeChildren under 6 years - Living with one parent Native parent 114 100.0% Native
Children 6 to 17 years - Living with two parents Both parents native 1,173 100.0% NativeBoth parents foreign-born 78 100.0% NativeOne native, one foreign-born parent 343 100.0% NativeChildren 6 to 17 years - Living with one parent Native parent 497 100.0% Native
Grandparents responsible for own grandchildren in Cold Springs
Grandparents (30 to 59 years) White / Caucasian 5 3.7% Responsible for grandchildren142 96.3% Not responsible for grandchildrenAsian 9 100.0% Responsible for grandchildrenOther race 63 100.0% Not responsible for grandchildrenTwo or more races 17 100.0% Responsible for grandchildrenWhite alone, not Hispanic / Latino 5 6.3% Responsible for grandchildren80 93.7% Not responsible for grandchildrenHispanic or Latino 13 13.9% Responsible for grandchildren83 86.1% Not responsible for grandchildrenGrandparents (60 years and over) White / Caucasian 162 50.0% Responsible for grandchildren162 50.0% Not responsible for grandchildrenAsian 24 100.0% Not responsible for grandchildrenOther race 28 100.0% Not responsible for grandchildrenWhite alone, not Hispanic / Latino 156 45.2% Responsible for grandchildren189 54.8% Not responsible for grandchildrenHispanic or Latino 5 21.6% Responsible for grandchildren17 78.4% Not responsible for grandchildren