Races in Cuyahoga Falls, Ohio (OH) Detailed Stats
Data:
Races - White alone (%)
Races - White alone (% change since 2000)
Races - Black alone (%)
Races - Black alone (% change since 2000)
Races - American Indian alone (%)
Races - American Indian alone (% change since 2000)
Races - Asian alone (%)
Races - Asian alone (% change since 2000)
Races - Hispanic (%)
Races - Hispanic (% change since 2000)
Races - Native Hawaiian and Other Pacific Islander alone (%)
Races - Native Hawaiian and Other Pacific Islander alone (% change since 2000)
Races - Two or more races(%)
Races - Two or more races(% change since 2000)
Races - Other race alone (%)
Races - Other race alone (% change since 2000)
Racial diversity
Place of birth - Born in state of residence (%)
Place of birth - Born in state of residence (%) - White
Place of birth - Born in state of residence (%) - Black or African American
Place of birth - Born in state of residence (%) - Asian
Place of birth - Born in state of residence (%) - Hispanic or Latino
Place of birth - Born in state of residence (%) - American Indian and Alaska Native
Place of birth - Born in state of residence (%) - Multirace
Place of birth - Born in state of residence (%) - Other Race
Place of birth - Born in other state (%)
Place of birth - Born in other state (%) - White
Place of birth - Born in other state (%) - Black or African American
Place of birth - Born in other state (%) - Asian
Place of birth - Born in other state (%) - Hispanic or Latino
Place of birth - Born in other state (%) - American Indian and Alaska Native
Place of birth - Born in other state (%) - Multirace
Place of birth - Born in other state (%) - Other Race
Place of birth - Native, outside of US (%)
Place of birth - Native, outside of US (%) - White
Place of birth - Native, outside of US (%) - Black or African American
Place of birth - Native, outside of US (%) - Asian
Place of birth - Native, outside of US (%) - Hispanic or Latino
Place of birth - Native, outside of US (%) - American Indian and Alaska Native
Place of birth - Native, outside of US (%) - Multirace
Place of birth - Native, outside of US (%) - Other Race
Place of birth - Foreign born (%)
Place of birth - Foreign born (%) - White
Place of birth - Foreign born (%) - Black or African American
Place of birth - Foreign born (%) - Asian
Place of birth - Foreign born (%) - Hispanic or Latino
Place of birth - Foreign born (%) - American Indian and Alaska Native
Place of birth - Foreign born (%) - Multirace
Place of birth - Foreign born (%) - Other Race
Residents speaking English at home (%)
Residents speaking English at home - Born in the United States (%)
Residents speaking English at home - Native, born elsewhere (%)
Residents speaking English at home - Foreign born (%)
Residents speaking Spanish at home (%)
Residents speaking Spanish at home - Born in the United States (%)
Residents speaking Spanish at home - Native, born elsewhere (%)
Residents speaking Spanish at home - Foreign born (%)
Residents speaking other language at home (%)
Residents speaking other language at home - Born in the United States (%)
Residents speaking other language at home - Native, born elsewhere (%)
Residents speaking other language at home - Foreign born (%)
Marital status - Never married (%)
Marital status - Now married (%)
Marital status - Separated (%)
Marital status - Widowed (%)
Marital status - Divorced (%)
Ancestries Reported - Arab (%)
Ancestries Reported - Czech (%)
Ancestries Reported - Danish (%)
Ancestries Reported - Dutch (%)
Ancestries Reported - English (%)
Ancestries Reported - French (%)
Ancestries Reported - French Canadian (%)
Ancestries Reported - German (%)
Ancestries Reported - Greek (%)
Ancestries Reported - Hungarian (%)
Ancestries Reported - Irish (%)
Ancestries Reported - Italian (%)
Ancestries Reported - Lithuanian (%)
Ancestries Reported - Norwegian (%)
Ancestries Reported - Polish (%)
Ancestries Reported - Portuguese (%)
Ancestries Reported - Russian (%)
Ancestries Reported - Scotch-Irish (%)
Ancestries Reported - Scottish (%)
Ancestries Reported - Slovak (%)
Ancestries Reported - Subsaharan African (%)
Ancestries Reported - Swedish (%)
Ancestries Reported - Swiss (%)
Ancestries Reported - Ukrainian (%)
Ancestries Reported - United States (%)
Ancestries Reported - Welsh (%)
Ancestries Reported - West Indian (%)
Ancestries Reported - Other (%)
Geographical mobility - Same house 1 year ago (%)
Geographical mobility - Same house 1 year ago (%) - White
Geographical mobility - Same house 1 year ago (%) - Black or African American
Geographical mobility - Same house 1 year ago (%) - Asian
Geographical mobility - Same house 1 year ago (%) - Hispanic or Latino
Geographical mobility - Same house 1 year ago (%) - American Indian and Alaska Native
Geographical mobility - Same house 1 year ago (%) - Multirace
Geographical mobility - Same house 1 year ago (%) - Other Race
Geographical mobility - Moved within same county (%)
Geographical mobility - Moved within same county (%) - White
Geographical mobility - Moved within same county (%) - Black or African American
Geographical mobility - Moved within same county (%) - Asian
Geographical mobility - Moved within same county (%) - Hispanic or Latino
Geographical mobility - Moved within same county (%) - American Indian and Alaska Native
Geographical mobility - Moved within same county (%) - Multirace
Geographical mobility - Moved within same county (%) - Other Race
Geographical mobility - Moved from different county within same state (%)
Geographical mobility - Moved from different county within same state (%) - White
Geographical mobility - Moved from different county within same state (%) - Black or African American
Geographical mobility - Moved from different county within same state (%) - Asian
Geographical mobility - Moved from different county within same state (%) - Hispanic or Latino
Geographical mobility - Moved from different county within same state (%) - American Indian and Alaska Native
Geographical mobility - Moved from different county within same state (%) - Multirace
Geographical mobility - Moved from different county within same state (%) - Other Race
Geographical mobility - Moved from different state (%)
Geographical mobility - Moved from different state (%) - White
Geographical mobility - Moved from different state (%) - Black or African American
Geographical mobility - Moved from different state (%) - Asian
Geographical mobility - Moved from different state (%) - Hispanic or Latino
Geographical mobility - Moved from different state (%) - American Indian and Alaska Native
Geographical mobility - Moved from different state (%) - Multirace
Geographical mobility - Moved from different state (%) - Other Race
Geographical mobility - Moved from abroad (%)
Geographical mobility - Moved from abroad (%) - White
Geographical mobility - Moved from abroad (%) - Black or African American
Geographical mobility - Moved from abroad (%) - Asian
Geographical mobility - Moved from abroad (%) - Hispanic or Latino
Geographical mobility - Moved from abroad (%) - American Indian and Alaska Native
Geographical mobility - Moved from abroad (%) - Multirace
Geographical mobility - Moved from abroad (%) - Other Race
Place of birth for the foreign-born population - Ireland (%)
Place of birth for the foreign-born population - Denmark (%)
Place of birth for the foreign-born population - Norway (%)
Place of birth for the foreign-born population - Sweden (%)
Place of birth for the foreign-born population - United Kingdom (%)
Place of birth for the foreign-born population - England (%)
Place of birth for the foreign-born population - Scotland (%)
Place of birth for the foreign-born population - Other Northern Europe (%)
Place of birth for the foreign-born population - Austria (%)
Place of birth for the foreign-born population - Belgium (%)
Place of birth for the foreign-born population - France (%)
Place of birth for the foreign-born population - Germany (%)
Place of birth for the foreign-born population - Netherlands (%)
Place of birth for the foreign-born population - Switzerland (%)
Place of birth for the foreign-born population - Other Western Europe (%)
Place of birth for the foreign-born population - Greece (%)
Place of birth for the foreign-born population - Italy (%)
Place of birth for the foreign-born population - Portugal (%)
Place of birth for the foreign-born population - Spain (%)
Place of birth for the foreign-born population - Other Southern Europe (%)
Place of birth for the foreign-born population - Albania (%)
Place of birth for the foreign-born population - Belarus (%)
Place of birth for the foreign-born population - Bosnia and Herzegovina (%)
Place of birth for the foreign-born population - Bulgaria (%)
Place of birth for the foreign-born population - Croatia (%)
Place of birth for the foreign-born population - Czechoslovakia (%)
Place of birth for the foreign-born population - Hungary (%)
Place of birth for the foreign-born population - Latvia (%)
Place of birth for the foreign-born population - Lithuania (%)
Place of birth for the foreign-born population - North Macedonia (Macedonia) (%)
Place of birth for the foreign-born population - Moldova (%)
Place of birth for the foreign-born population - Poland (%)
Place of birth for the foreign-born population - Romania (%)
Place of birth for the foreign-born population - Russia (%)
Place of birth for the foreign-born population - Serbia (%)
Place of birth for the foreign-born population - Ukraine (%)
Place of birth for the foreign-born population - Other Eastern Europe (%)
Place of birth for the foreign-born population - China (%)
Place of birth for the foreign-born population - Hong Kong (%)
Place of birth for the foreign-born population - Taiwan (%)
Place of birth for the foreign-born population - Japan (%)
Place of birth for the foreign-born population - Korea (%)
Place of birth for the foreign-born population - Other Eastern Asia (%)
Place of birth for the foreign-born population - Afghanistan (%)
Place of birth for the foreign-born population - Bangladesh (%)
Place of birth for the foreign-born population - India (%)
Place of birth for the foreign-born population - Iran (%)
Place of birth for the foreign-born population - Kazakhstan (%)
Place of birth for the foreign-born population - Nepal (%)
Place of birth for the foreign-born population - Pakistan (%)
Place of birth for the foreign-born population - Sri Lanka (%)
Place of birth for the foreign-born population - Uzbekistan (%)
Place of birth for the foreign-born population - Other South Central Asia (%)
Place of birth for the foreign-born population - Burma (%)
Place of birth for the foreign-born population - Cambodia (%)
Place of birth for the foreign-born population - Indonesia (%)
Place of birth for the foreign-born population - Laos (%)
Place of birth for the foreign-born population - Malaysia (%)
Place of birth for the foreign-born population - Philippines (%)
Place of birth for the foreign-born population - Singapore (%)
Place of birth for the foreign-born population - Thailand (%)
Place of birth for the foreign-born population - Vietnam (%)
Place of birth for the foreign-born population - Other South Eastern Asia (%)
Place of birth for the foreign-born population - Armenia (%)
Place of birth for the foreign-born population - Iraq (%)
Place of birth for the foreign-born population - Israel (%)
Place of birth for the foreign-born population - Jordan (%)
Place of birth for the foreign-born population - Kuwait (%)
Place of birth for the foreign-born population - Lebanon (%)
Place of birth for the foreign-born population - Saudi Arabia (%)
Place of birth for the foreign-born population - Syria (%)
Place of birth for the foreign-born population - Turkey (%)
Place of birth for the foreign-born population - Yemen (%)
Place of birth for the foreign-born population - Other Western Asia (%)
Place of birth for the foreign-born population - Eritrea (%)
Place of birth for the foreign-born population - Ethiopia (%)
Place of birth for the foreign-born population - Kenya (%)
Place of birth for the foreign-born population - Somalia (%)
Place of birth for the foreign-born population - Uganda (%)
Place of birth for the foreign-born population - Zimbabwe (%)
Place of birth for the foreign-born population - Other Eastern Africa (%)
Place of birth for the foreign-born population - Cameroon (%)
Place of birth for the foreign-born population - Congo (%)
Place of birth for the foreign-born population - Democratic Republic of Congo (Zaire) (%)
Place of birth for the foreign-born population - Other Middle Africa (%)
Place of birth for the foreign-born population - Egypt (%)
Place of birth for the foreign-born population - Morocco (%)
Place of birth for the foreign-born population - Sudan (%)
Place of birth for the foreign-born population - Other Northern Africa (%)
Place of birth for the foreign-born population - South Africa (%)
Place of birth for the foreign-born population - Other Southern Africa (%)
Place of birth for the foreign-born population - Cabo Verde (%)
Place of birth for the foreign-born population - Ghana (%)
Place of birth for the foreign-born population - Liberia (%)
Place of birth for the foreign-born population - Nigeria (%)
Place of birth for the foreign-born population - Senegal (%)
Place of birth for the foreign-born population - Sierra Leone (%)
Place of birth for the foreign-born population - Other Western Africa (%)
Place of birth for the foreign-born population - Australia (%)
Place of birth for the foreign-born population - New Zealand (%)
Place of birth for the foreign-born population - Fiji (%)
Place of birth for the foreign-born population - Micronesia (%)
Place of birth for the foreign-born population - Bahamas (%)
Place of birth for the foreign-born population - Barbados (%)
Place of birth for the foreign-born population - Cuba (%)
Place of birth for the foreign-born population - Dominica (%)
Place of birth for the foreign-born population - Dominican Republic (%)
Place of birth for the foreign-born population - Grenada (%)
Place of birth for the foreign-born population - Haiti (%)
Place of birth for the foreign-born population - Jamaica (%)
Place of birth for the foreign-born population - St. Vincent and the Grenadines (%)
Place of birth for the foreign-born population - Trinidad and Tobago (%)
Place of birth for the foreign-born population - West Indies (%)
Place of birth for the foreign-born population - Other Caribbean (%)
Place of birth for the foreign-born population - Belize (%)
Place of birth for the foreign-born population - Costa Rica (%)
Place of birth for the foreign-born population - El Salvador (%)
Place of birth for the foreign-born population - Guatemala (%)
Place of birth for the foreign-born population - Honduras (%)
Place of birth for the foreign-born population - Mexico (%)
Place of birth for the foreign-born population - Nicaragua (%)
Place of birth for the foreign-born population - Panama (%)
Place of birth for the foreign-born population - Other Central America (%)
Place of birth for the foreign-born population - Argentina (%)
Place of birth for the foreign-born population - Bolivia (%)
Place of birth for the foreign-born population - Brazil (%)
Place of birth for the foreign-born population - Chile (%)
Place of birth for the foreign-born population - Colombia (%)
Place of birth for the foreign-born population - Ecuador (%)
Place of birth for the foreign-born population - Guyana (%)
Place of birth for the foreign-born population - Peru (%)
Place of birth for the foreign-born population - Uruguay (%)
Place of birth for the foreign-born population - Venezuela (%)
Place of birth for the foreign-born population - Other South America (%)
Place of birth for the foreign-born population - Canada (%)
Place of birth for the foreign-born population - Other Northern America (%)
Place of birth for the foreign-born population - Other (%)
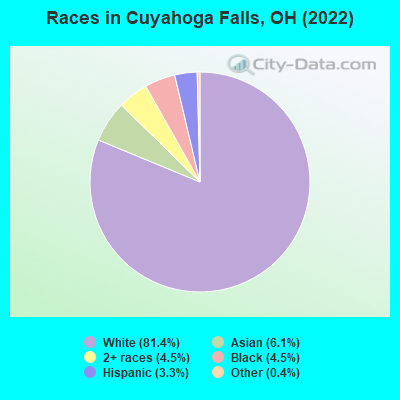
According to 2022 data, the most numerous races in Cuyahoga Falls, OH are White alone (41,197 residents), Black alone (2,270 residents), and Two or more races (2,284 residents). 89.5% of Cuyahoga Falls residents speak English at home. 7.9% of Cuyahoga Falls, OH residents are foreign-born (4.9% born in Asia, 1.2% born in Europe, 0.9% born in Latin America), which is 49.4% greater than the foreign-born rate of 4.0% across the entire state of Ohio.
Race distribution in Cuyahoga Falls
2000 2022
9,538,111 84.0% White alone 1,290,662 11.4% Black alone 217,123 1.9% Hispanic 137,770 1.2% Two or more races 131,670 1.2% Asian alone 21,985 0.2% American Indian alone 13,483 0.1% Other race alone 2,336 0.02% Native Hawaiian and Other
8,948,793 76.1% White alone 1,401,403 11.9% Black alone 529,291 4.5% Two or more races 517,232 4.4% Hispanic 293,387 2.5% Asian alone 52,805 0.4% Other race alone 9,785 0.08% American Indian alone 3,362 0.03% Native Hawaiian and Other
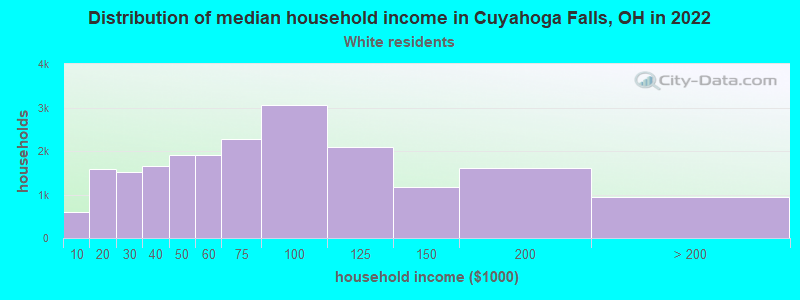
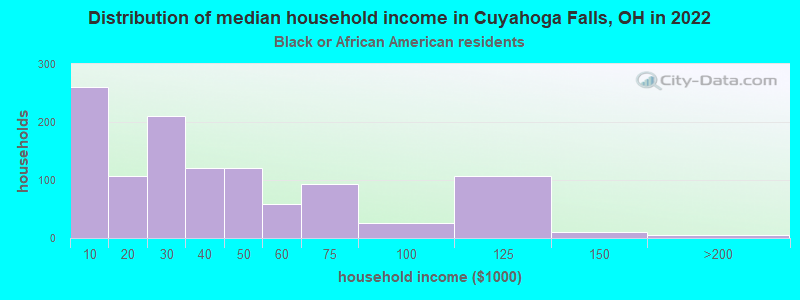
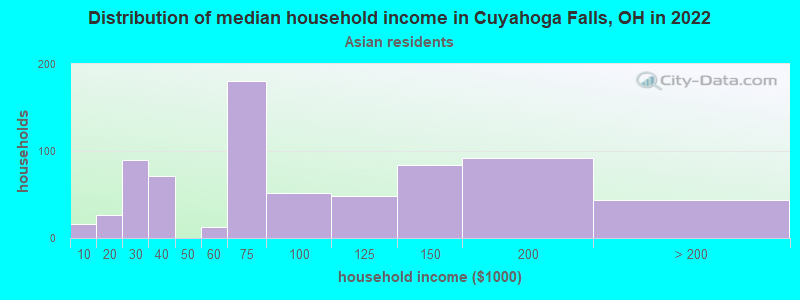
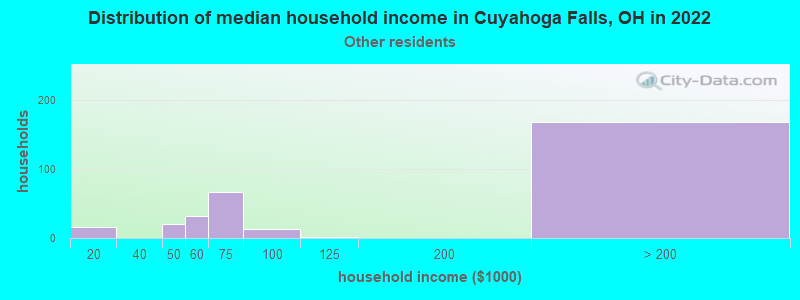
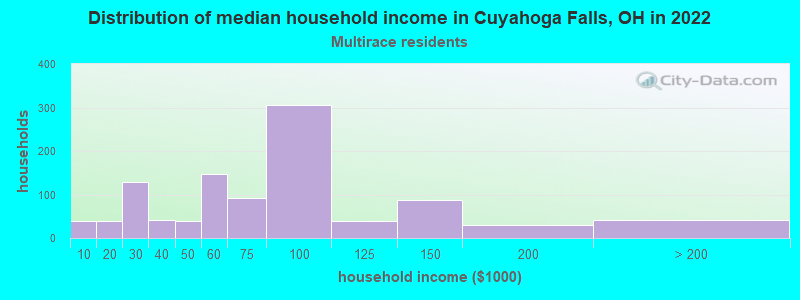
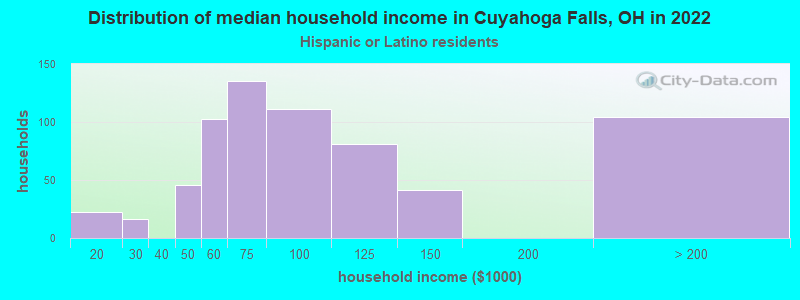
Income and house value in Cuyahoga Falls Median household income in 2022 $67,284 White non-Hispanic householders$30,347 Black householders$57,786 Asian householders$70,310 Two or more races householders$94,776 Hispanic or Latino race householdersMedian 2022 house value $172,075 White Non-Hispanic householders$219,595 Black or African American householders$140,612 American Indian or Alaska Native householders $268,087 Asian householders$200,782 Some other race householders$122,934 Two or more races householders$198,187 Hispanic or Latino householders
Median age by race in Cuyahoga Falls
41.4 Median age for White residents41.7 40.9 30.2 Median age for Black or African American residents29.1 30.9 13.2 Median age for American Indian / Alaska Native residents-668,371,695.8 -390,759,075.5 32.8 Median age for Asian residents34.8 31.8 -800,387,596.1 Median age for Native Hawaiian / Pacific Islander residents-666,666,666.0 -805,394,989.6 24.2 Median age for Other race residents23.4 23.4 28.4 Median age for Two or more races residents29.0 28.0 41.5 Median age for White alone residents41.7 41.2 27.0 Median age for Hispanic or Latino residents26.4 28.2
Owner/renter occupied households by race in Cuyahoga Falls
House owners and renters - White residents 13,566 67.0% Owner occupied6,684 33.0% Renter occupiedHouse owners and renters - Black or African American residents 148 14.6% Owner occupied867 85.4% Renter occupiedHouse owners and renters - American Indian / Alaska Native residents 4 100.0% Renter occupiedHouse owners and renters - Asian residents 378 50.0% Owner occupied378 50.0% Renter occupiedHouse owners and renters - Other race residents 122 55.0% Owner occupied100 45.0% Renter occupiedHouse owners and renters - Two or more races residents 338 33.9% Owner occupied659 66.1% Renter occupiedHouse owners and renters - White alone residents 13,582 67.6% Owner occupied6,502 32.4% Renter occupiedHouse owners and renters - Hispanic or Latino residents 216 31.4% Owner occupied473 68.6% Renter occupied
Language usage in Cuyahoga Falls
English speakers - Total 89.5% of residents of Cuyahoga Falls speak English at home.
1.4% of residents speak Spanish at home 525 77.5% Speak English very well152 22.5% Speak English less than very well9.2% of residents speak other language at home 2,169 49.5% Speak English very well2,213 50.5% Speak English less than very well
English speakers - Born in the United States 95.6% of residents of Cuyahoga Falls speak English at home.
1.0% of residents speak Spanish at home 66 77.6% Speak English very well19 22.4% Speak English less than very well2.9% of residents speak other language at home 176 73.0% Speak English very well65 27.0% Speak English less than very well
English speakers - Native, born elsewhere 55.3% of residents of Cuyahoga Falls speak English at home.
12.1% of residents speak Spanish at home 11 27.5% Speak English very well29 72.5% Speak English less than very well32.9% of residents speak other language at home 33 30.3% Speak English very well76 69.7% Speak English less than very well
English speakers - Foreign-born 10.5% of residents of Cuyahoga Falls speak English at home.
11.3% of residents speak Spanish at home 377 85.7% Speak English very well63 14.3% Speak English less than very well81.2% of residents speak other language at home 1,220 38.7% Speak English very well1,933 61.3% Speak English less than very well
White (Caucasian) - Speak only English Native:
98.2% (37,933)Foreign-born:
22.8% (211)
White (Caucasian) - Speak another language Native:
1.8% (701)Foreign-born:
78.6% (728)
Black or African American - Speak only English Native:
99.9% (1,764)Foreign-born:
11.6% (21)
Asian - Speak only English Native:
15.1% (100)Foreign-born:
7.0% (159)
Asian - Speak another language Native:
65.2% (432)Foreign-born:
94.3% (2,141)
Other race - Speak another language Native:
43.1% (202)Foreign-born:
100.0% (402)
Two or more races - Speak only English Native:
92.3% (2,094)Foreign-born:
4.9% (11)
Two or more races - Speak another language Native:
6.7% (151)Foreign-born:
100.0% (223)
White alone - Speak only English Native:
98.1% (37,618)Foreign-born:
23.8% (211)
White alone - Speak another language Native:
2.0% (766)Foreign-born:
77.9% (693)
Hispanic or Latino - Speak another language Native:
11.7% (123)Foreign-born:
100.0% (408)
Foreign-born residents in Cuyahoga Falls 3,996 residents are foreign born (4.9% Asia , 1.2% Europe , 0.9% Latin America ).
Marital status for residents in Cuyahoga Falls Marital status - White (Caucasian) population 15 years and over
Males 35.0% Never married50.2% Now married0.5% Separated3.3% Widowed10.9% DivorcedFemales 29.2% Never married45.9% Now married1.2% Separated10.3% Widowed13.3% DivorcedWomen who gave birth in the past 12 months Now married:
70.7% (248)Unmarried:
29.3% (103)
Women who did not give birth in the past 12 months Now married:
42.2% (4,087)Unmarried:
57.8% (5,602)
Marital status - Black or African American population 15 years and over
Males 46.3% Never married39.0% Now married3.9% Separated0.4% Widowed10.5% DivorcedFemales 50.8% Never married31.5% Now married0.0% Separated5.2% Widowed12.5% DivorcedWomen who gave birth in the past 12 months Now married:
68.4% (39)Unmarried:
31.6% (18)
Women who did not give birth in the past 12 months Now married:
33.8% (208)Unmarried:
66.2% (407)
Marital status - Asian population 15 years and over
Males 37.3% Never married50.4% Now married1.7% Separated6.9% Widowed3.7% DivorcedFemales 23.8% Never married64.0% Now married0.0% Separated5.3% Widowed6.9% DivorcedWomen who gave birth in the past 12 months Now married:
100.0% (109)Unmarried:
0.0% (0)
Women who did not give birth in the past 12 months Now married:
65.8% (528)Unmarried:
34.2% (275)
Marital status - Other race population 15 years and over
Males 48.6% Never married51.4% Now married0.0% Separated0.0% Widowed0.0% DivorcedFemales 42.1% Never married51.5% Now married0.0% Separated0.0% Widowed6.4% DivorcedWomen who did not give birth in the past 12 months Now married:
51.5% (177)Unmarried:
48.5% (166)
Marital status - Two or more races population 15 years and over
Males 52.5% Never married39.8% Now married0.0% Separated0.0% Widowed7.7% DivorcedFemales 48.1% Never married45.7% Now married1.3% Separated3.9% Widowed0.9% DivorcedWomen who gave birth in the past 12 months Now married:
60.7% (102)Unmarried:
39.3% (66)
Women who did not give birth in the past 12 months Now married:
42.5% (243)Unmarried:
57.5% (329)
Marital status - White alone, not Hispanic / Latino population 15 years and over
Males 34.9% Never married50.2% Now married0.5% Separated3.4% Widowed11.0% DivorcedFemales 29.2% Never married46.1% Now married1.2% Separated10.3% Widowed13.1% DivorcedWomen who gave birth in the past 12 months Now married:
70.7% (250)Unmarried:
29.3% (104)
Women who did not give birth in the past 12 months Now married:
42.5% (4,092)Unmarried:
57.5% (5,528)
Marital status - Hispanic or Latino population 15 years and over
Males 48.7% Never married48.9% Now married0.0% Separated0.0% Widowed2.4% DivorcedFemales 36.0% Never married51.9% Now married0.0% Separated2.1% Widowed10.1% DivorcedWomen who did not give birth in the past 12 months Now married:
50.6% (262)Unmarried:
49.4% (257)
Ancestries in Cuyahoga Falls
4,004 17.8% German2,164 9.6% Italian1,967 8.8% American1,944 8.7% English1,377 6.1% Irish609 2.7% European453 2.0% Hungarian449 2.0% Polish327 1.5% Russian280 1.2% Scottish252 1.1% Scotch-Irish223 1.0% Romanian200 0.9% Arab152 0.7% Ghanaian138 0.6% Croatian126 0.6% Ukrainian123 0.5% Greek115 0.5% African113 0.5% Czech107 0.5% Macedonian104 0.5% Slovak87 0.4% French Canadian80 0.4% Slavic72 0.3% Serbian70 0.3% Dutch67 0.3% French61 0.3% British47 0.2% Pennsylvania German46 0.2% Norwegian44 0.2% Eastern European42 0.2% Slovene38 0.2% Nigerian36 0.2% Lebanese35 0.2% Swedish30 0.1% Northern European30 0.1% Scandinavian30 0.1% Swiss29 0.1% Austrian27 0.1% Yugoslavian25 0.1% Syrian25 0.1% Jamaican23 0.1% Welsh22 0.10% Belgian15 0.07% Czechoslovakian13 0.06% Carpatho Rusyn12 0.05% Finnish11 0.05% Lithuanian8 0.04% Ethiopian5 0.02% South African
Geographical mobility in Cuyahoga Falls Same house 1 year ago 35,821 86.7% White (Caucasian)1,452 63.5% Black or African American17 100.0% American Indian / Alaska Native2,685 86.4% Asian892 90.4% Other race2,055 74.3% Two or more races35,540 86.7% White alone, not Hispanic / Latino1,342 84.7% Hispanic or LatinoMoved within same county 2,955 7.2% White / Caucasian351 15.3% Black or African American38 1.2% Asian57 5.8% Other race306 11.0% Two or more races2,963 7.2% White alone, not Hispanic / Latino67 4.2% Hispanic or LatinoMoved within same state 1,979 4.8% White / Caucasian456 19.9% Black or African American60 1.9% Asian23 2.3% Other race80 2.9% Two or more races1,917 4.7% White alone, not Hispanic / Latino160 10.1% Hispanic or LatinoMoved from different state 447 1.1% White / Caucasian36 1.6% Black or African American249 8.0% Asian122 4.4% Two or more races447 1.1% White alone, not Hispanic / LatinoMoved from abroad 111 0.3% White8 0.2% Asian270 9.8% Two or more races118 0.3% White alone, not Hispanic / Latino24 1.5% Hispanic or Latino
Children Nativity (place of birth) in Cuyahoga Falls
Children under 6 years - Living with two parents Both parents native 1,610 100.0% NativeBoth parents foreign-born 365 76.8% Native110 23.2% Foreign-bornOne native, one foreign-born parent 224 100.0% NativeChildren under 6 years - Living with one parent Native parent 751 100.0% NativeForeign-born parent 10 100.0% NativeChildren 6 to 17 years - Living with two parents Both parents native 2,803 99.1% Native26 0.9% Foreign-bornBoth parents foreign-born 770 83.3% Native155 16.7% Foreign-bornOne native, one foreign-born parent 144 100.0% NativeChildren 6 to 17 years - Living with one parent Native parent 1,822 100.0% NativeForeign-born parent 15 43.0% Native19 57.0% Foreign-born
Grandparents responsible for own grandchildren in Cuyahoga Falls
Grandparents (30 to 59 years) White / Caucasian 34 19.8% Responsible for grandchildren138 80.2% Not responsible for grandchildrenAsian 38 100.0% Not responsible for grandchildrenWhite alone, not Hispanic / Latino 34 20.0% Responsible for grandchildren138 80.0% Not responsible for grandchildrenGrandparents (60 years and over) White / Caucasian 71 39.5% Responsible for grandchildren108 60.5% Not responsible for grandchildrenAsian 59 100.0% Not responsible for grandchildrenWhite alone, not Hispanic / Latino 71 39.4% Responsible for grandchildren109 60.6% Not responsible for grandchildren