Races in Elmont, New York (NY) Detailed Stats
Data:
Races - White alone (%)
Races - White alone (% change since 2000)
Races - Black alone (%)
Races - Black alone (% change since 2000)
Races - American Indian alone (%)
Races - American Indian alone (% change since 2000)
Races - Asian alone (%)
Races - Asian alone (% change since 2000)
Races - Hispanic (%)
Races - Hispanic (% change since 2000)
Races - Native Hawaiian and Other Pacific Islander alone (%)
Races - Native Hawaiian and Other Pacific Islander alone (% change since 2000)
Races - Two or more races(%)
Races - Two or more races(% change since 2000)
Races - Other race alone (%)
Races - Other race alone (% change since 2000)
Racial diversity
Place of birth - Born in state of residence (%)
Place of birth - Born in state of residence (%) - White
Place of birth - Born in state of residence (%) - Black or African American
Place of birth - Born in state of residence (%) - Asian
Place of birth - Born in state of residence (%) - Hispanic or Latino
Place of birth - Born in state of residence (%) - American Indian and Alaska Native
Place of birth - Born in state of residence (%) - Multirace
Place of birth - Born in state of residence (%) - Other Race
Place of birth - Born in other state (%)
Place of birth - Born in other state (%) - White
Place of birth - Born in other state (%) - Black or African American
Place of birth - Born in other state (%) - Asian
Place of birth - Born in other state (%) - Hispanic or Latino
Place of birth - Born in other state (%) - American Indian and Alaska Native
Place of birth - Born in other state (%) - Multirace
Place of birth - Born in other state (%) - Other Race
Place of birth - Native, outside of US (%)
Place of birth - Native, outside of US (%) - White
Place of birth - Native, outside of US (%) - Black or African American
Place of birth - Native, outside of US (%) - Asian
Place of birth - Native, outside of US (%) - Hispanic or Latino
Place of birth - Native, outside of US (%) - American Indian and Alaska Native
Place of birth - Native, outside of US (%) - Multirace
Place of birth - Native, outside of US (%) - Other Race
Place of birth - Foreign born (%)
Place of birth - Foreign born (%) - White
Place of birth - Foreign born (%) - Black or African American
Place of birth - Foreign born (%) - Asian
Place of birth - Foreign born (%) - Hispanic or Latino
Place of birth - Foreign born (%) - American Indian and Alaska Native
Place of birth - Foreign born (%) - Multirace
Place of birth - Foreign born (%) - Other Race
Residents speaking English at home (%)
Residents speaking English at home - Born in the United States (%)
Residents speaking English at home - Native, born elsewhere (%)
Residents speaking English at home - Foreign born (%)
Residents speaking Spanish at home (%)
Residents speaking Spanish at home - Born in the United States (%)
Residents speaking Spanish at home - Native, born elsewhere (%)
Residents speaking Spanish at home - Foreign born (%)
Residents speaking other language at home (%)
Residents speaking other language at home - Born in the United States (%)
Residents speaking other language at home - Native, born elsewhere (%)
Residents speaking other language at home - Foreign born (%)
Marital status - Never married (%)
Marital status - Now married (%)
Marital status - Separated (%)
Marital status - Widowed (%)
Marital status - Divorced (%)
Ancestries Reported - Arab (%)
Ancestries Reported - Czech (%)
Ancestries Reported - Danish (%)
Ancestries Reported - Dutch (%)
Ancestries Reported - English (%)
Ancestries Reported - French (%)
Ancestries Reported - French Canadian (%)
Ancestries Reported - German (%)
Ancestries Reported - Greek (%)
Ancestries Reported - Hungarian (%)
Ancestries Reported - Irish (%)
Ancestries Reported - Italian (%)
Ancestries Reported - Lithuanian (%)
Ancestries Reported - Norwegian (%)
Ancestries Reported - Polish (%)
Ancestries Reported - Portuguese (%)
Ancestries Reported - Russian (%)
Ancestries Reported - Scotch-Irish (%)
Ancestries Reported - Scottish (%)
Ancestries Reported - Slovak (%)
Ancestries Reported - Subsaharan African (%)
Ancestries Reported - Swedish (%)
Ancestries Reported - Swiss (%)
Ancestries Reported - Ukrainian (%)
Ancestries Reported - United States (%)
Ancestries Reported - Welsh (%)
Ancestries Reported - West Indian (%)
Ancestries Reported - Other (%)
Geographical mobility - Same house 1 year ago (%)
Geographical mobility - Same house 1 year ago (%) - White
Geographical mobility - Same house 1 year ago (%) - Black or African American
Geographical mobility - Same house 1 year ago (%) - Asian
Geographical mobility - Same house 1 year ago (%) - Hispanic or Latino
Geographical mobility - Same house 1 year ago (%) - American Indian and Alaska Native
Geographical mobility - Same house 1 year ago (%) - Multirace
Geographical mobility - Same house 1 year ago (%) - Other Race
Geographical mobility - Moved within same county (%)
Geographical mobility - Moved within same county (%) - White
Geographical mobility - Moved within same county (%) - Black or African American
Geographical mobility - Moved within same county (%) - Asian
Geographical mobility - Moved within same county (%) - Hispanic or Latino
Geographical mobility - Moved within same county (%) - American Indian and Alaska Native
Geographical mobility - Moved within same county (%) - Multirace
Geographical mobility - Moved within same county (%) - Other Race
Geographical mobility - Moved from different county within same state (%)
Geographical mobility - Moved from different county within same state (%) - White
Geographical mobility - Moved from different county within same state (%) - Black or African American
Geographical mobility - Moved from different county within same state (%) - Asian
Geographical mobility - Moved from different county within same state (%) - Hispanic or Latino
Geographical mobility - Moved from different county within same state (%) - American Indian and Alaska Native
Geographical mobility - Moved from different county within same state (%) - Multirace
Geographical mobility - Moved from different county within same state (%) - Other Race
Geographical mobility - Moved from different state (%)
Geographical mobility - Moved from different state (%) - White
Geographical mobility - Moved from different state (%) - Black or African American
Geographical mobility - Moved from different state (%) - Asian
Geographical mobility - Moved from different state (%) - Hispanic or Latino
Geographical mobility - Moved from different state (%) - American Indian and Alaska Native
Geographical mobility - Moved from different state (%) - Multirace
Geographical mobility - Moved from different state (%) - Other Race
Geographical mobility - Moved from abroad (%)
Geographical mobility - Moved from abroad (%) - White
Geographical mobility - Moved from abroad (%) - Black or African American
Geographical mobility - Moved from abroad (%) - Asian
Geographical mobility - Moved from abroad (%) - Hispanic or Latino
Geographical mobility - Moved from abroad (%) - American Indian and Alaska Native
Geographical mobility - Moved from abroad (%) - Multirace
Geographical mobility - Moved from abroad (%) - Other Race
Place of birth for the foreign-born population - Ireland (%)
Place of birth for the foreign-born population - Denmark (%)
Place of birth for the foreign-born population - Norway (%)
Place of birth for the foreign-born population - Sweden (%)
Place of birth for the foreign-born population - United Kingdom (%)
Place of birth for the foreign-born population - England (%)
Place of birth for the foreign-born population - Scotland (%)
Place of birth for the foreign-born population - Other Northern Europe (%)
Place of birth for the foreign-born population - Austria (%)
Place of birth for the foreign-born population - Belgium (%)
Place of birth for the foreign-born population - France (%)
Place of birth for the foreign-born population - Germany (%)
Place of birth for the foreign-born population - Netherlands (%)
Place of birth for the foreign-born population - Switzerland (%)
Place of birth for the foreign-born population - Other Western Europe (%)
Place of birth for the foreign-born population - Greece (%)
Place of birth for the foreign-born population - Italy (%)
Place of birth for the foreign-born population - Portugal (%)
Place of birth for the foreign-born population - Spain (%)
Place of birth for the foreign-born population - Other Southern Europe (%)
Place of birth for the foreign-born population - Albania (%)
Place of birth for the foreign-born population - Belarus (%)
Place of birth for the foreign-born population - Bosnia and Herzegovina (%)
Place of birth for the foreign-born population - Bulgaria (%)
Place of birth for the foreign-born population - Croatia (%)
Place of birth for the foreign-born population - Czechoslovakia (%)
Place of birth for the foreign-born population - Hungary (%)
Place of birth for the foreign-born population - Latvia (%)
Place of birth for the foreign-born population - Lithuania (%)
Place of birth for the foreign-born population - North Macedonia (Macedonia) (%)
Place of birth for the foreign-born population - Moldova (%)
Place of birth for the foreign-born population - Poland (%)
Place of birth for the foreign-born population - Romania (%)
Place of birth for the foreign-born population - Russia (%)
Place of birth for the foreign-born population - Serbia (%)
Place of birth for the foreign-born population - Ukraine (%)
Place of birth for the foreign-born population - Other Eastern Europe (%)
Place of birth for the foreign-born population - China (%)
Place of birth for the foreign-born population - Hong Kong (%)
Place of birth for the foreign-born population - Taiwan (%)
Place of birth for the foreign-born population - Japan (%)
Place of birth for the foreign-born population - Korea (%)
Place of birth for the foreign-born population - Other Eastern Asia (%)
Place of birth for the foreign-born population - Afghanistan (%)
Place of birth for the foreign-born population - Bangladesh (%)
Place of birth for the foreign-born population - India (%)
Place of birth for the foreign-born population - Iran (%)
Place of birth for the foreign-born population - Kazakhstan (%)
Place of birth for the foreign-born population - Nepal (%)
Place of birth for the foreign-born population - Pakistan (%)
Place of birth for the foreign-born population - Sri Lanka (%)
Place of birth for the foreign-born population - Uzbekistan (%)
Place of birth for the foreign-born population - Other South Central Asia (%)
Place of birth for the foreign-born population - Burma (%)
Place of birth for the foreign-born population - Cambodia (%)
Place of birth for the foreign-born population - Indonesia (%)
Place of birth for the foreign-born population - Laos (%)
Place of birth for the foreign-born population - Malaysia (%)
Place of birth for the foreign-born population - Philippines (%)
Place of birth for the foreign-born population - Singapore (%)
Place of birth for the foreign-born population - Thailand (%)
Place of birth for the foreign-born population - Vietnam (%)
Place of birth for the foreign-born population - Other South Eastern Asia (%)
Place of birth for the foreign-born population - Armenia (%)
Place of birth for the foreign-born population - Iraq (%)
Place of birth for the foreign-born population - Israel (%)
Place of birth for the foreign-born population - Jordan (%)
Place of birth for the foreign-born population - Kuwait (%)
Place of birth for the foreign-born population - Lebanon (%)
Place of birth for the foreign-born population - Saudi Arabia (%)
Place of birth for the foreign-born population - Syria (%)
Place of birth for the foreign-born population - Turkey (%)
Place of birth for the foreign-born population - Yemen (%)
Place of birth for the foreign-born population - Other Western Asia (%)
Place of birth for the foreign-born population - Eritrea (%)
Place of birth for the foreign-born population - Ethiopia (%)
Place of birth for the foreign-born population - Kenya (%)
Place of birth for the foreign-born population - Somalia (%)
Place of birth for the foreign-born population - Uganda (%)
Place of birth for the foreign-born population - Zimbabwe (%)
Place of birth for the foreign-born population - Other Eastern Africa (%)
Place of birth for the foreign-born population - Cameroon (%)
Place of birth for the foreign-born population - Congo (%)
Place of birth for the foreign-born population - Democratic Republic of Congo (Zaire) (%)
Place of birth for the foreign-born population - Other Middle Africa (%)
Place of birth for the foreign-born population - Egypt (%)
Place of birth for the foreign-born population - Morocco (%)
Place of birth for the foreign-born population - Sudan (%)
Place of birth for the foreign-born population - Other Northern Africa (%)
Place of birth for the foreign-born population - South Africa (%)
Place of birth for the foreign-born population - Other Southern Africa (%)
Place of birth for the foreign-born population - Cabo Verde (%)
Place of birth for the foreign-born population - Ghana (%)
Place of birth for the foreign-born population - Liberia (%)
Place of birth for the foreign-born population - Nigeria (%)
Place of birth for the foreign-born population - Senegal (%)
Place of birth for the foreign-born population - Sierra Leone (%)
Place of birth for the foreign-born population - Other Western Africa (%)
Place of birth for the foreign-born population - Australia (%)
Place of birth for the foreign-born population - New Zealand (%)
Place of birth for the foreign-born population - Fiji (%)
Place of birth for the foreign-born population - Micronesia (%)
Place of birth for the foreign-born population - Bahamas (%)
Place of birth for the foreign-born population - Barbados (%)
Place of birth for the foreign-born population - Cuba (%)
Place of birth for the foreign-born population - Dominica (%)
Place of birth for the foreign-born population - Dominican Republic (%)
Place of birth for the foreign-born population - Grenada (%)
Place of birth for the foreign-born population - Haiti (%)
Place of birth for the foreign-born population - Jamaica (%)
Place of birth for the foreign-born population - St. Vincent and the Grenadines (%)
Place of birth for the foreign-born population - Trinidad and Tobago (%)
Place of birth for the foreign-born population - West Indies (%)
Place of birth for the foreign-born population - Other Caribbean (%)
Place of birth for the foreign-born population - Belize (%)
Place of birth for the foreign-born population - Costa Rica (%)
Place of birth for the foreign-born population - El Salvador (%)
Place of birth for the foreign-born population - Guatemala (%)
Place of birth for the foreign-born population - Honduras (%)
Place of birth for the foreign-born population - Mexico (%)
Place of birth for the foreign-born population - Nicaragua (%)
Place of birth for the foreign-born population - Panama (%)
Place of birth for the foreign-born population - Other Central America (%)
Place of birth for the foreign-born population - Argentina (%)
Place of birth for the foreign-born population - Bolivia (%)
Place of birth for the foreign-born population - Brazil (%)
Place of birth for the foreign-born population - Chile (%)
Place of birth for the foreign-born population - Colombia (%)
Place of birth for the foreign-born population - Ecuador (%)
Place of birth for the foreign-born population - Guyana (%)
Place of birth for the foreign-born population - Peru (%)
Place of birth for the foreign-born population - Uruguay (%)
Place of birth for the foreign-born population - Venezuela (%)
Place of birth for the foreign-born population - Other South America (%)
Place of birth for the foreign-born population - Canada (%)
Place of birth for the foreign-born population - Other Northern America (%)
Place of birth for the foreign-born population - Other (%)
Latest news about races in Elmont, NY collected exclusively by city-data.com from local newspapers, TV, and radio stations
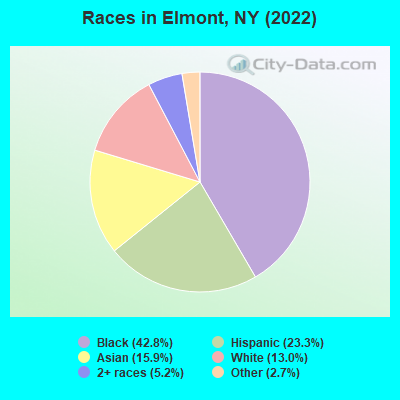
According to 2022 data, the most numerous races in Elmont, NY are White alone (4,910 residents), Hispanic (8,791 residents), and Black alone (16,138 residents). 53.4% of Elmont residents speak English at home. 43.9% of Elmont, NY residents are foreign-born (32.0% born in Latin America, 8.4% born in Asia), which is 49.9% greater than the foreign-born rate of 22.0% across the entire state of New York.
Race distribution in Elmont
2000 2022
12,631 38.7% White alone 10,902 33.4% Black alone 4,672 14.3% Hispanic 2,958 9.1% Asian alone 1,057 3.2% Two or more races 312 1.0% Other race alone 107 0.3% American Indian alone 18 0.06% Native Hawaiian and Other
16,138 42.8% Black alone 8,791 23.3% Hispanic 6,004 15.9% Asian alone 4,910 13.0% White alone 1,952 5.2% Two or more races 1,024 2.7% Other race alone
2000 2022
11,760,981 62.0% White alone 2,867,583 15.1% Hispanic 2,812,623 14.8% Black alone 1,035,926 5.5% Asian alone 366,116 1.9% Two or more races 75,499 0.4% Other race alone 52,499 0.3% American Indian alone 5,230 0.03% Native Hawaiian and Other
10,408,933 52.9% White alone 3,867,299 19.7% Hispanic 2,633,840 13.4% Black alone 1,776,286 9.0% Asian alone 732,670 3.7% Two or more races 216,110 1.1% Other race alone 35,082 0.2% American Indian alone 6,931 0.04% Native Hawaiian and Other
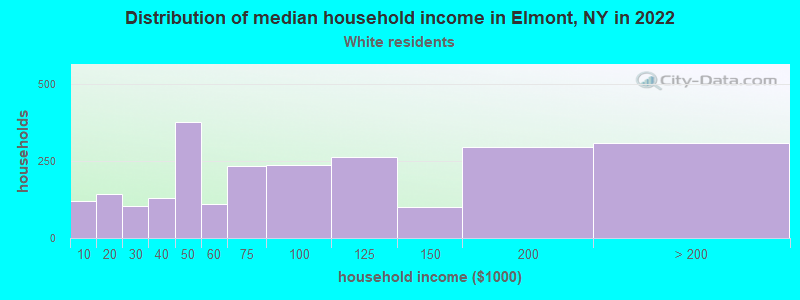
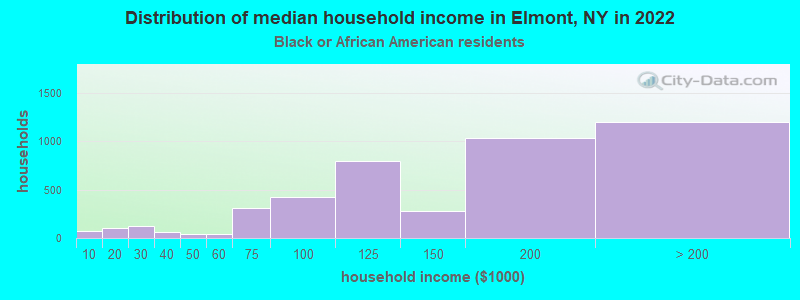
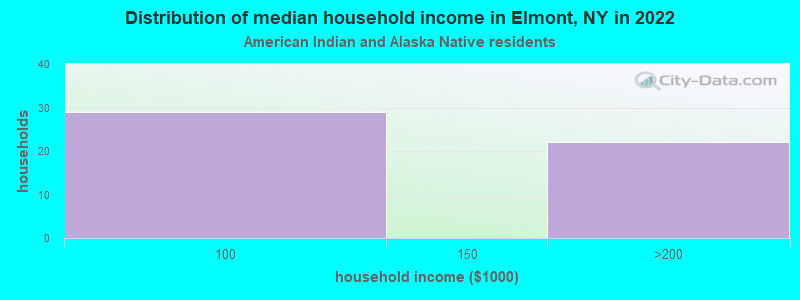
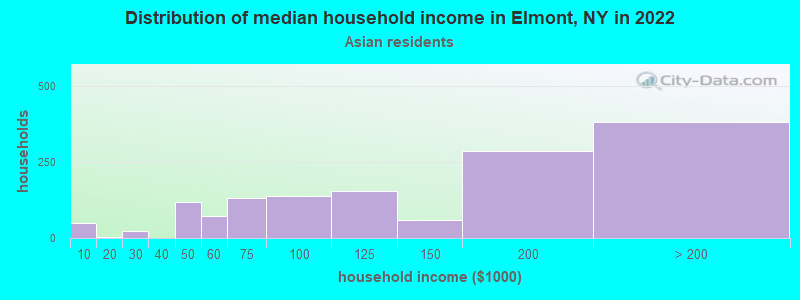
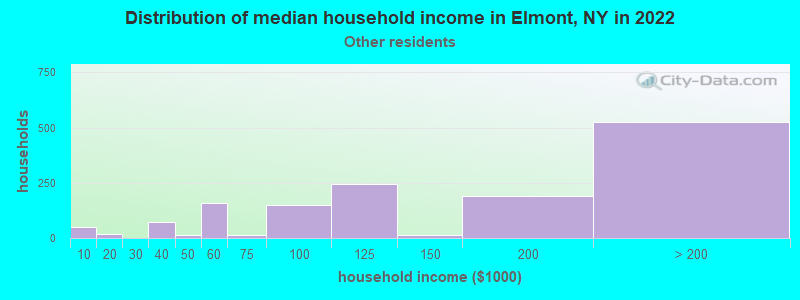
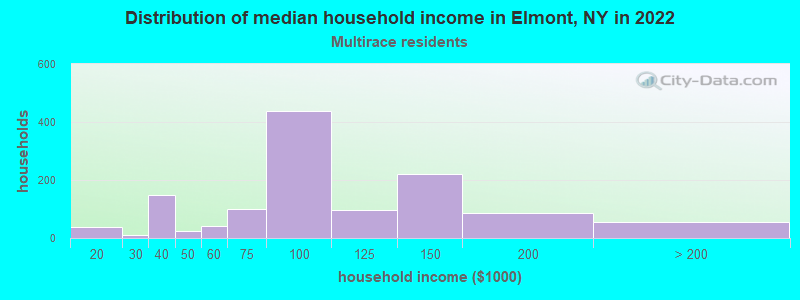
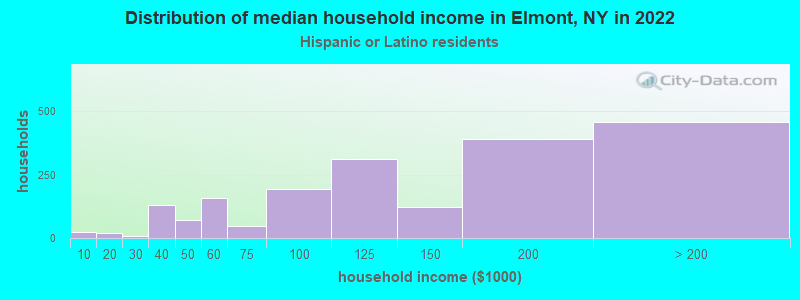
Income and house value in Elmont Median household income in 2022 $70,965 White non-Hispanic householders$154,709 Black householders$132,313 Asian householders$124,719 Some other race householders$94,224 Two or more races householders$123,076 Hispanic or Latino race householdersMedian 2022 house value $526,931 White Non-Hispanic householders$564,425 Black or African American householders$651,814 American Indian or Alaska Native householders $565,290 Asian householders$540,775 Native Hawaiian and other Pacific Islander householders$510,203 Some other race householders$548,274 Two or more races householders$566,155 Hispanic or Latino householders
Median age by race in Elmont
54.0 Median age for White residents50.7 56.5 38.2 Median age for Black or African American residents34.4 41.5 43.7 Median age for American Indian / Alaska Native residents31.4 32.8 35.8 Median age for Asian residents30.8 41.5 -487,992,314.6 Median age for Native Hawaiian / Pacific Islander residents-477,502,295.2 -497,387,669.3 40.7 Median age for Other race residents39.5 41.5 32.9 Median age for Two or more races residents31.4 33.7 57.3 Median age for White alone residents54.5 60.0 37.2 Median age for Hispanic or Latino residents36.9 38.1
Owner/renter occupied households by race in Elmont
House owners and renters - White residents 1,918 81.6% Owner occupied432 18.4% Renter occupiedHouse owners and renters - Black or African American residents 3,680 85.5% Owner occupied625 14.5% Renter occupiedHouse owners and renters - American Indian / Alaska Native residents 47 100.0% Owner occupiedHouse owners and renters - Asian residents 1,381 93.3% Owner occupied99 6.7% Renter occupiedHouse owners and renters - Other race residents 873 59.5% Owner occupied593 40.5% Renter occupiedHouse owners and renters - Two or more races residents 793 62.1% Owner occupied484 37.9% Renter occupiedHouse owners and renters - White alone residents 1,706 81.4% Owner occupied390 18.6% Renter occupiedHouse owners and renters - Hispanic or Latino residents 1,335 67.1% Owner occupied654 32.9% Renter occupied
Language usage in Elmont
English speakers - Total 53.4% of residents of Elmont speak English at home.
19.2% of residents speak Spanish at home 3,766 55.0% Speak English very well3,081 45.0% Speak English less than very well28.2% of residents speak other language at home 6,545 65.1% Speak English very well3,504 34.9% Speak English less than very well
English speakers - Born in the United States 77.9% of residents of Elmont speak English at home.
7.0% of residents speak Spanish at home 63 100.0% Speak English very well15.1% of residents speak other language at home 131 96.3% Speak English very well5 3.7% Speak English less than very well
English speakers - Native, born elsewhere 49.4% of residents of Elmont speak English at home.
40.7% of residents speak Spanish at home 184 58.0% Speak English very well133 42.0% Speak English less than very well7.7% of residents speak other language at home 60 100.0% Speak English very well
English speakers - Foreign-born 31.3% of residents of Elmont speak English at home.
23.1% of residents speak Spanish at home 1,212 30.9% Speak English very well2,715 69.1% Speak English less than very well45.1% of residents speak other language at home 4,405 57.4% Speak English very well3,263 42.6% Speak English less than very well
White (Caucasian) - Speak only English Native:
87.4% (4,334)Foreign-born:
15.2% (141)
White (Caucasian) - Speak another language Native:
11.2% (555)Foreign-born:
81.7% (757)
Black or African American - Speak only English Native:
80.1% (6,825)Foreign-born:
48.6% (3,553)
Black or African American - Speak another language Native:
20.7% (1,763)Foreign-born:
51.7% (3,782)
American Indian / Alaska Native - Speak another language Native:
100.0% (112)Foreign-born:
84.0% (59)
Asian - Speak only English Native:
41.6% (662)Foreign-born:
18.9% (771)
Asian - Speak another language Native:
57.8% (920)Foreign-born:
79.3% (3,229)
Other race - Speak only English Native:
28.0% (742)Foreign-born:
14.6% (494)
Other race - Speak another language Native:
70.1% (1,857)Foreign-born:
83.2% (2,820)
Two or more races - Speak only English Native:
72.9% (1,594)Foreign-born:
23.2% (356)
Two or more races - Speak another language Native:
25.4% (555)Foreign-born:
76.1% (1,170)
White alone - Speak only English Native:
96.4% (3,952)Foreign-born:
14.8% (99)
White alone - Speak another language Native:
3.7% (153)Foreign-born:
85.7% (575)
Hispanic or Latino - Speak only English Native:
35.7% (1,584)Foreign-born:
4.3% (172)
Hispanic or Latino - Speak another language Native:
64.6% (2,868)Foreign-born:
95.7% (3,805)
Foreign-born residents in Elmont 16,550 residents are foreign born (32.0% Latin America , 8.4% Asia ).
This city:
43.9%New York:
22.6%
Marital status for residents in Elmont Marital status - White (Caucasian) population 15 years and over
Males 42.6% Never married40.0% Now married1.1% Separated3.2% Widowed13.1% DivorcedFemales 35.3% Never married33.8% Now married3.1% Separated16.4% Widowed11.4% DivorcedWomen who gave birth in the past 12 months Now married:
92.1% (63)Unmarried:
7.9% (5)
Women who did not give birth in the past 12 months Now married:
12.8% (139)Unmarried:
87.2% (953)
Marital status - Black or African American population 15 years and over
Males 41.3% Never married51.0% Now married1.0% Separated1.3% Widowed5.4% DivorcedFemales 37.1% Never married45.6% Now married1.8% Separated5.9% Widowed9.5% DivorcedWomen who gave birth in the past 12 months Now married:
93.5% (243)Unmarried:
6.5% (17)
Women who did not give birth in the past 12 months Now married:
36.4% (1,336)Unmarried:
63.6% (2,336)
Marital status - American Indian / Alaska Native population 15 years and over
Males 48.6% Never married51.4% Now married0.0% Separated0.0% Widowed0.0% DivorcedFemales 33.7% Never married38.4% Now married15.1% Separated12.8% Widowed0.0% DivorcedWomen who did not give birth in the past 12 months Now married:
40.8% (29)Unmarried:
59.2% (41)
Marital status - Asian population 15 years and over
Males 43.4% Never married55.3% Now married0.0% Separated1.3% Widowed0.0% DivorcedFemales 26.3% Never married57.1% Now married0.7% Separated7.9% Widowed8.0% DivorcedWomen who gave birth in the past 12 months Now married:
100.0% (36)Unmarried:
0.0% (0)
Women who did not give birth in the past 12 months Now married:
46.7% (707)Unmarried:
53.3% (807)
Marital status - Other race population 15 years and over
Males 50.1% Never married43.8% Now married1.8% Separated1.3% Widowed2.9% DivorcedFemales 40.6% Never married42.4% Now married0.0% Separated11.2% Widowed5.7% DivorcedWomen who did not give birth in the past 12 months Now married:
30.5% (488)Unmarried:
69.5% (1,109)
Marital status - Two or more races population 15 years and over
Males 38.9% Never married56.3% Now married1.3% Separated0.0% Widowed3.5% DivorcedFemales 32.6% Never married50.8% Now married2.6% Separated5.1% Widowed8.7% DivorcedWomen who gave birth in the past 12 months Now married:
100.0% (493)Unmarried:
0.0% (0)
Women who did not give birth in the past 12 months Now married:
22.4% (189)Unmarried:
77.6% (653)
Marital status - White alone, not Hispanic / Latino population 15 years and over
Males 34.3% Never married44.7% Now married1.4% Separated4.2% Widowed15.4% DivorcedFemales 33.4% Never married36.5% Now married2.0% Separated18.6% Widowed9.5% DivorcedWomen who gave birth in the past 12 months Now married:
92.1% (67)Unmarried:
7.9% (6)
Women who did not give birth in the past 12 months Now married:
16.7% (140)Unmarried:
83.3% (698)
Marital status - Hispanic or Latino population 15 years and over
Males 52.5% Never married41.9% Now married1.5% Separated0.8% Widowed3.2% DivorcedFemales 43.0% Never married40.3% Now married1.8% Separated4.4% Widowed10.5% DivorcedWomen who gave birth in the past 12 months Now married:
0.0% (0)Unmarried:
100.0% (18)
Women who did not give birth in the past 12 months Now married:
27.4% (604)Unmarried:
72.6% (1,601)
Ancestries in Elmont
3,393 14.2% Haitian1,720 7.2% Jamaican1,288 5.4% Italian1,020 4.3% Guyanese950 4.0% British West Indian544 2.3% Nigerian477 2.0% Trinidadian and Tobagonian386 1.6% American364 1.5% West Indian226 0.9% Turkish220 0.9% Irish168 0.7% German160 0.7% African136 0.6% Barbadian103 0.4% Polish66 0.3% Czech45 0.2% Slovak41 0.2% Romanian30 0.1% English23 0.10% European21 0.09% Ukrainian20 0.08% French20 0.08% Zimbabwean15 0.06% Hungarian12 0.05% Russian10 0.04% Belizean9 0.04% Egyptian4 0.02% Swedish
Geographical mobility in Elmont Same house 1 year ago 5,510 91.1% White (Caucasian)15,610 94.0% Black or African American255 91.6% American Indian / Alaska Native5,495 91.7% Asian6,178 98.6% Other race4,086 97.7% Two or more races4,414 90.8% White alone, not Hispanic / Latino8,442 96.7% Hispanic or LatinoMoved within same county 374 6.2% White / Caucasian275 1.7% Black or African American10 3.5% American Indian / Alaska Native133 2.2% Asian19 0.3% Other race398 8.2% White alone, not Hispanic / Latino29 0.3% Hispanic or LatinoMoved within same state 143 2.4% White / Caucasian394 2.4% Black or African American16 5.8% American Indian / Alaska Native288 4.8% Asian37 0.6% Other race42 1.0% Two or more races27 0.6% White alone, not Hispanic / Latino170 1.9% Hispanic or LatinoMoved from different state 19 0.3% White / Caucasian52 0.3% Black or African American7 0.1% Asian19 0.4% White alone, not Hispanic / Latino7 0.1% Hispanic or LatinoMoved from abroad 93 0.6% Black or African American31 0.5% Asian16 0.4% Two or more races
Children Nativity (place of birth) in Elmont
Children under 6 years - Living with two parents Both parents native 371 100.0% NativeBoth parents foreign-born 769 93.2% Native56 6.8% Foreign-bornOne native, one foreign-born parent 359 100.0% NativeChildren under 6 years - Living with one parent Native parent 170 100.0% NativeForeign-born parent 347 82.8% Native72 17.2% Foreign-bornChildren 6 to 17 years - Living with two parents Both parents native 445 100.0% NativeBoth parents foreign-born 1,528 89.9% Native172 10.1% Foreign-bornOne native, one foreign-born parent 591 100.0% NativeChildren 6 to 17 years - Living with one parent Native parent 664 100.0% NativeForeign-born parent 937 51.2% Native894 48.8% Foreign-born
Place of birth for residents in Elmont 12,069 Americas11,998 Latin America6,847 Caribbean3,202 South America3,150 Asia2,194 South Central Asia1,948 Central America860 Africa472 South Eastern Asia470 Europe455 Western Africa349 Eastern Africa306 Eastern Europe248 Western Asia234 Eastern Asia201 China105 Southern Europe70 Northern America52 Northern Europe6 Northern Africa5 Western Europe3,332 Haiti1,893 Jamaica1,257 Guyana1,127 India1,087 El Salvador757 Pakistan734 Colombia662 Trinidad and Tobago595 Peru460 Philippines433 Honduras336 Nigeria318 Grenada288 Zimbabwe269 Mexico212 Bangladesh208 Ecuador201 China182 Turkey176 Dominican Republic164 Barbados155 Czechoslovakia117 Chile107 Guatemala107 Bahamas103 St. Vincent and the Grenadines91 Italy86 Venezuela85 Poland84 Argentina70 Canada65 Togo60 Tanzania52 Uruguay49 Romania42 Sri Lanka39 Saudi Arabia38 Ghana32 Korea30 Panama28 Afghanistan26 England25 Nepal25 United Kingdom24 St. Lucia20 Costa Rica15 Senegal13 Spain11 Indonesia10 Hungary6 Egypt5 Germany5 Cuba5 Ukraine
Grandparents responsible for own grandchildren in Elmont
Grandparents (30 to 59 years) White / Caucasian 14 41.4% Responsible for grandchildren19 58.6% Not responsible for grandchildrenBlack or African American 53 18.0% Responsible for grandchildren240 82.0% Not responsible for grandchildrenAsian 3 100.0% Not responsible for grandchildrenOther race 69 40.9% Responsible for grandchildren100 59.1% Not responsible for grandchildrenTwo or more races 12 100.0% Not responsible for grandchildrenWhite alone, not Hispanic / Latino 15 100.0% Responsible for grandchildrenHispanic or Latino 63 37.9% Responsible for grandchildren103 62.1% Not responsible for grandchildrenGrandparents (60 years and over) White / Caucasian 8 6.4% Responsible for grandchildren114 93.6% Not responsible for grandchildrenBlack or African American 131 12.3% Responsible for grandchildren936 87.7% Not responsible for grandchildrenAsian 262 100.0% Not responsible for grandchildrenOther race 220 100.0% Not responsible for grandchildrenTwo or more races 107 100.0% Not responsible for grandchildrenWhite alone, not Hispanic / Latino 76 100.0% Not responsible for grandchildrenHispanic or Latino 48 12.4% Responsible for grandchildren339 87.6% Not responsible for grandchildren