Races in Farmington, New Mexico (NM) Detailed Stats
Data:
Races - White alone (%)
Races - White alone (% change since 2000)
Races - Black alone (%)
Races - Black alone (% change since 2000)
Races - American Indian alone (%)
Races - American Indian alone (% change since 2000)
Races - Asian alone (%)
Races - Asian alone (% change since 2000)
Races - Hispanic (%)
Races - Hispanic (% change since 2000)
Races - Native Hawaiian and Other Pacific Islander alone (%)
Races - Native Hawaiian and Other Pacific Islander alone (% change since 2000)
Races - Two or more races(%)
Races - Two or more races(% change since 2000)
Races - Other race alone (%)
Races - Other race alone (% change since 2000)
Racial diversity
Place of birth - Born in state of residence (%)
Place of birth - Born in state of residence (%) - White
Place of birth - Born in state of residence (%) - Black or African American
Place of birth - Born in state of residence (%) - Asian
Place of birth - Born in state of residence (%) - Hispanic or Latino
Place of birth - Born in state of residence (%) - American Indian and Alaska Native
Place of birth - Born in state of residence (%) - Multirace
Place of birth - Born in state of residence (%) - Other Race
Place of birth - Born in other state (%)
Place of birth - Born in other state (%) - White
Place of birth - Born in other state (%) - Black or African American
Place of birth - Born in other state (%) - Asian
Place of birth - Born in other state (%) - Hispanic or Latino
Place of birth - Born in other state (%) - American Indian and Alaska Native
Place of birth - Born in other state (%) - Multirace
Place of birth - Born in other state (%) - Other Race
Place of birth - Native, outside of US (%)
Place of birth - Native, outside of US (%) - White
Place of birth - Native, outside of US (%) - Black or African American
Place of birth - Native, outside of US (%) - Asian
Place of birth - Native, outside of US (%) - Hispanic or Latino
Place of birth - Native, outside of US (%) - American Indian and Alaska Native
Place of birth - Native, outside of US (%) - Multirace
Place of birth - Native, outside of US (%) - Other Race
Place of birth - Foreign born (%)
Place of birth - Foreign born (%) - White
Place of birth - Foreign born (%) - Black or African American
Place of birth - Foreign born (%) - Asian
Place of birth - Foreign born (%) - Hispanic or Latino
Place of birth - Foreign born (%) - American Indian and Alaska Native
Place of birth - Foreign born (%) - Multirace
Place of birth - Foreign born (%) - Other Race
Residents speaking English at home (%)
Residents speaking English at home - Born in the United States (%)
Residents speaking English at home - Native, born elsewhere (%)
Residents speaking English at home - Foreign born (%)
Residents speaking Spanish at home (%)
Residents speaking Spanish at home - Born in the United States (%)
Residents speaking Spanish at home - Native, born elsewhere (%)
Residents speaking Spanish at home - Foreign born (%)
Residents speaking other language at home (%)
Residents speaking other language at home - Born in the United States (%)
Residents speaking other language at home - Native, born elsewhere (%)
Residents speaking other language at home - Foreign born (%)
Marital status - Never married (%)
Marital status - Now married (%)
Marital status - Separated (%)
Marital status - Widowed (%)
Marital status - Divorced (%)
Ancestries Reported - Arab (%)
Ancestries Reported - Czech (%)
Ancestries Reported - Danish (%)
Ancestries Reported - Dutch (%)
Ancestries Reported - English (%)
Ancestries Reported - French (%)
Ancestries Reported - French Canadian (%)
Ancestries Reported - German (%)
Ancestries Reported - Greek (%)
Ancestries Reported - Hungarian (%)
Ancestries Reported - Irish (%)
Ancestries Reported - Italian (%)
Ancestries Reported - Lithuanian (%)
Ancestries Reported - Norwegian (%)
Ancestries Reported - Polish (%)
Ancestries Reported - Portuguese (%)
Ancestries Reported - Russian (%)
Ancestries Reported - Scotch-Irish (%)
Ancestries Reported - Scottish (%)
Ancestries Reported - Slovak (%)
Ancestries Reported - Subsaharan African (%)
Ancestries Reported - Swedish (%)
Ancestries Reported - Swiss (%)
Ancestries Reported - Ukrainian (%)
Ancestries Reported - United States (%)
Ancestries Reported - Welsh (%)
Ancestries Reported - West Indian (%)
Ancestries Reported - Other (%)
Geographical mobility - Same house 1 year ago (%)
Geographical mobility - Same house 1 year ago (%) - White
Geographical mobility - Same house 1 year ago (%) - Black or African American
Geographical mobility - Same house 1 year ago (%) - Asian
Geographical mobility - Same house 1 year ago (%) - Hispanic or Latino
Geographical mobility - Same house 1 year ago (%) - American Indian and Alaska Native
Geographical mobility - Same house 1 year ago (%) - Multirace
Geographical mobility - Same house 1 year ago (%) - Other Race
Geographical mobility - Moved within same county (%)
Geographical mobility - Moved within same county (%) - White
Geographical mobility - Moved within same county (%) - Black or African American
Geographical mobility - Moved within same county (%) - Asian
Geographical mobility - Moved within same county (%) - Hispanic or Latino
Geographical mobility - Moved within same county (%) - American Indian and Alaska Native
Geographical mobility - Moved within same county (%) - Multirace
Geographical mobility - Moved within same county (%) - Other Race
Geographical mobility - Moved from different county within same state (%)
Geographical mobility - Moved from different county within same state (%) - White
Geographical mobility - Moved from different county within same state (%) - Black or African American
Geographical mobility - Moved from different county within same state (%) - Asian
Geographical mobility - Moved from different county within same state (%) - Hispanic or Latino
Geographical mobility - Moved from different county within same state (%) - American Indian and Alaska Native
Geographical mobility - Moved from different county within same state (%) - Multirace
Geographical mobility - Moved from different county within same state (%) - Other Race
Geographical mobility - Moved from different state (%)
Geographical mobility - Moved from different state (%) - White
Geographical mobility - Moved from different state (%) - Black or African American
Geographical mobility - Moved from different state (%) - Asian
Geographical mobility - Moved from different state (%) - Hispanic or Latino
Geographical mobility - Moved from different state (%) - American Indian and Alaska Native
Geographical mobility - Moved from different state (%) - Multirace
Geographical mobility - Moved from different state (%) - Other Race
Geographical mobility - Moved from abroad (%)
Geographical mobility - Moved from abroad (%) - White
Geographical mobility - Moved from abroad (%) - Black or African American
Geographical mobility - Moved from abroad (%) - Asian
Geographical mobility - Moved from abroad (%) - Hispanic or Latino
Geographical mobility - Moved from abroad (%) - American Indian and Alaska Native
Geographical mobility - Moved from abroad (%) - Multirace
Geographical mobility - Moved from abroad (%) - Other Race
Place of birth for the foreign-born population - Ireland (%)
Place of birth for the foreign-born population - Denmark (%)
Place of birth for the foreign-born population - Norway (%)
Place of birth for the foreign-born population - Sweden (%)
Place of birth for the foreign-born population - United Kingdom (%)
Place of birth for the foreign-born population - England (%)
Place of birth for the foreign-born population - Scotland (%)
Place of birth for the foreign-born population - Other Northern Europe (%)
Place of birth for the foreign-born population - Austria (%)
Place of birth for the foreign-born population - Belgium (%)
Place of birth for the foreign-born population - France (%)
Place of birth for the foreign-born population - Germany (%)
Place of birth for the foreign-born population - Netherlands (%)
Place of birth for the foreign-born population - Switzerland (%)
Place of birth for the foreign-born population - Other Western Europe (%)
Place of birth for the foreign-born population - Greece (%)
Place of birth for the foreign-born population - Italy (%)
Place of birth for the foreign-born population - Portugal (%)
Place of birth for the foreign-born population - Spain (%)
Place of birth for the foreign-born population - Other Southern Europe (%)
Place of birth for the foreign-born population - Albania (%)
Place of birth for the foreign-born population - Belarus (%)
Place of birth for the foreign-born population - Bosnia and Herzegovina (%)
Place of birth for the foreign-born population - Bulgaria (%)
Place of birth for the foreign-born population - Croatia (%)
Place of birth for the foreign-born population - Czechoslovakia (%)
Place of birth for the foreign-born population - Hungary (%)
Place of birth for the foreign-born population - Latvia (%)
Place of birth for the foreign-born population - Lithuania (%)
Place of birth for the foreign-born population - North Macedonia (Macedonia) (%)
Place of birth for the foreign-born population - Moldova (%)
Place of birth for the foreign-born population - Poland (%)
Place of birth for the foreign-born population - Romania (%)
Place of birth for the foreign-born population - Russia (%)
Place of birth for the foreign-born population - Serbia (%)
Place of birth for the foreign-born population - Ukraine (%)
Place of birth for the foreign-born population - Other Eastern Europe (%)
Place of birth for the foreign-born population - China (%)
Place of birth for the foreign-born population - Hong Kong (%)
Place of birth for the foreign-born population - Taiwan (%)
Place of birth for the foreign-born population - Japan (%)
Place of birth for the foreign-born population - Korea (%)
Place of birth for the foreign-born population - Other Eastern Asia (%)
Place of birth for the foreign-born population - Afghanistan (%)
Place of birth for the foreign-born population - Bangladesh (%)
Place of birth for the foreign-born population - India (%)
Place of birth for the foreign-born population - Iran (%)
Place of birth for the foreign-born population - Kazakhstan (%)
Place of birth for the foreign-born population - Nepal (%)
Place of birth for the foreign-born population - Pakistan (%)
Place of birth for the foreign-born population - Sri Lanka (%)
Place of birth for the foreign-born population - Uzbekistan (%)
Place of birth for the foreign-born population - Other South Central Asia (%)
Place of birth for the foreign-born population - Burma (%)
Place of birth for the foreign-born population - Cambodia (%)
Place of birth for the foreign-born population - Indonesia (%)
Place of birth for the foreign-born population - Laos (%)
Place of birth for the foreign-born population - Malaysia (%)
Place of birth for the foreign-born population - Philippines (%)
Place of birth for the foreign-born population - Singapore (%)
Place of birth for the foreign-born population - Thailand (%)
Place of birth for the foreign-born population - Vietnam (%)
Place of birth for the foreign-born population - Other South Eastern Asia (%)
Place of birth for the foreign-born population - Armenia (%)
Place of birth for the foreign-born population - Iraq (%)
Place of birth for the foreign-born population - Israel (%)
Place of birth for the foreign-born population - Jordan (%)
Place of birth for the foreign-born population - Kuwait (%)
Place of birth for the foreign-born population - Lebanon (%)
Place of birth for the foreign-born population - Saudi Arabia (%)
Place of birth for the foreign-born population - Syria (%)
Place of birth for the foreign-born population - Turkey (%)
Place of birth for the foreign-born population - Yemen (%)
Place of birth for the foreign-born population - Other Western Asia (%)
Place of birth for the foreign-born population - Eritrea (%)
Place of birth for the foreign-born population - Ethiopia (%)
Place of birth for the foreign-born population - Kenya (%)
Place of birth for the foreign-born population - Somalia (%)
Place of birth for the foreign-born population - Uganda (%)
Place of birth for the foreign-born population - Zimbabwe (%)
Place of birth for the foreign-born population - Other Eastern Africa (%)
Place of birth for the foreign-born population - Cameroon (%)
Place of birth for the foreign-born population - Congo (%)
Place of birth for the foreign-born population - Democratic Republic of Congo (Zaire) (%)
Place of birth for the foreign-born population - Other Middle Africa (%)
Place of birth for the foreign-born population - Egypt (%)
Place of birth for the foreign-born population - Morocco (%)
Place of birth for the foreign-born population - Sudan (%)
Place of birth for the foreign-born population - Other Northern Africa (%)
Place of birth for the foreign-born population - South Africa (%)
Place of birth for the foreign-born population - Other Southern Africa (%)
Place of birth for the foreign-born population - Cabo Verde (%)
Place of birth for the foreign-born population - Ghana (%)
Place of birth for the foreign-born population - Liberia (%)
Place of birth for the foreign-born population - Nigeria (%)
Place of birth for the foreign-born population - Senegal (%)
Place of birth for the foreign-born population - Sierra Leone (%)
Place of birth for the foreign-born population - Other Western Africa (%)
Place of birth for the foreign-born population - Australia (%)
Place of birth for the foreign-born population - New Zealand (%)
Place of birth for the foreign-born population - Fiji (%)
Place of birth for the foreign-born population - Micronesia (%)
Place of birth for the foreign-born population - Bahamas (%)
Place of birth for the foreign-born population - Barbados (%)
Place of birth for the foreign-born population - Cuba (%)
Place of birth for the foreign-born population - Dominica (%)
Place of birth for the foreign-born population - Dominican Republic (%)
Place of birth for the foreign-born population - Grenada (%)
Place of birth for the foreign-born population - Haiti (%)
Place of birth for the foreign-born population - Jamaica (%)
Place of birth for the foreign-born population - St. Vincent and the Grenadines (%)
Place of birth for the foreign-born population - Trinidad and Tobago (%)
Place of birth for the foreign-born population - West Indies (%)
Place of birth for the foreign-born population - Other Caribbean (%)
Place of birth for the foreign-born population - Belize (%)
Place of birth for the foreign-born population - Costa Rica (%)
Place of birth for the foreign-born population - El Salvador (%)
Place of birth for the foreign-born population - Guatemala (%)
Place of birth for the foreign-born population - Honduras (%)
Place of birth for the foreign-born population - Mexico (%)
Place of birth for the foreign-born population - Nicaragua (%)
Place of birth for the foreign-born population - Panama (%)
Place of birth for the foreign-born population - Other Central America (%)
Place of birth for the foreign-born population - Argentina (%)
Place of birth for the foreign-born population - Bolivia (%)
Place of birth for the foreign-born population - Brazil (%)
Place of birth for the foreign-born population - Chile (%)
Place of birth for the foreign-born population - Colombia (%)
Place of birth for the foreign-born population - Ecuador (%)
Place of birth for the foreign-born population - Guyana (%)
Place of birth for the foreign-born population - Peru (%)
Place of birth for the foreign-born population - Uruguay (%)
Place of birth for the foreign-born population - Venezuela (%)
Place of birth for the foreign-born population - Other South America (%)
Place of birth for the foreign-born population - Canada (%)
Place of birth for the foreign-born population - Other Northern America (%)
Place of birth for the foreign-born population - Other (%)
Latest news about races in Farmington, NM collected exclusively by city-data.com from local newspapers, TV, and radio stations
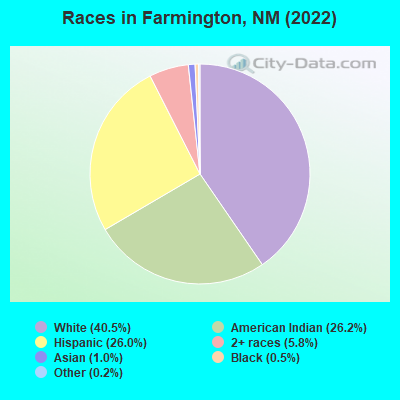
According to 2022 data, the most numerous races in Farmington, NM are Hispanic (11,945 residents), White alone (18,620 residents), and American Indian alone (12,050 residents). 78.9% of Farmington residents speak English at home. 3.0% of Farmington, NM residents are foreign-born (1.7% born in Latin America, 0.8% born in Asia), which is 200.9% less than the foreign-born rate of 9.0% across the entire state of New Mexico.
Race distribution in Farmington
2000 2022
813,495 44.7% White alone 765,386 42.1% Hispanic 161,460 8.9% American Indian alone 30,654 1.7% Black alone 25,793 1.4% Two or more races 18,257 1.0% Asian alone 3,009 0.2% Other race alone 992 0.05% Native Hawaiian and Other
1,059,867 50.2% Hispanic 735,478 34.8% White alone 171,808 8.1% American Indian alone 65,084 3.1% Two or more races 36,870 1.7% Black alone 35,870 1.7% Asian alone 7,582 0.4% Other race alone 785 0.04% Native Hawaiian and Other
Income and house value in Farmington Median household income in 2022 $66,184 White non-Hispanic householders$50,998 American Indian and Alaska Native householders$70,514 Asian householders$48,501 Some other race householders$65,704 Two or more races householders$44,295 Hispanic or Latino race householdersMedian 2022 house value $272,729 White Non-Hispanic householders$241,795 Black or African American householders$210,862 American Indian or Alaska Native householders $204,417 Asian householders$231,484 Some other race householders$243,858 Two or more races householders$231,742 Hispanic or Latino householders
Median age by race in Farmington
43.5 Median age for White residents44.7 43.3 20.6 Median age for Black or African American residents41.3 20.6 27.4 Median age for American Indian / Alaska Native residents28.4 26.7 29.1 Median age for Asian residents20.7 32.8 -658,511,722.1 Median age for Native Hawaiian / Pacific Islander residents-666,666,666.0 -659,380,691.5 37.3 Median age for Other race residents30.8 46.2 23.6 Median age for Two or more races residents29.5 17.0 46.8 Median age for White alone residents47.5 46.7 24.7 Median age for Hispanic or Latino residents26.8 23.9
Owner/renter occupied households by race in Farmington
House owners and renters - White residents 6,368 73.9% Owner occupied2,253 26.1% Renter occupiedHouse owners and renters - Black or African American residents 13 12.8% Owner occupied89 87.2% Renter occupiedHouse owners and renters - American Indian / Alaska Native residents 1,354 35.0% Owner occupied2,510 65.0% Renter occupiedHouse owners and renters - Asian residents 33 31.4% Owner occupied73 68.6% Renter occupiedHouse owners and renters - Other race residents 1,352 84.5% Owner occupied248 15.5% Renter occupiedHouse owners and renters - Two or more races residents 1,263 84.9% Owner occupied225 15.1% Renter occupiedHouse owners and renters - White alone residents 6,033 75.1% Owner occupied2,005 24.9% Renter occupiedHouse owners and renters - Hispanic or Latino residents 2,298 75.4% Owner occupied751 24.6% Renter occupied
Language usage in Farmington
English speakers - Total 78.9% of residents of Farmington speak English at home.
8.3% of residents speak Spanish at home 1,728 48.4% Speak English very well1,839 51.6% Speak English less than very well12.0% of residents speak other language at home 3,323 64.8% Speak English very well1,807 35.2% Speak English less than very well
English speakers - Born in the United States 86.7% of residents of Farmington speak English at home.
6.2% of residents speak Spanish at home 961 86.7% Speak English very well148 13.3% Speak English less than very well10.0% of residents speak other language at home 841 47.1% Speak English very well946 52.9% Speak English less than very well
English speakers - Native, born elsewhere 62.3% of residents of Farmington speak English at home.
66.5% of residents speak Spanish at home 64 40.8% Speak English very well93 59.2% Speak English less than very well1.3% of residents speak other language at home 3 100.0% Speak English less than very well
English speakers - Foreign-born 12.4% of residents of Farmington speak English at home.
66.0% of residents speak Spanish at home 225 23.0% Speak English very well753 77.0% Speak English less than very well19.1% of residents speak other language at home 221 78.1% Speak English very well62 21.9% Speak English less than very well
White (Caucasian) - Speak only English Native:
98.4% (19,461)Foreign-born:
56.7% (167)
White (Caucasian) - Speak another language Native:
4.3% (858)Foreign-born:
49.3% (145)
American Indian / Alaska Native - Speak another language Native:
40.5% (4,831)Foreign-born:
100.0% (144)
Asian - Speak only English Native:
80.5% (101)Foreign-born:
12.7% (36)
Asian - Speak another language Native:
19.9% (25)Foreign-born:
86.8% (247)
Other race - Speak another language Native:
55.3% (1,897)Foreign-born:
100.0% (539)
Two or more races - Speak only English Native:
89.9% (5,287)Foreign-born:
2.5% (4)
Two or more races - Speak another language Native:
11.4% (671)Foreign-born:
100.0% (148)
White alone - Speak only English Native:
98.7% (17,555)Foreign-born:
46.4% (127)
White alone - Speak another language Native:
1.4% (249)Foreign-born:
48.6% (133)
Hispanic or Latino - Speak only English Native:
70.2% (6,796)Foreign-born:
2.6% (27)
Hispanic or Latino - Speak another language Native:
30.1% (2,916)Foreign-born:
97.7% (988)
Foreign-born residents in Farmington 1,374 residents are foreign born (1.7% Latin America , 0.8% Asia ).
This city:
3.0%New Mexico:
9.2%
Marital status for residents in Farmington Marital status - White (Caucasian) population 15 years and over
Males 31.3% Never married52.8% Now married0.1% Separated5.3% Widowed10.5% DivorcedFemales 21.2% Never married52.3% Now married0.7% Separated8.4% Widowed17.4% DivorcedWomen who gave birth in the past 12 months Now married:
73.6% (207)Unmarried:
26.4% (74)
Women who did not give birth in the past 12 months Now married:
48.7% (1,960)Unmarried:
51.3% (2,069)
Marital status - Black or African American population 15 years and over
Males 54.4% Never married0.0% Now married15.2% Separated0.0% Widowed30.4% DivorcedFemales 90.4% Never married0.0% Now married8.7% Separated0.0% Widowed0.9% DivorcedWomen who did not give birth in the past 12 months Now married:
11.5% (10)Unmarried:
88.5% (76)
Marital status - American Indian / Alaska Native population 15 years and over
Males 50.1% Never married36.8% Now married3.5% Separated1.2% Widowed8.4% DivorcedFemales 55.6% Never married30.9% Now married0.3% Separated5.7% Widowed7.5% DivorcedWomen who gave birth in the past 12 months Now married:
47.4% (149)Unmarried:
52.6% (166)
Women who did not give birth in the past 12 months Now married:
30.3% (1,202)Unmarried:
69.7% (2,769)
Marital status - Asian population 15 years and over
Males 48.7% Never married51.3% Now married0.0% Separated0.0% Widowed0.0% DivorcedFemales 31.4% Never married44.5% Now married0.0% Separated0.0% Widowed24.1% DivorcedWomen who gave birth in the past 12 months Now married:
32.1% (11)Unmarried:
67.9% (23)
Women who did not give birth in the past 12 months Now married:
32.9% (55)Unmarried:
67.1% (113)
Marital status - Other race population 15 years and over
Males 49.4% Never married32.1% Now married0.6% Separated0.9% Widowed17.0% DivorcedFemales 35.2% Never married27.1% Now married0.0% Separated21.3% Widowed16.4% DivorcedWomen who gave birth in the past 12 months Now married:
100.0% (48)Unmarried:
0.0% (0)
Women who did not give birth in the past 12 months Now married:
17.3% (123)Unmarried:
82.7% (587)
Marital status - Two or more races population 15 years and over
Males 49.1% Never married36.7% Now married1.3% Separated1.3% Widowed11.6% DivorcedFemales 41.2% Never married47.0% Now married1.0% Separated3.8% Widowed7.1% DivorcedWomen who gave birth in the past 12 months Now married:
96.2% (269)Unmarried:
3.8% (11)
Women who did not give birth in the past 12 months Now married:
28.5% (388)Unmarried:
71.5% (975)
Marital status - White alone, not Hispanic / Latino population 15 years and over
Males 26.5% Never married57.1% Now married0.0% Separated5.9% Widowed10.5% DivorcedFemales 17.7% Never married56.3% Now married0.6% Separated9.4% Widowed16.0% DivorcedWomen who gave birth in the past 12 months Now married:
92.7% (236)Unmarried:
7.3% (19)
Women who did not give birth in the past 12 months Now married:
54.0% (1,941)Unmarried:
46.0% (1,651)
Marital status - Hispanic or Latino population 15 years and over
Males 53.5% Never married31.9% Now married1.0% Separated1.3% Widowed12.3% DivorcedFemales 40.2% Never married35.2% Now married0.9% Separated7.5% Widowed16.2% DivorcedWomen who gave birth in the past 12 months Now married:
75.1% (273)Unmarried:
24.9% (90)
Women who did not give birth in the past 12 months Now married:
24.9% (616)Unmarried:
75.1% (1,860)
Ancestries in Farmington
1,450 5.0% European1,127 3.9% English964 3.3% German880 3.0% American761 2.6% Irish288 1.0% Scottish158 0.5% Norwegian116 0.4% Italian105 0.4% French96 0.3% Welsh62 0.2% Dutch56 0.2% Northern European52 0.2% Swedish49 0.2% Danish49 0.2% Eastern European40 0.1% Lithuanian37 0.1% Polish32 0.1% Basque32 0.1% Scotch-Irish28 0.10% Hungarian26 0.09% Scandinavian24 0.08% Austrian24 0.08% Czech23 0.08% Canadian23 0.08% Turkish22 0.08% Ukrainian20 0.07% British14 0.05% Belgian14 0.05% Czechoslovakian14 0.05% French Canadian13 0.04% Russian13 0.04% Finnish12 0.04% Estonian11 0.04% Portuguese10 0.03% Greek10 0.03% Yugoslavian9 0.03% Pennsylvania German8 0.03% Slovene7 0.02% Swiss4 0.01% Slovak3 0.01% Iranian
Geographical mobility in Farmington Same house 1 year ago 18,829 90.2% White (Caucasian)241 70.6% Black or African American11,484 88.5% American Indian / Alaska Native490 89.5% Asian17 100.0% Native Hawaiian / Pacific Islander3,795 90.6% Other race5,529 82.4% Two or more races16,768 90.6% White alone, not Hispanic / Latino10,136 86.3% Hispanic or LatinoMoved within same county 1,160 5.6% White / Caucasian36 10.4% Black or African American858 6.6% American Indian / Alaska Native58 1.4% Other race1,078 16.1% Two or more races904 4.9% White alone, not Hispanic / Latino1,018 8.7% Hispanic or LatinoMoved within same state 439 2.1% White / Caucasian63 18.4% Black or African American261 2.0% American Indian / Alaska Native30 5.5% Asian96 2.3% Other race310 4.6% Two or more races340 1.8% White alone, not Hispanic / Latino257 2.2% Hispanic or LatinoMoved from different state 358 1.7% White / Caucasian16 4.6% Black or African American253 1.9% American Indian / Alaska Native12 2.1% Asian171 4.1% Other race109 1.6% Two or more races357 1.9% White alone, not Hispanic / Latino449 3.8% Hispanic or LatinoMoved from abroad 51 0.2% White116 0.9% American Indian / Alaska Native24 4.3% Asian52 0.3% White alone, not Hispanic / Latino112 1.0% Hispanic or Latino
Children Nativity (place of birth) in Farmington
Children under 6 years - Living with two parents Both parents native 1,988 100.0% NativeBoth parents foreign-born 64 63.8% Native36 36.2% Foreign-bornOne native, one foreign-born parent 45 100.0% NativeChildren under 6 years - Living with one parent Native parent 1,225 100.0% NativeForeign-born parent 92 75.3% Native30 24.7% Foreign-bornChildren 6 to 17 years - Living with two parents Both parents native 4,475 100.0% NativeBoth parents foreign-born 176 100.0% NativeOne native, one foreign-born parent 120 100.0% NativeChildren 6 to 17 years - Living with one parent Native parent 3,821 100.0% NativeForeign-born parent 112 49.7% Native114 50.3% Foreign-born
Grandparents responsible for own grandchildren in Farmington
Grandparents (30 to 59 years) White / Caucasian 31 90.9% Responsible for grandchildren3 9.1% Not responsible for grandchildrenAmerican Indian / Alaska Native 109 66.2% Responsible for grandchildren56 33.8% Not responsible for grandchildrenAsian 24 100.0% Not responsible for grandchildrenOther race 74 100.0% Not responsible for grandchildrenTwo or more races 9 60.7% Responsible for grandchildren6 39.3% Not responsible for grandchildrenWhite alone, not Hispanic / Latino 26 100.0% Responsible for grandchildrenHispanic or Latino 7 13.1% Responsible for grandchildren44 86.9% Not responsible for grandchildrenGrandparents (60 years and over) White / Caucasian 83 44.7% Responsible for grandchildren103 55.3% Not responsible for grandchildrenAmerican Indian / Alaska Native 81 47.5% Responsible for grandchildren90 52.5% Not responsible for grandchildrenOther race 113 100.0% Responsible for grandchildrenTwo or more races 6 100.0% Responsible for grandchildrenWhite alone, not Hispanic / Latino 30 27.6% Responsible for grandchildren79 72.4% Not responsible for grandchildrenHispanic or Latino 181 71.6% Responsible for grandchildren72 28.4% Not responsible for grandchildren