Races in Four Corners, Maryland (MD) Detailed Stats
Data:
Races - White alone (%)
Races - White alone (% change since 2000)
Races - Black alone (%)
Races - Black alone (% change since 2000)
Races - American Indian alone (%)
Races - American Indian alone (% change since 2000)
Races - Asian alone (%)
Races - Asian alone (% change since 2000)
Races - Hispanic (%)
Races - Hispanic (% change since 2000)
Races - Native Hawaiian and Other Pacific Islander alone (%)
Races - Native Hawaiian and Other Pacific Islander alone (% change since 2000)
Races - Two or more races(%)
Races - Two or more races(% change since 2000)
Races - Other race alone (%)
Races - Other race alone (% change since 2000)
Racial diversity
Place of birth - Born in state of residence (%)
Place of birth - Born in state of residence (%) - White
Place of birth - Born in state of residence (%) - Black or African American
Place of birth - Born in state of residence (%) - Asian
Place of birth - Born in state of residence (%) - Hispanic or Latino
Place of birth - Born in state of residence (%) - American Indian and Alaska Native
Place of birth - Born in state of residence (%) - Multirace
Place of birth - Born in state of residence (%) - Other Race
Place of birth - Born in other state (%)
Place of birth - Born in other state (%) - White
Place of birth - Born in other state (%) - Black or African American
Place of birth - Born in other state (%) - Asian
Place of birth - Born in other state (%) - Hispanic or Latino
Place of birth - Born in other state (%) - American Indian and Alaska Native
Place of birth - Born in other state (%) - Multirace
Place of birth - Born in other state (%) - Other Race
Place of birth - Native, outside of US (%)
Place of birth - Native, outside of US (%) - White
Place of birth - Native, outside of US (%) - Black or African American
Place of birth - Native, outside of US (%) - Asian
Place of birth - Native, outside of US (%) - Hispanic or Latino
Place of birth - Native, outside of US (%) - American Indian and Alaska Native
Place of birth - Native, outside of US (%) - Multirace
Place of birth - Native, outside of US (%) - Other Race
Place of birth - Foreign born (%)
Place of birth - Foreign born (%) - White
Place of birth - Foreign born (%) - Black or African American
Place of birth - Foreign born (%) - Asian
Place of birth - Foreign born (%) - Hispanic or Latino
Place of birth - Foreign born (%) - American Indian and Alaska Native
Place of birth - Foreign born (%) - Multirace
Place of birth - Foreign born (%) - Other Race
Residents speaking English at home (%)
Residents speaking English at home - Born in the United States (%)
Residents speaking English at home - Native, born elsewhere (%)
Residents speaking English at home - Foreign born (%)
Residents speaking Spanish at home (%)
Residents speaking Spanish at home - Born in the United States (%)
Residents speaking Spanish at home - Native, born elsewhere (%)
Residents speaking Spanish at home - Foreign born (%)
Residents speaking other language at home (%)
Residents speaking other language at home - Born in the United States (%)
Residents speaking other language at home - Native, born elsewhere (%)
Residents speaking other language at home - Foreign born (%)
Marital status - Never married (%)
Marital status - Now married (%)
Marital status - Separated (%)
Marital status - Widowed (%)
Marital status - Divorced (%)
Ancestries Reported - Arab (%)
Ancestries Reported - Czech (%)
Ancestries Reported - Danish (%)
Ancestries Reported - Dutch (%)
Ancestries Reported - English (%)
Ancestries Reported - French (%)
Ancestries Reported - French Canadian (%)
Ancestries Reported - German (%)
Ancestries Reported - Greek (%)
Ancestries Reported - Hungarian (%)
Ancestries Reported - Irish (%)
Ancestries Reported - Italian (%)
Ancestries Reported - Lithuanian (%)
Ancestries Reported - Norwegian (%)
Ancestries Reported - Polish (%)
Ancestries Reported - Portuguese (%)
Ancestries Reported - Russian (%)
Ancestries Reported - Scotch-Irish (%)
Ancestries Reported - Scottish (%)
Ancestries Reported - Slovak (%)
Ancestries Reported - Subsaharan African (%)
Ancestries Reported - Swedish (%)
Ancestries Reported - Swiss (%)
Ancestries Reported - Ukrainian (%)
Ancestries Reported - United States (%)
Ancestries Reported - Welsh (%)
Ancestries Reported - West Indian (%)
Ancestries Reported - Other (%)
Geographical mobility - Same house 1 year ago (%)
Geographical mobility - Same house 1 year ago (%) - White
Geographical mobility - Same house 1 year ago (%) - Black or African American
Geographical mobility - Same house 1 year ago (%) - Asian
Geographical mobility - Same house 1 year ago (%) - Hispanic or Latino
Geographical mobility - Same house 1 year ago (%) - American Indian and Alaska Native
Geographical mobility - Same house 1 year ago (%) - Multirace
Geographical mobility - Same house 1 year ago (%) - Other Race
Geographical mobility - Moved within same county (%)
Geographical mobility - Moved within same county (%) - White
Geographical mobility - Moved within same county (%) - Black or African American
Geographical mobility - Moved within same county (%) - Asian
Geographical mobility - Moved within same county (%) - Hispanic or Latino
Geographical mobility - Moved within same county (%) - American Indian and Alaska Native
Geographical mobility - Moved within same county (%) - Multirace
Geographical mobility - Moved within same county (%) - Other Race
Geographical mobility - Moved from different county within same state (%)
Geographical mobility - Moved from different county within same state (%) - White
Geographical mobility - Moved from different county within same state (%) - Black or African American
Geographical mobility - Moved from different county within same state (%) - Asian
Geographical mobility - Moved from different county within same state (%) - Hispanic or Latino
Geographical mobility - Moved from different county within same state (%) - American Indian and Alaska Native
Geographical mobility - Moved from different county within same state (%) - Multirace
Geographical mobility - Moved from different county within same state (%) - Other Race
Geographical mobility - Moved from different state (%)
Geographical mobility - Moved from different state (%) - White
Geographical mobility - Moved from different state (%) - Black or African American
Geographical mobility - Moved from different state (%) - Asian
Geographical mobility - Moved from different state (%) - Hispanic or Latino
Geographical mobility - Moved from different state (%) - American Indian and Alaska Native
Geographical mobility - Moved from different state (%) - Multirace
Geographical mobility - Moved from different state (%) - Other Race
Geographical mobility - Moved from abroad (%)
Geographical mobility - Moved from abroad (%) - White
Geographical mobility - Moved from abroad (%) - Black or African American
Geographical mobility - Moved from abroad (%) - Asian
Geographical mobility - Moved from abroad (%) - Hispanic or Latino
Geographical mobility - Moved from abroad (%) - American Indian and Alaska Native
Geographical mobility - Moved from abroad (%) - Multirace
Geographical mobility - Moved from abroad (%) - Other Race
Place of birth for the foreign-born population - Ireland (%)
Place of birth for the foreign-born population - Denmark (%)
Place of birth for the foreign-born population - Norway (%)
Place of birth for the foreign-born population - Sweden (%)
Place of birth for the foreign-born population - United Kingdom (%)
Place of birth for the foreign-born population - England (%)
Place of birth for the foreign-born population - Scotland (%)
Place of birth for the foreign-born population - Other Northern Europe (%)
Place of birth for the foreign-born population - Austria (%)
Place of birth for the foreign-born population - Belgium (%)
Place of birth for the foreign-born population - France (%)
Place of birth for the foreign-born population - Germany (%)
Place of birth for the foreign-born population - Netherlands (%)
Place of birth for the foreign-born population - Switzerland (%)
Place of birth for the foreign-born population - Other Western Europe (%)
Place of birth for the foreign-born population - Greece (%)
Place of birth for the foreign-born population - Italy (%)
Place of birth for the foreign-born population - Portugal (%)
Place of birth for the foreign-born population - Spain (%)
Place of birth for the foreign-born population - Other Southern Europe (%)
Place of birth for the foreign-born population - Albania (%)
Place of birth for the foreign-born population - Belarus (%)
Place of birth for the foreign-born population - Bosnia and Herzegovina (%)
Place of birth for the foreign-born population - Bulgaria (%)
Place of birth for the foreign-born population - Croatia (%)
Place of birth for the foreign-born population - Czechoslovakia (%)
Place of birth for the foreign-born population - Hungary (%)
Place of birth for the foreign-born population - Latvia (%)
Place of birth for the foreign-born population - Lithuania (%)
Place of birth for the foreign-born population - North Macedonia (Macedonia) (%)
Place of birth for the foreign-born population - Moldova (%)
Place of birth for the foreign-born population - Poland (%)
Place of birth for the foreign-born population - Romania (%)
Place of birth for the foreign-born population - Russia (%)
Place of birth for the foreign-born population - Serbia (%)
Place of birth for the foreign-born population - Ukraine (%)
Place of birth for the foreign-born population - Other Eastern Europe (%)
Place of birth for the foreign-born population - China (%)
Place of birth for the foreign-born population - Hong Kong (%)
Place of birth for the foreign-born population - Taiwan (%)
Place of birth for the foreign-born population - Japan (%)
Place of birth for the foreign-born population - Korea (%)
Place of birth for the foreign-born population - Other Eastern Asia (%)
Place of birth for the foreign-born population - Afghanistan (%)
Place of birth for the foreign-born population - Bangladesh (%)
Place of birth for the foreign-born population - India (%)
Place of birth for the foreign-born population - Iran (%)
Place of birth for the foreign-born population - Kazakhstan (%)
Place of birth for the foreign-born population - Nepal (%)
Place of birth for the foreign-born population - Pakistan (%)
Place of birth for the foreign-born population - Sri Lanka (%)
Place of birth for the foreign-born population - Uzbekistan (%)
Place of birth for the foreign-born population - Other South Central Asia (%)
Place of birth for the foreign-born population - Burma (%)
Place of birth for the foreign-born population - Cambodia (%)
Place of birth for the foreign-born population - Indonesia (%)
Place of birth for the foreign-born population - Laos (%)
Place of birth for the foreign-born population - Malaysia (%)
Place of birth for the foreign-born population - Philippines (%)
Place of birth for the foreign-born population - Singapore (%)
Place of birth for the foreign-born population - Thailand (%)
Place of birth for the foreign-born population - Vietnam (%)
Place of birth for the foreign-born population - Other South Eastern Asia (%)
Place of birth for the foreign-born population - Armenia (%)
Place of birth for the foreign-born population - Iraq (%)
Place of birth for the foreign-born population - Israel (%)
Place of birth for the foreign-born population - Jordan (%)
Place of birth for the foreign-born population - Kuwait (%)
Place of birth for the foreign-born population - Lebanon (%)
Place of birth for the foreign-born population - Saudi Arabia (%)
Place of birth for the foreign-born population - Syria (%)
Place of birth for the foreign-born population - Turkey (%)
Place of birth for the foreign-born population - Yemen (%)
Place of birth for the foreign-born population - Other Western Asia (%)
Place of birth for the foreign-born population - Eritrea (%)
Place of birth for the foreign-born population - Ethiopia (%)
Place of birth for the foreign-born population - Kenya (%)
Place of birth for the foreign-born population - Somalia (%)
Place of birth for the foreign-born population - Uganda (%)
Place of birth for the foreign-born population - Zimbabwe (%)
Place of birth for the foreign-born population - Other Eastern Africa (%)
Place of birth for the foreign-born population - Cameroon (%)
Place of birth for the foreign-born population - Congo (%)
Place of birth for the foreign-born population - Democratic Republic of Congo (Zaire) (%)
Place of birth for the foreign-born population - Other Middle Africa (%)
Place of birth for the foreign-born population - Egypt (%)
Place of birth for the foreign-born population - Morocco (%)
Place of birth for the foreign-born population - Sudan (%)
Place of birth for the foreign-born population - Other Northern Africa (%)
Place of birth for the foreign-born population - South Africa (%)
Place of birth for the foreign-born population - Other Southern Africa (%)
Place of birth for the foreign-born population - Cabo Verde (%)
Place of birth for the foreign-born population - Ghana (%)
Place of birth for the foreign-born population - Liberia (%)
Place of birth for the foreign-born population - Nigeria (%)
Place of birth for the foreign-born population - Senegal (%)
Place of birth for the foreign-born population - Sierra Leone (%)
Place of birth for the foreign-born population - Other Western Africa (%)
Place of birth for the foreign-born population - Australia (%)
Place of birth for the foreign-born population - New Zealand (%)
Place of birth for the foreign-born population - Fiji (%)
Place of birth for the foreign-born population - Micronesia (%)
Place of birth for the foreign-born population - Bahamas (%)
Place of birth for the foreign-born population - Barbados (%)
Place of birth for the foreign-born population - Cuba (%)
Place of birth for the foreign-born population - Dominica (%)
Place of birth for the foreign-born population - Dominican Republic (%)
Place of birth for the foreign-born population - Grenada (%)
Place of birth for the foreign-born population - Haiti (%)
Place of birth for the foreign-born population - Jamaica (%)
Place of birth for the foreign-born population - St. Vincent and the Grenadines (%)
Place of birth for the foreign-born population - Trinidad and Tobago (%)
Place of birth for the foreign-born population - West Indies (%)
Place of birth for the foreign-born population - Other Caribbean (%)
Place of birth for the foreign-born population - Belize (%)
Place of birth for the foreign-born population - Costa Rica (%)
Place of birth for the foreign-born population - El Salvador (%)
Place of birth for the foreign-born population - Guatemala (%)
Place of birth for the foreign-born population - Honduras (%)
Place of birth for the foreign-born population - Mexico (%)
Place of birth for the foreign-born population - Nicaragua (%)
Place of birth for the foreign-born population - Panama (%)
Place of birth for the foreign-born population - Other Central America (%)
Place of birth for the foreign-born population - Argentina (%)
Place of birth for the foreign-born population - Bolivia (%)
Place of birth for the foreign-born population - Brazil (%)
Place of birth for the foreign-born population - Chile (%)
Place of birth for the foreign-born population - Colombia (%)
Place of birth for the foreign-born population - Ecuador (%)
Place of birth for the foreign-born population - Guyana (%)
Place of birth for the foreign-born population - Peru (%)
Place of birth for the foreign-born population - Uruguay (%)
Place of birth for the foreign-born population - Venezuela (%)
Place of birth for the foreign-born population - Other South America (%)
Place of birth for the foreign-born population - Canada (%)
Place of birth for the foreign-born population - Other Northern America (%)
Place of birth for the foreign-born population - Other (%)
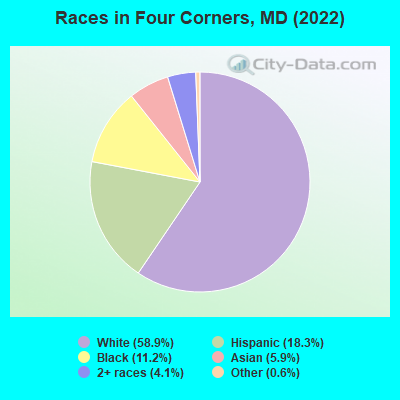
According to 2022 data, the most numerous races in Four Corners, MD are White alone (4,556 residents), Black alone (868 residents), and Hispanic (1,417 residents). 71.2% of Four Corners residents speak English at home.
Race distribution in Four Corners 4,556 58.9% White alone 1,417 18.3% Hispanic 868 11.2% Black alone 457 5.9% Asian alone 315 4.1% Two or more races 48 0.6% Other race alone
2000 2022
3,286,547 62.1% White alone 1,464,735 27.7% Black alone 227,916 4.3% Hispanic 209,738 4.0% Asian alone 82,946 1.6% Two or more races 13,312 0.3% American Indian alone 9,379 0.2% Other race alone 1,913 0.04% Native Hawaiian and Other
2,906,492 47.1% White alone 1,800,914 29.2% Black alone 705,842 11.4% Hispanic 401,818 6.5% Asian alone 291,317 4.7% Two or more races 46,930 0.8% Other race alone 8,930 0.1% American Indian alone 2,417 0.04% Native Hawaiian and Other
Income and house value in Four Corners Median household income in 2022 $188,212 White non-Hispanic householders$148,042 Black householders$172,351 Asian householders$153,642 Some other race householders$113,634 Hispanic or Latino race householders
Median age by race in Four Corners
44.9 Median age for White residents44.5 45.0 54.3 Median age for Black or African American residents57.2 53.9 -610,526,315.2 Median age for American Indian / Alaska Native residents-555,555,555.0 -671,704,449.4 36.2 Median age for Asian residents43.6 34.6 -763,333,332.6 Median age for Native Hawaiian / Pacific Islander residents-720,061,021.4 -760,942,760.2 32.2 Median age for Other race residents36.2 30.7 37.0 Median age for Two or more races residents35.2 40.2 43.8 Median age for White alone residents44.6 43.3 33.8 Median age for Hispanic or Latino residents34.7 31.3
Owner/renter occupied households by race in Four Corners
House owners and renters - White residents 1,652 92.3% Owner occupied137 7.7% Renter occupiedHouse owners and renters - Black or African American residents 365 77.5% Owner occupied106 22.5% Renter occupiedHouse owners and renters - Asian residents 145 95.7% Owner occupied6 4.3% Renter occupiedHouse owners and renters - Other race residents 130 57.7% Owner occupied96 42.3% Renter occupiedHouse owners and renters - Two or more races residents 153 92.5% Owner occupied12 7.5% Renter occupiedHouse owners and renters - White alone residents 1,643 92.4% Owner occupied136 7.6% Renter occupiedHouse owners and renters - Hispanic or Latino residents 230 67.8% Owner occupied110 32.2% Renter occupied
Language usage in Four Corners
English speakers - Total 71.2% of residents of Four Corners speak English at home.
15.6% of residents speak Spanish at home 675 60.6% Speak English very well439 39.4% Speak English less than very well12.0% of residents speak other language at home 582 67.7% Speak English very well278 32.3% Speak English less than very well
English speakers - Born in the United States 90.6% of residents of Four Corners speak English at home.
7.2% of residents speak Spanish at home 257 100.0% Speak English very well2.5% of residents speak other language at home 76 86.4% Speak English very well12 13.6% Speak English less than very well
English speakers - Native, born elsewhere 83.6% of residents of Four Corners speak English at home.
13.4% of residents speak Spanish at home 5 27.8% Speak English very well13 72.2% Speak English less than very well
English speakers - Foreign-born 16.3% of residents of Four Corners speak English at home.
41.7% of residents speak Spanish at home 186 29.9% Speak English very well436 70.1% Speak English less than very well42.1% of residents speak other language at home 381 60.7% Speak English very well247 39.3% Speak English less than very well
White (Caucasian) - Speak only English Native:
97.5% (3,779)Foreign-born:
42.7% (117)
White (Caucasian) - Speak another language Native:
3.9% (150)Foreign-born:
62.1% (170)
Black or African American - Speak only English Native:
94.5% (559)Foreign-born:
10.8% (29)
Black or African American - Speak another language Native:
4.7% (28)Foreign-born:
91.8% (243)
Asian - Speak only English Native:
31.4% (58)Foreign-born:
29.3% (88)
Asian - Speak another language Native:
71.7% (133)Foreign-born:
71.7% (216)
Other race - Speak another language Native:
70.0% (319)Foreign-born:
100.0% (571)
Two or more races - Speak only English Native:
73.2% (295)Foreign-born:
12.2% (14)
Two or more races - Speak another language Native:
24.7% (99)Foreign-born:
87.8% (98)
White alone - Speak only English Native:
96.8% (3,738)Foreign-born:
40.1% (110)
White alone - Speak another language Native:
3.4% (130)Foreign-born:
58.3% (160)
Hispanic or Latino - Speak only English Native:
35.1% (239)Foreign-born:
1.2% (8)
Hispanic or Latino - Speak another language Native:
65.3% (444)Foreign-born:
99.0% (622)
Foreign-born residents in Four Corners
Marital status for residents in Four Corners Marital status - White (Caucasian) population 15 years and over
Males 15.0% Never married79.8% Now married0.2% Separated1.0% Widowed4.1% DivorcedFemales 17.2% Never married66.6% Now married0.9% Separated5.9% Widowed9.5% DivorcedWomen who gave birth in the past 12 months Now married:
100.0% (121)Unmarried:
0.0% (0)
Women who did not give birth in the past 12 months Now married:
65.5% (530)Unmarried:
34.5% (279)
Marital status - Black or African American population 15 years and over
Males 22.4% Never married64.6% Now married0.0% Separated2.5% Widowed10.5% DivorcedFemales 44.4% Never married36.2% Now married0.0% Separated6.1% Widowed13.3% DivorcedWomen who did not give birth in the past 12 months Now married:
15.1% (26)Unmarried:
84.9% (146)
Marital status - Asian population 15 years and over
Males 44.1% Never married53.1% Now married0.0% Separated0.0% Widowed2.8% DivorcedFemales 25.3% Never married71.8% Now married2.9% Separated0.0% Widowed0.0% DivorcedWomen who did not give birth in the past 12 months Now married:
60.3% (94)Unmarried:
39.7% (62)
Marital status - Other race population 15 years and over
Males 41.0% Never married59.0% Now married0.0% Separated0.0% Widowed0.0% DivorcedFemales 35.5% Never married50.0% Now married0.0% Separated3.7% Widowed10.8% DivorcedWomen who did not give birth in the past 12 months Now married:
52.7% (194)Unmarried:
47.3% (174)
Marital status - Two or more races population 15 years and over
Males 34.9% Never married65.1% Now married0.0% Separated0.0% Widowed0.0% DivorcedFemales 37.5% Never married53.3% Now married0.0% Separated3.3% Widowed6.0% DivorcedWomen who did not give birth in the past 12 months Now married:
38.1% (50)Unmarried:
61.9% (81)
Marital status - White alone, not Hispanic / Latino population 15 years and over
Males 14.2% Never married81.1% Now married0.2% Separated0.5% Widowed3.9% DivorcedFemales 17.2% Never married67.0% Now married0.9% Separated5.1% Widowed9.8% DivorcedWomen who gave birth in the past 12 months Now married:
100.0% (132)Unmarried:
0.0% (0)
Women who did not give birth in the past 12 months Now married:
65.3% (573)Unmarried:
34.7% (305)
Marital status - Hispanic or Latino population 15 years and over
Males 36.9% Never married60.0% Now married0.0% Separated1.7% Widowed1.4% DivorcedFemales 37.2% Never married48.0% Now married0.0% Separated7.3% Widowed7.4% DivorcedWomen who did not give birth in the past 12 months Now married:
47.7% (167)Unmarried:
52.3% (182)
Ancestries in Four Corners
399 11.2% European249 7.0% Irish205 5.8% Ethiopian189 5.3% English138 3.9% German129 3.6% Italian95 2.7% American65 1.8% Scottish47 1.3% Greek37 1.0% Polish36 1.0% Northern European35 1.0% Czechoslovakian34 1.0% Russian33 0.9% Scotch-Irish31 0.9% African29 0.8% Hungarian29 0.8% Nigerian22 0.6% Danish20 0.6% Slovak17 0.5% Lebanese17 0.5% Norwegian15 0.4% Ukrainian13 0.4% Iranian11 0.3% Swedish10 0.3% Jamaican9 0.3% Afghan7 0.2% Alsatian7 0.2% Eastern European5 0.1% Czech5 0.1% U.S. Virgin Islander4 0.1% French Canadian4 0.1% Dutch4 0.1% Bulgarian3 0.08% West Indian2 0.06% Jordanian1 0.03% Belgian
Children Nativity (place of birth) in Four Corners
Children under 6 years - Living with two parents Both parents native 328 100.0% NativeBoth parents foreign-born 16 100.0% Foreign-bornOne native, one foreign-born parent 216 100.0% NativeChildren under 6 years - Living with one parent Native parent 20 100.0% NativeForeign-born parent 33 100.0% NativeChildren 6 to 17 years - Living with two parents Both parents native 748 98.0% Native15 2.0% Foreign-bornBoth parents foreign-born 122 71.2% Native49 28.8% Foreign-bornOne native, one foreign-born parent 154 91.5% Native14 8.5% Foreign-bornChildren 6 to 17 years - Living with one parent Native parent 76 74.6% Native26 25.4% Foreign-bornForeign-born parent 38 81.5% Native9 18.5% Foreign-born
Grandparents responsible for own grandchildren in Four Corners
Grandparents (30 to 59 years) Other race 42 100.0% Not responsible for grandchildrenHispanic or Latino 36 100.0% Not responsible for grandchildren
Grandparents (60 years and over)