Races in Fremont, Ohio (OH) Detailed Stats
Data:
Races - White alone (%)
Races - White alone (% change since 2000)
Races - Black alone (%)
Races - Black alone (% change since 2000)
Races - American Indian alone (%)
Races - American Indian alone (% change since 2000)
Races - Asian alone (%)
Races - Asian alone (% change since 2000)
Races - Hispanic (%)
Races - Hispanic (% change since 2000)
Races - Native Hawaiian and Other Pacific Islander alone (%)
Races - Native Hawaiian and Other Pacific Islander alone (% change since 2000)
Races - Two or more races(%)
Races - Two or more races(% change since 2000)
Races - Other race alone (%)
Races - Other race alone (% change since 2000)
Racial diversity
Place of birth - Born in state of residence (%)
Place of birth - Born in state of residence (%) - White
Place of birth - Born in state of residence (%) - Black or African American
Place of birth - Born in state of residence (%) - Asian
Place of birth - Born in state of residence (%) - Hispanic or Latino
Place of birth - Born in state of residence (%) - American Indian and Alaska Native
Place of birth - Born in state of residence (%) - Multirace
Place of birth - Born in state of residence (%) - Other Race
Place of birth - Born in other state (%)
Place of birth - Born in other state (%) - White
Place of birth - Born in other state (%) - Black or African American
Place of birth - Born in other state (%) - Asian
Place of birth - Born in other state (%) - Hispanic or Latino
Place of birth - Born in other state (%) - American Indian and Alaska Native
Place of birth - Born in other state (%) - Multirace
Place of birth - Born in other state (%) - Other Race
Place of birth - Native, outside of US (%)
Place of birth - Native, outside of US (%) - White
Place of birth - Native, outside of US (%) - Black or African American
Place of birth - Native, outside of US (%) - Asian
Place of birth - Native, outside of US (%) - Hispanic or Latino
Place of birth - Native, outside of US (%) - American Indian and Alaska Native
Place of birth - Native, outside of US (%) - Multirace
Place of birth - Native, outside of US (%) - Other Race
Place of birth - Foreign born (%)
Place of birth - Foreign born (%) - White
Place of birth - Foreign born (%) - Black or African American
Place of birth - Foreign born (%) - Asian
Place of birth - Foreign born (%) - Hispanic or Latino
Place of birth - Foreign born (%) - American Indian and Alaska Native
Place of birth - Foreign born (%) - Multirace
Place of birth - Foreign born (%) - Other Race
Residents speaking English at home (%)
Residents speaking English at home - Born in the United States (%)
Residents speaking English at home - Native, born elsewhere (%)
Residents speaking English at home - Foreign born (%)
Residents speaking Spanish at home (%)
Residents speaking Spanish at home - Born in the United States (%)
Residents speaking Spanish at home - Native, born elsewhere (%)
Residents speaking Spanish at home - Foreign born (%)
Residents speaking other language at home (%)
Residents speaking other language at home - Born in the United States (%)
Residents speaking other language at home - Native, born elsewhere (%)
Residents speaking other language at home - Foreign born (%)
Marital status - Never married (%)
Marital status - Now married (%)
Marital status - Separated (%)
Marital status - Widowed (%)
Marital status - Divorced (%)
Ancestries Reported - Arab (%)
Ancestries Reported - Czech (%)
Ancestries Reported - Danish (%)
Ancestries Reported - Dutch (%)
Ancestries Reported - English (%)
Ancestries Reported - French (%)
Ancestries Reported - French Canadian (%)
Ancestries Reported - German (%)
Ancestries Reported - Greek (%)
Ancestries Reported - Hungarian (%)
Ancestries Reported - Irish (%)
Ancestries Reported - Italian (%)
Ancestries Reported - Lithuanian (%)
Ancestries Reported - Norwegian (%)
Ancestries Reported - Polish (%)
Ancestries Reported - Portuguese (%)
Ancestries Reported - Russian (%)
Ancestries Reported - Scotch-Irish (%)
Ancestries Reported - Scottish (%)
Ancestries Reported - Slovak (%)
Ancestries Reported - Subsaharan African (%)
Ancestries Reported - Swedish (%)
Ancestries Reported - Swiss (%)
Ancestries Reported - Ukrainian (%)
Ancestries Reported - United States (%)
Ancestries Reported - Welsh (%)
Ancestries Reported - West Indian (%)
Ancestries Reported - Other (%)
Geographical mobility - Same house 1 year ago (%)
Geographical mobility - Same house 1 year ago (%) - White
Geographical mobility - Same house 1 year ago (%) - Black or African American
Geographical mobility - Same house 1 year ago (%) - Asian
Geographical mobility - Same house 1 year ago (%) - Hispanic or Latino
Geographical mobility - Same house 1 year ago (%) - American Indian and Alaska Native
Geographical mobility - Same house 1 year ago (%) - Multirace
Geographical mobility - Same house 1 year ago (%) - Other Race
Geographical mobility - Moved within same county (%)
Geographical mobility - Moved within same county (%) - White
Geographical mobility - Moved within same county (%) - Black or African American
Geographical mobility - Moved within same county (%) - Asian
Geographical mobility - Moved within same county (%) - Hispanic or Latino
Geographical mobility - Moved within same county (%) - American Indian and Alaska Native
Geographical mobility - Moved within same county (%) - Multirace
Geographical mobility - Moved within same county (%) - Other Race
Geographical mobility - Moved from different county within same state (%)
Geographical mobility - Moved from different county within same state (%) - White
Geographical mobility - Moved from different county within same state (%) - Black or African American
Geographical mobility - Moved from different county within same state (%) - Asian
Geographical mobility - Moved from different county within same state (%) - Hispanic or Latino
Geographical mobility - Moved from different county within same state (%) - American Indian and Alaska Native
Geographical mobility - Moved from different county within same state (%) - Multirace
Geographical mobility - Moved from different county within same state (%) - Other Race
Geographical mobility - Moved from different state (%)
Geographical mobility - Moved from different state (%) - White
Geographical mobility - Moved from different state (%) - Black or African American
Geographical mobility - Moved from different state (%) - Asian
Geographical mobility - Moved from different state (%) - Hispanic or Latino
Geographical mobility - Moved from different state (%) - American Indian and Alaska Native
Geographical mobility - Moved from different state (%) - Multirace
Geographical mobility - Moved from different state (%) - Other Race
Geographical mobility - Moved from abroad (%)
Geographical mobility - Moved from abroad (%) - White
Geographical mobility - Moved from abroad (%) - Black or African American
Geographical mobility - Moved from abroad (%) - Asian
Geographical mobility - Moved from abroad (%) - Hispanic or Latino
Geographical mobility - Moved from abroad (%) - American Indian and Alaska Native
Geographical mobility - Moved from abroad (%) - Multirace
Geographical mobility - Moved from abroad (%) - Other Race
Place of birth for the foreign-born population - Ireland (%)
Place of birth for the foreign-born population - Denmark (%)
Place of birth for the foreign-born population - Norway (%)
Place of birth for the foreign-born population - Sweden (%)
Place of birth for the foreign-born population - United Kingdom (%)
Place of birth for the foreign-born population - England (%)
Place of birth for the foreign-born population - Scotland (%)
Place of birth for the foreign-born population - Other Northern Europe (%)
Place of birth for the foreign-born population - Austria (%)
Place of birth for the foreign-born population - Belgium (%)
Place of birth for the foreign-born population - France (%)
Place of birth for the foreign-born population - Germany (%)
Place of birth for the foreign-born population - Netherlands (%)
Place of birth for the foreign-born population - Switzerland (%)
Place of birth for the foreign-born population - Other Western Europe (%)
Place of birth for the foreign-born population - Greece (%)
Place of birth for the foreign-born population - Italy (%)
Place of birth for the foreign-born population - Portugal (%)
Place of birth for the foreign-born population - Spain (%)
Place of birth for the foreign-born population - Other Southern Europe (%)
Place of birth for the foreign-born population - Albania (%)
Place of birth for the foreign-born population - Belarus (%)
Place of birth for the foreign-born population - Bosnia and Herzegovina (%)
Place of birth for the foreign-born population - Bulgaria (%)
Place of birth for the foreign-born population - Croatia (%)
Place of birth for the foreign-born population - Czechoslovakia (%)
Place of birth for the foreign-born population - Hungary (%)
Place of birth for the foreign-born population - Latvia (%)
Place of birth for the foreign-born population - Lithuania (%)
Place of birth for the foreign-born population - North Macedonia (Macedonia) (%)
Place of birth for the foreign-born population - Moldova (%)
Place of birth for the foreign-born population - Poland (%)
Place of birth for the foreign-born population - Romania (%)
Place of birth for the foreign-born population - Russia (%)
Place of birth for the foreign-born population - Serbia (%)
Place of birth for the foreign-born population - Ukraine (%)
Place of birth for the foreign-born population - Other Eastern Europe (%)
Place of birth for the foreign-born population - China (%)
Place of birth for the foreign-born population - Hong Kong (%)
Place of birth for the foreign-born population - Taiwan (%)
Place of birth for the foreign-born population - Japan (%)
Place of birth for the foreign-born population - Korea (%)
Place of birth for the foreign-born population - Other Eastern Asia (%)
Place of birth for the foreign-born population - Afghanistan (%)
Place of birth for the foreign-born population - Bangladesh (%)
Place of birth for the foreign-born population - India (%)
Place of birth for the foreign-born population - Iran (%)
Place of birth for the foreign-born population - Kazakhstan (%)
Place of birth for the foreign-born population - Nepal (%)
Place of birth for the foreign-born population - Pakistan (%)
Place of birth for the foreign-born population - Sri Lanka (%)
Place of birth for the foreign-born population - Uzbekistan (%)
Place of birth for the foreign-born population - Other South Central Asia (%)
Place of birth for the foreign-born population - Burma (%)
Place of birth for the foreign-born population - Cambodia (%)
Place of birth for the foreign-born population - Indonesia (%)
Place of birth for the foreign-born population - Laos (%)
Place of birth for the foreign-born population - Malaysia (%)
Place of birth for the foreign-born population - Philippines (%)
Place of birth for the foreign-born population - Singapore (%)
Place of birth for the foreign-born population - Thailand (%)
Place of birth for the foreign-born population - Vietnam (%)
Place of birth for the foreign-born population - Other South Eastern Asia (%)
Place of birth for the foreign-born population - Armenia (%)
Place of birth for the foreign-born population - Iraq (%)
Place of birth for the foreign-born population - Israel (%)
Place of birth for the foreign-born population - Jordan (%)
Place of birth for the foreign-born population - Kuwait (%)
Place of birth for the foreign-born population - Lebanon (%)
Place of birth for the foreign-born population - Saudi Arabia (%)
Place of birth for the foreign-born population - Syria (%)
Place of birth for the foreign-born population - Turkey (%)
Place of birth for the foreign-born population - Yemen (%)
Place of birth for the foreign-born population - Other Western Asia (%)
Place of birth for the foreign-born population - Eritrea (%)
Place of birth for the foreign-born population - Ethiopia (%)
Place of birth for the foreign-born population - Kenya (%)
Place of birth for the foreign-born population - Somalia (%)
Place of birth for the foreign-born population - Uganda (%)
Place of birth for the foreign-born population - Zimbabwe (%)
Place of birth for the foreign-born population - Other Eastern Africa (%)
Place of birth for the foreign-born population - Cameroon (%)
Place of birth for the foreign-born population - Congo (%)
Place of birth for the foreign-born population - Democratic Republic of Congo (Zaire) (%)
Place of birth for the foreign-born population - Other Middle Africa (%)
Place of birth for the foreign-born population - Egypt (%)
Place of birth for the foreign-born population - Morocco (%)
Place of birth for the foreign-born population - Sudan (%)
Place of birth for the foreign-born population - Other Northern Africa (%)
Place of birth for the foreign-born population - South Africa (%)
Place of birth for the foreign-born population - Other Southern Africa (%)
Place of birth for the foreign-born population - Cabo Verde (%)
Place of birth for the foreign-born population - Ghana (%)
Place of birth for the foreign-born population - Liberia (%)
Place of birth for the foreign-born population - Nigeria (%)
Place of birth for the foreign-born population - Senegal (%)
Place of birth for the foreign-born population - Sierra Leone (%)
Place of birth for the foreign-born population - Other Western Africa (%)
Place of birth for the foreign-born population - Australia (%)
Place of birth for the foreign-born population - New Zealand (%)
Place of birth for the foreign-born population - Fiji (%)
Place of birth for the foreign-born population - Micronesia (%)
Place of birth for the foreign-born population - Bahamas (%)
Place of birth for the foreign-born population - Barbados (%)
Place of birth for the foreign-born population - Cuba (%)
Place of birth for the foreign-born population - Dominica (%)
Place of birth for the foreign-born population - Dominican Republic (%)
Place of birth for the foreign-born population - Grenada (%)
Place of birth for the foreign-born population - Haiti (%)
Place of birth for the foreign-born population - Jamaica (%)
Place of birth for the foreign-born population - St. Vincent and the Grenadines (%)
Place of birth for the foreign-born population - Trinidad and Tobago (%)
Place of birth for the foreign-born population - West Indies (%)
Place of birth for the foreign-born population - Other Caribbean (%)
Place of birth for the foreign-born population - Belize (%)
Place of birth for the foreign-born population - Costa Rica (%)
Place of birth for the foreign-born population - El Salvador (%)
Place of birth for the foreign-born population - Guatemala (%)
Place of birth for the foreign-born population - Honduras (%)
Place of birth for the foreign-born population - Mexico (%)
Place of birth for the foreign-born population - Nicaragua (%)
Place of birth for the foreign-born population - Panama (%)
Place of birth for the foreign-born population - Other Central America (%)
Place of birth for the foreign-born population - Argentina (%)
Place of birth for the foreign-born population - Bolivia (%)
Place of birth for the foreign-born population - Brazil (%)
Place of birth for the foreign-born population - Chile (%)
Place of birth for the foreign-born population - Colombia (%)
Place of birth for the foreign-born population - Ecuador (%)
Place of birth for the foreign-born population - Guyana (%)
Place of birth for the foreign-born population - Peru (%)
Place of birth for the foreign-born population - Uruguay (%)
Place of birth for the foreign-born population - Venezuela (%)
Place of birth for the foreign-born population - Other South America (%)
Place of birth for the foreign-born population - Canada (%)
Place of birth for the foreign-born population - Other Northern America (%)
Place of birth for the foreign-born population - Other (%)
Latest news about races in Fremont, OH collected exclusively by city-data.com from local newspapers, TV, and radio stations
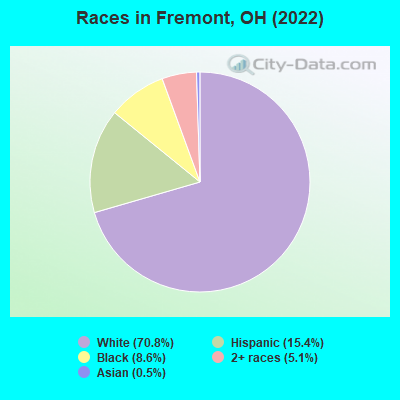
According to 2022 data, the most numerous races in Fremont, OH are White alone (11,240 residents), Black alone (1,371 residents), and Two or more races (810 residents). 95.9% of Fremont residents speak English at home. 1.1% of Fremont, OH residents are foreign-born , which is 273.5% less than the foreign-born rate of 4.0% across the entire state of Ohio.
Race distribution in Fremont
2000 2022
9,538,111 84.0% White alone 1,290,662 11.4% Black alone 217,123 1.9% Hispanic 137,770 1.2% Two or more races 131,670 1.2% Asian alone 21,985 0.2% American Indian alone 13,483 0.1% Other race alone 2,336 0.02% Native Hawaiian and Other
8,948,793 76.1% White alone 1,401,403 11.9% Black alone 529,291 4.5% Two or more races 517,232 4.4% Hispanic 293,387 2.5% Asian alone 52,805 0.4% Other race alone 9,785 0.08% American Indian alone 3,362 0.03% Native Hawaiian and Other
Income and house value in Fremont Median household income in 2022 $50,251 White non-Hispanic householders$34,061 Black householders$29,048 Some other race householders$50,705 Two or more races householders$36,123 Hispanic or Latino race householdersMedian 2022 house value $128,509 White Non-Hispanic householders$112,661 Black or African American householders$106,631 Some other race householders$116,278 Two or more races householders$108,699 Hispanic or Latino householders
Median age by race in Fremont
38.5 Median age for White residents37.4 38.8 33.6 Median age for Black or African American residents30.9 37.3 -676,818,950.3 Median age for American Indian / Alaska Native residents-685,185,184.5 -658,163,264.6 38.8 Median age for Asian residents41.0 -674,285,713.6 -800,387,596.1 Median age for Native Hawaiian / Pacific Islander residents-750,242,953.6 -805,394,989.6 30.3 Median age for Other race residents51.5 24.2 22.6 Median age for Two or more races residents32.8 19.8 39.1 Median age for White alone residents39.0 39.8 25.6 Median age for Hispanic or Latino residents23.8 26.6
Owner/renter occupied households by race in Fremont
House owners and renters - White residents 3,201 62.3% Owner occupied1,939 37.7% Renter occupiedHouse owners and renters - Black or African American residents 303 37.8% Owner occupied499 62.2% Renter occupiedHouse owners and renters - Asian residents 32 100.0% Owner occupiedHouse owners and renters - Other race residents 161 57.9% Owner occupied117 42.1% Renter occupiedHouse owners and renters - Two or more races residents 307 56.9% Owner occupied232 43.1% Renter occupiedHouse owners and renters - White alone residents 3,086 63.9% Owner occupied1,743 36.1% Renter occupiedHouse owners and renters - Hispanic or Latino residents 484 50.7% Owner occupied471 49.3% Renter occupied
Language usage in Fremont
English speakers - Total 95.9% of residents of Fremont speak English at home.
3.4% of residents speak Spanish at home 373 72.7% Speak English very well140 27.3% Speak English less than very well0.5% of residents speak other language at home 58 81.7% Speak English very well13 18.3% Speak English less than very well
English speakers - Born in the United States 95.0% of residents of Fremont speak English at home.
4.6% of residents speak Spanish at home 83 72.8% Speak English very well31 27.2% Speak English less than very well0.6% of residents speak other language at home 14 100.0% Speak English very well
English speakers - Native, born elsewhere 0.0% of residents of Fremont speak English at home.
100.0% of residents speak Spanish at home 24 100.0% Speak English less than very well
English speakers - Foreign-born 17.0% of residents of Fremont speak English at home.
64.9% of residents speak Spanish at home 69 62.2% Speak English very well42 37.8% Speak English less than very well17.0% of residents speak other language at home 17 58.6% Speak English very well12 41.4% Speak English less than very well
White (Caucasian) - Speak only English Native:
99.3% (11,420)Foreign-born:
48.8% (19)
White (Caucasian) - Speak another language Native:
0.8% (90)Foreign-born:
53.1% (20)
Asian - Speak another language Native:
31.4% (14)Foreign-born:
100.0% (31)
Other race - Speak another language Native:
29.2% (184)Foreign-born:
100.0% (72)
Two or more races - Speak only English Native:
80.8% (1,038)Foreign-born:
23.1% (11)
Two or more races - Speak another language Native:
20.1% (258)Foreign-born:
75.2% (35)
Hispanic or Latino - Speak only English Native:
81.7% (1,752)Foreign-born:
20.1% (29)
Hispanic or Latino - Speak another language Native:
17.3% (370)Foreign-born:
79.3% (115)
Foreign-born residents in Fremont 170 residents are foreign born
Marital status for residents in Fremont Marital status - White (Caucasian) population 15 years and over
Males 33.8% Never married43.7% Now married0.9% Separated6.0% Widowed15.5% DivorcedFemales 29.3% Never married39.8% Now married2.1% Separated9.2% Widowed19.5% DivorcedWomen who gave birth in the past 12 months Now married:
46.8% (28)Unmarried:
53.2% (32)
Women who did not give birth in the past 12 months Now married:
41.7% (1,149)Unmarried:
58.3% (1,604)
Marital status - Black or African American population 15 years and over
Males 53.1% Never married36.6% Now married0.0% Separated3.5% Widowed6.8% DivorcedFemales 58.5% Never married10.6% Now married0.0% Separated10.1% Widowed20.8% DivorcedWomen who did not give birth in the past 12 months Now married:
0.0% (0)Unmarried:
100.0% (257)
Marital status - Asian population 15 years and over
Males 69.0% Never married31.0% Now married0.0% Separated0.0% Widowed0.0% DivorcedFemales 100.0% Never married0.0% Now married0.0% Separated0.0% Widowed0.0% DivorcedWomen who did not give birth in the past 12 months Now married:
0.0% (0)Unmarried:
100.0% (14)
Marital status - Other race population 15 years and over
Males 15.2% Never married30.4% Now married0.0% Separated0.0% Widowed54.4% DivorcedFemales 41.5% Never married35.5% Now married0.0% Separated12.1% Widowed10.9% DivorcedWomen who gave birth in the past 12 months Now married:
0.0% (0)Unmarried:
100.0% (46)
Women who did not give birth in the past 12 months Now married:
31.0% (46)Unmarried:
69.0% (103)
Marital status - Two or more races population 15 years and over
Males 65.6% Never married22.9% Now married2.9% Separated0.0% Widowed8.6% DivorcedFemales 40.0% Never married32.7% Now married0.0% Separated5.8% Widowed21.5% DivorcedWomen who gave birth in the past 12 months Now married:
0.0% (0)Unmarried:
100.0% (69)
Women who did not give birth in the past 12 months Now married:
31.3% (63)Unmarried:
68.7% (138)
Marital status - White alone, not Hispanic / Latino population 15 years and over
Males 31.4% Never married44.9% Now married0.9% Separated6.3% Widowed16.5% DivorcedFemales 27.1% Never married40.4% Now married2.3% Separated9.7% Widowed20.5% DivorcedWomen who gave birth in the past 12 months Now married:
46.8% (28)Unmarried:
53.2% (32)
Women who did not give birth in the past 12 months Now married:
43.9% (1,046)Unmarried:
56.1% (1,338)
Marital status - Hispanic or Latino population 15 years and over
Males 54.6% Never married27.5% Now married0.4% Separated0.0% Widowed17.6% DivorcedFemales 52.0% Never married34.1% Now married0.3% Separated6.8% Widowed6.8% DivorcedWomen who gave birth in the past 12 months Now married:
0.0% (0)Unmarried:
100.0% (37)
Women who did not give birth in the past 12 months Now married:
29.2% (185)Unmarried:
70.8% (448)
Ancestries in Fremont
2,092 27.3% German916 11.9% American562 7.3% English258 3.4% Irish108 1.4% Russian105 1.4% Scottish94 1.2% Italian93 1.2% African81 1.1% Polish78 1.0% French47 0.6% Greek38 0.5% Hungarian34 0.4% Belgian31 0.4% Celtic24 0.3% Swedish22 0.3% Yugoslavian15 0.2% Lebanese12 0.2% Eastern European11 0.1% Slovene8 0.1% Austrian8 0.1% Scotch-Irish4 0.05% British4 0.05% Portuguese1 0.01% Slovak
Geographical mobility in Fremont Same house 1 year ago 10,862 90.1% White (Caucasian)1,417 98.4% Black or African American18 100.0% American Indian / Alaska Native78 100.0% Asian711 94.9% Other race1,424 87.7% Two or more races10,126 90.3% White alone, not Hispanic / Latino2,111 88.8% Hispanic or LatinoMoved within same county 610 5.1% White / Caucasian10 1.3% Other race121 7.5% Two or more races516 4.6% White alone, not Hispanic / Latino161 6.8% Hispanic or LatinoMoved within same state 432 3.6% White / Caucasian22 1.5% Black or African American23 3.1% Other race2 0.1% Two or more races425 3.8% White alone, not Hispanic / Latino25 1.1% Hispanic or LatinoMoved from different state 121 1.0% White / Caucasian4 0.2% Two or more races123 1.1% White alone, not Hispanic / Latino3 0.1% Hispanic or LatinoMoved from abroad 38 0.3% White28 1.9% Black or African American126 7.8% Two or more races42 0.4% White alone, not Hispanic / Latino96 4.0% Hispanic or Latino
Children Nativity (place of birth) in Fremont
Children under 6 years - Living with two parents Both parents native 525 100.0% NativeChildren under 6 years - Living with one parent Native parent 661 100.0% Native
Children 6 to 17 years - Living with two parents Both parents native 1,816 100.0% NativeOne native, one foreign-born parent 106 100.0% NativeChildren 6 to 17 years - Living with one parent Native parent 829 100.0% Native
Place of birth for residents in Fremont 140 Americas140 Latin America140 Central America30 Asia30 South Eastern Asia
Grandparents responsible for own grandchildren in Fremont
Grandparents (30 to 59 years) White / Caucasian 57 61.2% Responsible for grandchildren36 38.8% Not responsible for grandchildrenTwo or more races 21 100.0% Responsible for grandchildrenWhite alone, not Hispanic / Latino 56 60.7% Responsible for grandchildren37 39.3% Not responsible for grandchildrenGrandparents (60 years and over) White / Caucasian 8 15.2% Responsible for grandchildren46 84.8% Not responsible for grandchildrenTwo or more races 11 100.0% Not responsible for grandchildrenWhite alone, not Hispanic / Latino 8 15.1% Responsible for grandchildren46 84.9% Not responsible for grandchildren