Races in Greendale, Wisconsin (WI) Detailed Stats
Data:
Races - White alone (%)
Races - White alone (% change since 2000)
Races - Black alone (%)
Races - Black alone (% change since 2000)
Races - American Indian alone (%)
Races - American Indian alone (% change since 2000)
Races - Asian alone (%)
Races - Asian alone (% change since 2000)
Races - Hispanic (%)
Races - Hispanic (% change since 2000)
Races - Native Hawaiian and Other Pacific Islander alone (%)
Races - Native Hawaiian and Other Pacific Islander alone (% change since 2000)
Races - Two or more races(%)
Races - Two or more races(% change since 2000)
Races - Other race alone (%)
Races - Other race alone (% change since 2000)
Racial diversity
Place of birth - Born in state of residence (%)
Place of birth - Born in state of residence (%) - White
Place of birth - Born in state of residence (%) - Black or African American
Place of birth - Born in state of residence (%) - Asian
Place of birth - Born in state of residence (%) - Hispanic or Latino
Place of birth - Born in state of residence (%) - American Indian and Alaska Native
Place of birth - Born in state of residence (%) - Multirace
Place of birth - Born in state of residence (%) - Other Race
Place of birth - Born in other state (%)
Place of birth - Born in other state (%) - White
Place of birth - Born in other state (%) - Black or African American
Place of birth - Born in other state (%) - Asian
Place of birth - Born in other state (%) - Hispanic or Latino
Place of birth - Born in other state (%) - American Indian and Alaska Native
Place of birth - Born in other state (%) - Multirace
Place of birth - Born in other state (%) - Other Race
Place of birth - Native, outside of US (%)
Place of birth - Native, outside of US (%) - White
Place of birth - Native, outside of US (%) - Black or African American
Place of birth - Native, outside of US (%) - Asian
Place of birth - Native, outside of US (%) - Hispanic or Latino
Place of birth - Native, outside of US (%) - American Indian and Alaska Native
Place of birth - Native, outside of US (%) - Multirace
Place of birth - Native, outside of US (%) - Other Race
Place of birth - Foreign born (%)
Place of birth - Foreign born (%) - White
Place of birth - Foreign born (%) - Black or African American
Place of birth - Foreign born (%) - Asian
Place of birth - Foreign born (%) - Hispanic or Latino
Place of birth - Foreign born (%) - American Indian and Alaska Native
Place of birth - Foreign born (%) - Multirace
Place of birth - Foreign born (%) - Other Race
Residents speaking English at home (%)
Residents speaking English at home - Born in the United States (%)
Residents speaking English at home - Native, born elsewhere (%)
Residents speaking English at home - Foreign born (%)
Residents speaking Spanish at home (%)
Residents speaking Spanish at home - Born in the United States (%)
Residents speaking Spanish at home - Native, born elsewhere (%)
Residents speaking Spanish at home - Foreign born (%)
Residents speaking other language at home (%)
Residents speaking other language at home - Born in the United States (%)
Residents speaking other language at home - Native, born elsewhere (%)
Residents speaking other language at home - Foreign born (%)
Marital status - Never married (%)
Marital status - Now married (%)
Marital status - Separated (%)
Marital status - Widowed (%)
Marital status - Divorced (%)
Ancestries Reported - Arab (%)
Ancestries Reported - Czech (%)
Ancestries Reported - Danish (%)
Ancestries Reported - Dutch (%)
Ancestries Reported - English (%)
Ancestries Reported - French (%)
Ancestries Reported - French Canadian (%)
Ancestries Reported - German (%)
Ancestries Reported - Greek (%)
Ancestries Reported - Hungarian (%)
Ancestries Reported - Irish (%)
Ancestries Reported - Italian (%)
Ancestries Reported - Lithuanian (%)
Ancestries Reported - Norwegian (%)
Ancestries Reported - Polish (%)
Ancestries Reported - Portuguese (%)
Ancestries Reported - Russian (%)
Ancestries Reported - Scotch-Irish (%)
Ancestries Reported - Scottish (%)
Ancestries Reported - Slovak (%)
Ancestries Reported - Subsaharan African (%)
Ancestries Reported - Swedish (%)
Ancestries Reported - Swiss (%)
Ancestries Reported - Ukrainian (%)
Ancestries Reported - United States (%)
Ancestries Reported - Welsh (%)
Ancestries Reported - West Indian (%)
Ancestries Reported - Other (%)
Geographical mobility - Same house 1 year ago (%)
Geographical mobility - Same house 1 year ago (%) - White
Geographical mobility - Same house 1 year ago (%) - Black or African American
Geographical mobility - Same house 1 year ago (%) - Asian
Geographical mobility - Same house 1 year ago (%) - Hispanic or Latino
Geographical mobility - Same house 1 year ago (%) - American Indian and Alaska Native
Geographical mobility - Same house 1 year ago (%) - Multirace
Geographical mobility - Same house 1 year ago (%) - Other Race
Geographical mobility - Moved within same county (%)
Geographical mobility - Moved within same county (%) - White
Geographical mobility - Moved within same county (%) - Black or African American
Geographical mobility - Moved within same county (%) - Asian
Geographical mobility - Moved within same county (%) - Hispanic or Latino
Geographical mobility - Moved within same county (%) - American Indian and Alaska Native
Geographical mobility - Moved within same county (%) - Multirace
Geographical mobility - Moved within same county (%) - Other Race
Geographical mobility - Moved from different county within same state (%)
Geographical mobility - Moved from different county within same state (%) - White
Geographical mobility - Moved from different county within same state (%) - Black or African American
Geographical mobility - Moved from different county within same state (%) - Asian
Geographical mobility - Moved from different county within same state (%) - Hispanic or Latino
Geographical mobility - Moved from different county within same state (%) - American Indian and Alaska Native
Geographical mobility - Moved from different county within same state (%) - Multirace
Geographical mobility - Moved from different county within same state (%) - Other Race
Geographical mobility - Moved from different state (%)
Geographical mobility - Moved from different state (%) - White
Geographical mobility - Moved from different state (%) - Black or African American
Geographical mobility - Moved from different state (%) - Asian
Geographical mobility - Moved from different state (%) - Hispanic or Latino
Geographical mobility - Moved from different state (%) - American Indian and Alaska Native
Geographical mobility - Moved from different state (%) - Multirace
Geographical mobility - Moved from different state (%) - Other Race
Geographical mobility - Moved from abroad (%)
Geographical mobility - Moved from abroad (%) - White
Geographical mobility - Moved from abroad (%) - Black or African American
Geographical mobility - Moved from abroad (%) - Asian
Geographical mobility - Moved from abroad (%) - Hispanic or Latino
Geographical mobility - Moved from abroad (%) - American Indian and Alaska Native
Geographical mobility - Moved from abroad (%) - Multirace
Geographical mobility - Moved from abroad (%) - Other Race
Place of birth for the foreign-born population - Ireland (%)
Place of birth for the foreign-born population - Denmark (%)
Place of birth for the foreign-born population - Norway (%)
Place of birth for the foreign-born population - Sweden (%)
Place of birth for the foreign-born population - United Kingdom (%)
Place of birth for the foreign-born population - England (%)
Place of birth for the foreign-born population - Scotland (%)
Place of birth for the foreign-born population - Other Northern Europe (%)
Place of birth for the foreign-born population - Austria (%)
Place of birth for the foreign-born population - Belgium (%)
Place of birth for the foreign-born population - France (%)
Place of birth for the foreign-born population - Germany (%)
Place of birth for the foreign-born population - Netherlands (%)
Place of birth for the foreign-born population - Switzerland (%)
Place of birth for the foreign-born population - Other Western Europe (%)
Place of birth for the foreign-born population - Greece (%)
Place of birth for the foreign-born population - Italy (%)
Place of birth for the foreign-born population - Portugal (%)
Place of birth for the foreign-born population - Spain (%)
Place of birth for the foreign-born population - Other Southern Europe (%)
Place of birth for the foreign-born population - Albania (%)
Place of birth for the foreign-born population - Belarus (%)
Place of birth for the foreign-born population - Bosnia and Herzegovina (%)
Place of birth for the foreign-born population - Bulgaria (%)
Place of birth for the foreign-born population - Croatia (%)
Place of birth for the foreign-born population - Czechoslovakia (%)
Place of birth for the foreign-born population - Hungary (%)
Place of birth for the foreign-born population - Latvia (%)
Place of birth for the foreign-born population - Lithuania (%)
Place of birth for the foreign-born population - North Macedonia (Macedonia) (%)
Place of birth for the foreign-born population - Moldova (%)
Place of birth for the foreign-born population - Poland (%)
Place of birth for the foreign-born population - Romania (%)
Place of birth for the foreign-born population - Russia (%)
Place of birth for the foreign-born population - Serbia (%)
Place of birth for the foreign-born population - Ukraine (%)
Place of birth for the foreign-born population - Other Eastern Europe (%)
Place of birth for the foreign-born population - China (%)
Place of birth for the foreign-born population - Hong Kong (%)
Place of birth for the foreign-born population - Taiwan (%)
Place of birth for the foreign-born population - Japan (%)
Place of birth for the foreign-born population - Korea (%)
Place of birth for the foreign-born population - Other Eastern Asia (%)
Place of birth for the foreign-born population - Afghanistan (%)
Place of birth for the foreign-born population - Bangladesh (%)
Place of birth for the foreign-born population - India (%)
Place of birth for the foreign-born population - Iran (%)
Place of birth for the foreign-born population - Kazakhstan (%)
Place of birth for the foreign-born population - Nepal (%)
Place of birth for the foreign-born population - Pakistan (%)
Place of birth for the foreign-born population - Sri Lanka (%)
Place of birth for the foreign-born population - Uzbekistan (%)
Place of birth for the foreign-born population - Other South Central Asia (%)
Place of birth for the foreign-born population - Burma (%)
Place of birth for the foreign-born population - Cambodia (%)
Place of birth for the foreign-born population - Indonesia (%)
Place of birth for the foreign-born population - Laos (%)
Place of birth for the foreign-born population - Malaysia (%)
Place of birth for the foreign-born population - Philippines (%)
Place of birth for the foreign-born population - Singapore (%)
Place of birth for the foreign-born population - Thailand (%)
Place of birth for the foreign-born population - Vietnam (%)
Place of birth for the foreign-born population - Other South Eastern Asia (%)
Place of birth for the foreign-born population - Armenia (%)
Place of birth for the foreign-born population - Iraq (%)
Place of birth for the foreign-born population - Israel (%)
Place of birth for the foreign-born population - Jordan (%)
Place of birth for the foreign-born population - Kuwait (%)
Place of birth for the foreign-born population - Lebanon (%)
Place of birth for the foreign-born population - Saudi Arabia (%)
Place of birth for the foreign-born population - Syria (%)
Place of birth for the foreign-born population - Turkey (%)
Place of birth for the foreign-born population - Yemen (%)
Place of birth for the foreign-born population - Other Western Asia (%)
Place of birth for the foreign-born population - Eritrea (%)
Place of birth for the foreign-born population - Ethiopia (%)
Place of birth for the foreign-born population - Kenya (%)
Place of birth for the foreign-born population - Somalia (%)
Place of birth for the foreign-born population - Uganda (%)
Place of birth for the foreign-born population - Zimbabwe (%)
Place of birth for the foreign-born population - Other Eastern Africa (%)
Place of birth for the foreign-born population - Cameroon (%)
Place of birth for the foreign-born population - Congo (%)
Place of birth for the foreign-born population - Democratic Republic of Congo (Zaire) (%)
Place of birth for the foreign-born population - Other Middle Africa (%)
Place of birth for the foreign-born population - Egypt (%)
Place of birth for the foreign-born population - Morocco (%)
Place of birth for the foreign-born population - Sudan (%)
Place of birth for the foreign-born population - Other Northern Africa (%)
Place of birth for the foreign-born population - South Africa (%)
Place of birth for the foreign-born population - Other Southern Africa (%)
Place of birth for the foreign-born population - Cabo Verde (%)
Place of birth for the foreign-born population - Ghana (%)
Place of birth for the foreign-born population - Liberia (%)
Place of birth for the foreign-born population - Nigeria (%)
Place of birth for the foreign-born population - Senegal (%)
Place of birth for the foreign-born population - Sierra Leone (%)
Place of birth for the foreign-born population - Other Western Africa (%)
Place of birth for the foreign-born population - Australia (%)
Place of birth for the foreign-born population - New Zealand (%)
Place of birth for the foreign-born population - Fiji (%)
Place of birth for the foreign-born population - Micronesia (%)
Place of birth for the foreign-born population - Bahamas (%)
Place of birth for the foreign-born population - Barbados (%)
Place of birth for the foreign-born population - Cuba (%)
Place of birth for the foreign-born population - Dominica (%)
Place of birth for the foreign-born population - Dominican Republic (%)
Place of birth for the foreign-born population - Grenada (%)
Place of birth for the foreign-born population - Haiti (%)
Place of birth for the foreign-born population - Jamaica (%)
Place of birth for the foreign-born population - St. Vincent and the Grenadines (%)
Place of birth for the foreign-born population - Trinidad and Tobago (%)
Place of birth for the foreign-born population - West Indies (%)
Place of birth for the foreign-born population - Other Caribbean (%)
Place of birth for the foreign-born population - Belize (%)
Place of birth for the foreign-born population - Costa Rica (%)
Place of birth for the foreign-born population - El Salvador (%)
Place of birth for the foreign-born population - Guatemala (%)
Place of birth for the foreign-born population - Honduras (%)
Place of birth for the foreign-born population - Mexico (%)
Place of birth for the foreign-born population - Nicaragua (%)
Place of birth for the foreign-born population - Panama (%)
Place of birth for the foreign-born population - Other Central America (%)
Place of birth for the foreign-born population - Argentina (%)
Place of birth for the foreign-born population - Bolivia (%)
Place of birth for the foreign-born population - Brazil (%)
Place of birth for the foreign-born population - Chile (%)
Place of birth for the foreign-born population - Colombia (%)
Place of birth for the foreign-born population - Ecuador (%)
Place of birth for the foreign-born population - Guyana (%)
Place of birth for the foreign-born population - Peru (%)
Place of birth for the foreign-born population - Uruguay (%)
Place of birth for the foreign-born population - Venezuela (%)
Place of birth for the foreign-born population - Other South America (%)
Place of birth for the foreign-born population - Canada (%)
Place of birth for the foreign-born population - Other Northern America (%)
Place of birth for the foreign-born population - Other (%)
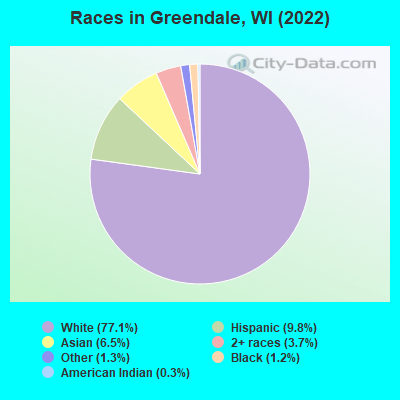
According to 2022 data, the most numerous races in Greendale, WI are White alone (11,173 residents), Hispanic (1,425 residents), and Black alone (181 residents). 87.4% of Greendale residents speak English at home. 10.3% of Greendale, WI residents are foreign-born (5.6% born in Asia, 2.4% born in Europe, 1.7% born in Latin America), which is 51.4% greater than the foreign-born rate of 5.0% across the entire state of Wisconsin.
Race distribution in Greendale
2000 2022
4,681,630 87.3% White alone 300,245 5.6% Black alone 192,921 3.6% Hispanic 87,995 1.6% Asian alone 51,921 1.0% Two or more races 43,980 0.8% American Indian alone 3,637 0.07% Other race alone 1,346 0.03% Native Hawaiian and Other
4,654,031 79.0% White alone 447,022 7.6% Hispanic 345,678 5.9% Black alone 217,532 3.7% Two or more races 172,242 2.9% Asian alone 33,762 0.6% American Indian alone 19,680 0.3% Other race alone 2,592 0.04% Native Hawaiian and Other
Income and house value in Greendale Median household income in 2022 $82,686 White non-Hispanic householders$34,143 Black householders$112,143 Some other race householders$130,336 Two or more races householders$117,799 Hispanic or Latino race householdersMedian 2022 house value $297,109 White Non-Hispanic householders $473,675 Asian householders$293,266 Some other race householders$285,580 Hispanic or Latino householders
Median age by race in Greendale
44.6 Median age for White residents44.0 45.8 28.3 Median age for Black or African American residents28.9 6.9 14.2 Median age for American Indian / Alaska Native residents2.1 13.1 30.3 Median age for Asian residents30.3 30.5 -825,688,072.6 Median age for Native Hawaiian / Pacific Islander residents-862,745,097.2 -732,444,443.7 40.0 Median age for Other race residents46.5 36.1 24.1 Median age for Two or more races residents24.9 23.4 44.8 Median age for White alone residents43.7 47.1 34.1 Median age for Hispanic or Latino residents38.2 22.8
Owner/renter occupied households by race in Greendale
House owners and renters - White residents 3,593 69.2% Owner occupied1,600 30.8% Renter occupiedHouse owners and renters - Black or African American residents 58 100.0% Renter occupiedHouse owners and renters - American Indian / Alaska Native residents 5 100.0% Owner occupiedHouse owners and renters - Asian residents 224 77.3% Owner occupied66 22.7% Renter occupiedHouse owners and renters - Other race residents 171 95.6% Owner occupied8 4.4% Renter occupiedHouse owners and renters - Two or more races residents 147 53.1% Owner occupied130 46.9% Renter occupiedHouse owners and renters - White alone residents 3,619 69.1% Owner occupied1,618 30.9% Renter occupiedHouse owners and renters - Hispanic or Latino residents 347 75.3% Owner occupied114 24.7% Renter occupied
Language usage in Greendale
English speakers - Total 87.4% of residents of Greendale speak English at home.
3.9% of residents speak Spanish at home 284 53.5% Speak English very well247 46.5% Speak English less than very well8.8% of residents speak other language at home 701 58.3% Speak English very well501 41.7% Speak English less than very well
English speakers - Born in the United States 88.5% of residents of Greendale speak English at home.
7.6% of residents speak Spanish at home 174 100.0% Speak English very well4.1% of residents speak other language at home 73 78.5% Speak English very well20 21.5% Speak English less than very well
All residents speak only English at home
English speakers - Foreign-born 17.6% of residents of Greendale speak English at home.
16.4% of residents speak Spanish at home 30 12.8% Speak English very well204 87.2% Speak English less than very well66.7% of residents speak other language at home 495 51.9% Speak English very well458 48.1% Speak English less than very well
White (Caucasian) - Speak only English Native:
100.0% (10,404)Foreign-born:
27.1% (81)
White (Caucasian) - Speak another language Native:
1.4% (148)Foreign-born:
72.4% (216)
Black or African American - Speak only English Native:
91.2% (155)Foreign-born:
55.5% (32)
Black or African American - Speak another language Native:
5.5% (9)Foreign-born:
41.4% (24)
American Indian / Alaska Native - Speak only English Native:
94.8% (21)Foreign-born:
21.3% (8)
Asian - Speak only English Native:
45.7% (71)Foreign-born:
14.6% (90)
Asian - Speak another language Native:
54.2% (85)Foreign-born:
85.3% (526)
Other race - Speak only English Native:
100.0% (212)Foreign-born:
16.4% (19)
Other race - Speak another language Native:
21.9% (46)Foreign-born:
86.4% (102)
White alone - Speak only English Native:
98.3% (10,191)Foreign-born:
20.3% (75)
White alone - Speak another language Native:
1.8% (182)Foreign-born:
80.5% (296)
Hispanic or Latino - Speak only English Native:
76.3% (860)Foreign-born:
16.8% (44)
Hispanic or Latino - Speak another language Native:
24.7% (279)Foreign-born:
84.6% (221)
Foreign-born residents in Greendale 1,492 residents are foreign born (5.6% Asia , 2.4% Europe , 1.7% Latin America ).
This city:
10.3%Wisconsin:
5.0%
Marital status for residents in Greendale Marital status - White (Caucasian) population 15 years and over
Males 30.6% Never married60.6% Now married0.0% Separated2.3% Widowed6.6% DivorcedFemales 24.5% Never married48.6% Now married1.5% Separated13.2% Widowed12.2% DivorcedWomen who gave birth in the past 12 months Now married:
36.5% (18)Unmarried:
63.5% (30)
Women who did not give birth in the past 12 months Now married:
46.4% (1,084)Unmarried:
53.6% (1,250)
Marital status - Black or African American population 15 years and over
Males 78.1% Never married0.0% Now married0.0% Separated3.8% Widowed18.1% DivorcedFemales 2.4% Never married0.0% Now married0.0% Separated0.0% Widowed97.6% DivorcedWomen who did not give birth in the past 12 months Now married:
0.0% (0)Unmarried:
100.0% (39)
Marital status - American Indian / Alaska Native population 15 years and over
Males 50.0% Never married50.0% Now married0.0% Separated0.0% Widowed0.0% DivorcedFemales 35.3% Never married64.7% Now married0.0% Separated0.0% Widowed0.0% DivorcedWomen who did not give birth in the past 12 months Now married:
50.0% (8)Unmarried:
50.0% (8)
Marital status - Asian population 15 years and over
Males 34.7% Never married47.3% Now married0.0% Separated14.0% Widowed4.0% DivorcedFemales 26.3% Never married61.4% Now married0.0% Separated8.1% Widowed4.2% DivorcedWomen who gave birth in the past 12 months Now married:
100.0% (12)Unmarried:
0.0% (0)
Women who did not give birth in the past 12 months Now married:
50.9% (90)Unmarried:
49.1% (86)
Marital status - Other race population 15 years and over
Males 1.1% Never married98.9% Now married0.0% Separated0.0% Widowed0.0% DivorcedFemales 0.0% Never married100.0% Now married0.0% Separated0.0% Widowed0.0% DivorcedWomen who did not give birth in the past 12 months Now married:
100.0% (105)Unmarried:
0.0% (0)
Marital status - Two or more races population 15 years and over
Males 40.4% Never married55.2% Now married0.0% Separated0.0% Widowed4.4% DivorcedFemales 45.4% Never married54.6% Now married0.0% Separated0.0% Widowed0.0% DivorcedWomen who did not give birth in the past 12 months Now married:
32.6% (96)Unmarried:
67.4% (198)
Marital status - White alone, not Hispanic / Latino population 15 years and over
Males 31.6% Never married59.2% Now married0.0% Separated2.3% Widowed6.8% DivorcedFemales 23.8% Never married48.7% Now married1.5% Separated13.5% Widowed12.4% DivorcedWomen who gave birth in the past 12 months Now married:
36.5% (18)Unmarried:
63.5% (32)
Women who did not give birth in the past 12 months Now married:
46.6% (1,098)Unmarried:
53.4% (1,258)
Marital status - Hispanic or Latino population 15 years and over
Males 13.2% Never married86.8% Now married0.0% Separated0.0% Widowed0.0% DivorcedFemales 31.8% Never married64.9% Now married0.0% Separated0.0% Widowed3.3% DivorcedWomen who did not give birth in the past 12 months Now married:
57.0% (244)Unmarried:
43.0% (185)
Ancestries in Greendale
2,094 30.6% German880 12.9% Polish344 5.0% English237 3.5% Irish204 3.0% European168 2.5% Italian143 2.1% Norwegian120 1.8% Ukrainian103 1.5% American98 1.4% South African88 1.3% Finnish87 1.3% Swedish75 1.1% African73 1.1% Croatian64 0.9% Slovene32 0.5% Scottish31 0.5% Danish29 0.4% Greek26 0.4% Yugoslavian25 0.4% Eastern European25 0.4% Romanian22 0.3% Dutch22 0.3% Czech20 0.3% Scandinavian16 0.2% Hungarian16 0.2% Jordanian15 0.2% French12 0.2% Canadian9 0.1% Northern European9 0.1% Belgian8 0.1% British7 0.1% Bulgarian5 0.07% Slovak2 0.03% Arab
Children Nativity (place of birth) in Greendale
Children under 6 years - Living with two parents Both parents native 365 100.0% NativeBoth parents foreign-born 238 100.0% NativeOne native, one foreign-born parent 12 100.0% NativeChildren under 6 years - Living with one parent Native parent 173 100.0% NativeForeign-born parent 6 3.5% Native164 96.5% Foreign-bornChildren 6 to 17 years - Living with two parents Both parents native 1,424 100.0% NativeBoth parents foreign-born 258 93.6% Native18 6.4% Foreign-bornOne native, one foreign-born parent 161 100.0% NativeChildren 6 to 17 years - Living with one parent Native parent 616 100.0% NativeForeign-born parent 64 53.3% Native56 46.7% Foreign-born
Grandparents responsible for own grandchildren in Greendale
Grandparents (30 to 59 years) White / Caucasian 7 30.9% Responsible for grandchildren17 69.1% Not responsible for grandchildrenAsian 2 100.0% Not responsible for grandchildrenWhite alone, not Hispanic / Latino 10 65.1% Responsible for grandchildren5 34.9% Not responsible for grandchildrenHispanic or Latino 13 100.0% Not responsible for grandchildren
Grandparents (60 years and over) White / Caucasian 0 0.7% Responsible for grandchildren65 99.3% Not responsible for grandchildrenAsian 48 100.0% Not responsible for grandchildrenWhite alone, not Hispanic / Latino 0 0.6% Responsible for grandchildren74 99.4% Not responsible for grandchildren