Races in Hayden, Idaho (ID) Detailed Stats
Data:
Races - White alone (%)
Races - White alone (% change since 2000)
Races - Black alone (%)
Races - Black alone (% change since 2000)
Races - American Indian alone (%)
Races - American Indian alone (% change since 2000)
Races - Asian alone (%)
Races - Asian alone (% change since 2000)
Races - Hispanic (%)
Races - Hispanic (% change since 2000)
Races - Native Hawaiian and Other Pacific Islander alone (%)
Races - Native Hawaiian and Other Pacific Islander alone (% change since 2000)
Races - Two or more races(%)
Races - Two or more races(% change since 2000)
Races - Other race alone (%)
Races - Other race alone (% change since 2000)
Racial diversity
Place of birth - Born in state of residence (%)
Place of birth - Born in state of residence (%) - White
Place of birth - Born in state of residence (%) - Black or African American
Place of birth - Born in state of residence (%) - Asian
Place of birth - Born in state of residence (%) - Hispanic or Latino
Place of birth - Born in state of residence (%) - American Indian and Alaska Native
Place of birth - Born in state of residence (%) - Multirace
Place of birth - Born in state of residence (%) - Other Race
Place of birth - Born in other state (%)
Place of birth - Born in other state (%) - White
Place of birth - Born in other state (%) - Black or African American
Place of birth - Born in other state (%) - Asian
Place of birth - Born in other state (%) - Hispanic or Latino
Place of birth - Born in other state (%) - American Indian and Alaska Native
Place of birth - Born in other state (%) - Multirace
Place of birth - Born in other state (%) - Other Race
Place of birth - Native, outside of US (%)
Place of birth - Native, outside of US (%) - White
Place of birth - Native, outside of US (%) - Black or African American
Place of birth - Native, outside of US (%) - Asian
Place of birth - Native, outside of US (%) - Hispanic or Latino
Place of birth - Native, outside of US (%) - American Indian and Alaska Native
Place of birth - Native, outside of US (%) - Multirace
Place of birth - Native, outside of US (%) - Other Race
Place of birth - Foreign born (%)
Place of birth - Foreign born (%) - White
Place of birth - Foreign born (%) - Black or African American
Place of birth - Foreign born (%) - Asian
Place of birth - Foreign born (%) - Hispanic or Latino
Place of birth - Foreign born (%) - American Indian and Alaska Native
Place of birth - Foreign born (%) - Multirace
Place of birth - Foreign born (%) - Other Race
Residents speaking English at home (%)
Residents speaking English at home - Born in the United States (%)
Residents speaking English at home - Native, born elsewhere (%)
Residents speaking English at home - Foreign born (%)
Residents speaking Spanish at home (%)
Residents speaking Spanish at home - Born in the United States (%)
Residents speaking Spanish at home - Native, born elsewhere (%)
Residents speaking Spanish at home - Foreign born (%)
Residents speaking other language at home (%)
Residents speaking other language at home - Born in the United States (%)
Residents speaking other language at home - Native, born elsewhere (%)
Residents speaking other language at home - Foreign born (%)
Marital status - Never married (%)
Marital status - Now married (%)
Marital status - Separated (%)
Marital status - Widowed (%)
Marital status - Divorced (%)
Ancestries Reported - Arab (%)
Ancestries Reported - Czech (%)
Ancestries Reported - Danish (%)
Ancestries Reported - Dutch (%)
Ancestries Reported - English (%)
Ancestries Reported - French (%)
Ancestries Reported - French Canadian (%)
Ancestries Reported - German (%)
Ancestries Reported - Greek (%)
Ancestries Reported - Hungarian (%)
Ancestries Reported - Irish (%)
Ancestries Reported - Italian (%)
Ancestries Reported - Lithuanian (%)
Ancestries Reported - Norwegian (%)
Ancestries Reported - Polish (%)
Ancestries Reported - Portuguese (%)
Ancestries Reported - Russian (%)
Ancestries Reported - Scotch-Irish (%)
Ancestries Reported - Scottish (%)
Ancestries Reported - Slovak (%)
Ancestries Reported - Subsaharan African (%)
Ancestries Reported - Swedish (%)
Ancestries Reported - Swiss (%)
Ancestries Reported - Ukrainian (%)
Ancestries Reported - United States (%)
Ancestries Reported - Welsh (%)
Ancestries Reported - West Indian (%)
Ancestries Reported - Other (%)
Geographical mobility - Same house 1 year ago (%)
Geographical mobility - Same house 1 year ago (%) - White
Geographical mobility - Same house 1 year ago (%) - Black or African American
Geographical mobility - Same house 1 year ago (%) - Asian
Geographical mobility - Same house 1 year ago (%) - Hispanic or Latino
Geographical mobility - Same house 1 year ago (%) - American Indian and Alaska Native
Geographical mobility - Same house 1 year ago (%) - Multirace
Geographical mobility - Same house 1 year ago (%) - Other Race
Geographical mobility - Moved within same county (%)
Geographical mobility - Moved within same county (%) - White
Geographical mobility - Moved within same county (%) - Black or African American
Geographical mobility - Moved within same county (%) - Asian
Geographical mobility - Moved within same county (%) - Hispanic or Latino
Geographical mobility - Moved within same county (%) - American Indian and Alaska Native
Geographical mobility - Moved within same county (%) - Multirace
Geographical mobility - Moved within same county (%) - Other Race
Geographical mobility - Moved from different county within same state (%)
Geographical mobility - Moved from different county within same state (%) - White
Geographical mobility - Moved from different county within same state (%) - Black or African American
Geographical mobility - Moved from different county within same state (%) - Asian
Geographical mobility - Moved from different county within same state (%) - Hispanic or Latino
Geographical mobility - Moved from different county within same state (%) - American Indian and Alaska Native
Geographical mobility - Moved from different county within same state (%) - Multirace
Geographical mobility - Moved from different county within same state (%) - Other Race
Geographical mobility - Moved from different state (%)
Geographical mobility - Moved from different state (%) - White
Geographical mobility - Moved from different state (%) - Black or African American
Geographical mobility - Moved from different state (%) - Asian
Geographical mobility - Moved from different state (%) - Hispanic or Latino
Geographical mobility - Moved from different state (%) - American Indian and Alaska Native
Geographical mobility - Moved from different state (%) - Multirace
Geographical mobility - Moved from different state (%) - Other Race
Geographical mobility - Moved from abroad (%)
Geographical mobility - Moved from abroad (%) - White
Geographical mobility - Moved from abroad (%) - Black or African American
Geographical mobility - Moved from abroad (%) - Asian
Geographical mobility - Moved from abroad (%) - Hispanic or Latino
Geographical mobility - Moved from abroad (%) - American Indian and Alaska Native
Geographical mobility - Moved from abroad (%) - Multirace
Geographical mobility - Moved from abroad (%) - Other Race
Place of birth for the foreign-born population - Ireland (%)
Place of birth for the foreign-born population - Denmark (%)
Place of birth for the foreign-born population - Norway (%)
Place of birth for the foreign-born population - Sweden (%)
Place of birth for the foreign-born population - United Kingdom (%)
Place of birth for the foreign-born population - England (%)
Place of birth for the foreign-born population - Scotland (%)
Place of birth for the foreign-born population - Other Northern Europe (%)
Place of birth for the foreign-born population - Austria (%)
Place of birth for the foreign-born population - Belgium (%)
Place of birth for the foreign-born population - France (%)
Place of birth for the foreign-born population - Germany (%)
Place of birth for the foreign-born population - Netherlands (%)
Place of birth for the foreign-born population - Switzerland (%)
Place of birth for the foreign-born population - Other Western Europe (%)
Place of birth for the foreign-born population - Greece (%)
Place of birth for the foreign-born population - Italy (%)
Place of birth for the foreign-born population - Portugal (%)
Place of birth for the foreign-born population - Spain (%)
Place of birth for the foreign-born population - Other Southern Europe (%)
Place of birth for the foreign-born population - Albania (%)
Place of birth for the foreign-born population - Belarus (%)
Place of birth for the foreign-born population - Bosnia and Herzegovina (%)
Place of birth for the foreign-born population - Bulgaria (%)
Place of birth for the foreign-born population - Croatia (%)
Place of birth for the foreign-born population - Czechoslovakia (%)
Place of birth for the foreign-born population - Hungary (%)
Place of birth for the foreign-born population - Latvia (%)
Place of birth for the foreign-born population - Lithuania (%)
Place of birth for the foreign-born population - North Macedonia (Macedonia) (%)
Place of birth for the foreign-born population - Moldova (%)
Place of birth for the foreign-born population - Poland (%)
Place of birth for the foreign-born population - Romania (%)
Place of birth for the foreign-born population - Russia (%)
Place of birth for the foreign-born population - Serbia (%)
Place of birth for the foreign-born population - Ukraine (%)
Place of birth for the foreign-born population - Other Eastern Europe (%)
Place of birth for the foreign-born population - China (%)
Place of birth for the foreign-born population - Hong Kong (%)
Place of birth for the foreign-born population - Taiwan (%)
Place of birth for the foreign-born population - Japan (%)
Place of birth for the foreign-born population - Korea (%)
Place of birth for the foreign-born population - Other Eastern Asia (%)
Place of birth for the foreign-born population - Afghanistan (%)
Place of birth for the foreign-born population - Bangladesh (%)
Place of birth for the foreign-born population - India (%)
Place of birth for the foreign-born population - Iran (%)
Place of birth for the foreign-born population - Kazakhstan (%)
Place of birth for the foreign-born population - Nepal (%)
Place of birth for the foreign-born population - Pakistan (%)
Place of birth for the foreign-born population - Sri Lanka (%)
Place of birth for the foreign-born population - Uzbekistan (%)
Place of birth for the foreign-born population - Other South Central Asia (%)
Place of birth for the foreign-born population - Burma (%)
Place of birth for the foreign-born population - Cambodia (%)
Place of birth for the foreign-born population - Indonesia (%)
Place of birth for the foreign-born population - Laos (%)
Place of birth for the foreign-born population - Malaysia (%)
Place of birth for the foreign-born population - Philippines (%)
Place of birth for the foreign-born population - Singapore (%)
Place of birth for the foreign-born population - Thailand (%)
Place of birth for the foreign-born population - Vietnam (%)
Place of birth for the foreign-born population - Other South Eastern Asia (%)
Place of birth for the foreign-born population - Armenia (%)
Place of birth for the foreign-born population - Iraq (%)
Place of birth for the foreign-born population - Israel (%)
Place of birth for the foreign-born population - Jordan (%)
Place of birth for the foreign-born population - Kuwait (%)
Place of birth for the foreign-born population - Lebanon (%)
Place of birth for the foreign-born population - Saudi Arabia (%)
Place of birth for the foreign-born population - Syria (%)
Place of birth for the foreign-born population - Turkey (%)
Place of birth for the foreign-born population - Yemen (%)
Place of birth for the foreign-born population - Other Western Asia (%)
Place of birth for the foreign-born population - Eritrea (%)
Place of birth for the foreign-born population - Ethiopia (%)
Place of birth for the foreign-born population - Kenya (%)
Place of birth for the foreign-born population - Somalia (%)
Place of birth for the foreign-born population - Uganda (%)
Place of birth for the foreign-born population - Zimbabwe (%)
Place of birth for the foreign-born population - Other Eastern Africa (%)
Place of birth for the foreign-born population - Cameroon (%)
Place of birth for the foreign-born population - Congo (%)
Place of birth for the foreign-born population - Democratic Republic of Congo (Zaire) (%)
Place of birth for the foreign-born population - Other Middle Africa (%)
Place of birth for the foreign-born population - Egypt (%)
Place of birth for the foreign-born population - Morocco (%)
Place of birth for the foreign-born population - Sudan (%)
Place of birth for the foreign-born population - Other Northern Africa (%)
Place of birth for the foreign-born population - South Africa (%)
Place of birth for the foreign-born population - Other Southern Africa (%)
Place of birth for the foreign-born population - Cabo Verde (%)
Place of birth for the foreign-born population - Ghana (%)
Place of birth for the foreign-born population - Liberia (%)
Place of birth for the foreign-born population - Nigeria (%)
Place of birth for the foreign-born population - Senegal (%)
Place of birth for the foreign-born population - Sierra Leone (%)
Place of birth for the foreign-born population - Other Western Africa (%)
Place of birth for the foreign-born population - Australia (%)
Place of birth for the foreign-born population - New Zealand (%)
Place of birth for the foreign-born population - Fiji (%)
Place of birth for the foreign-born population - Micronesia (%)
Place of birth for the foreign-born population - Bahamas (%)
Place of birth for the foreign-born population - Barbados (%)
Place of birth for the foreign-born population - Cuba (%)
Place of birth for the foreign-born population - Dominica (%)
Place of birth for the foreign-born population - Dominican Republic (%)
Place of birth for the foreign-born population - Grenada (%)
Place of birth for the foreign-born population - Haiti (%)
Place of birth for the foreign-born population - Jamaica (%)
Place of birth for the foreign-born population - St. Vincent and the Grenadines (%)
Place of birth for the foreign-born population - Trinidad and Tobago (%)
Place of birth for the foreign-born population - West Indies (%)
Place of birth for the foreign-born population - Other Caribbean (%)
Place of birth for the foreign-born population - Belize (%)
Place of birth for the foreign-born population - Costa Rica (%)
Place of birth for the foreign-born population - El Salvador (%)
Place of birth for the foreign-born population - Guatemala (%)
Place of birth for the foreign-born population - Honduras (%)
Place of birth for the foreign-born population - Mexico (%)
Place of birth for the foreign-born population - Nicaragua (%)
Place of birth for the foreign-born population - Panama (%)
Place of birth for the foreign-born population - Other Central America (%)
Place of birth for the foreign-born population - Argentina (%)
Place of birth for the foreign-born population - Bolivia (%)
Place of birth for the foreign-born population - Brazil (%)
Place of birth for the foreign-born population - Chile (%)
Place of birth for the foreign-born population - Colombia (%)
Place of birth for the foreign-born population - Ecuador (%)
Place of birth for the foreign-born population - Guyana (%)
Place of birth for the foreign-born population - Peru (%)
Place of birth for the foreign-born population - Uruguay (%)
Place of birth for the foreign-born population - Venezuela (%)
Place of birth for the foreign-born population - Other South America (%)
Place of birth for the foreign-born population - Canada (%)
Place of birth for the foreign-born population - Other Northern America (%)
Place of birth for the foreign-born population - Other (%)
Latest news about races in Hayden, ID collected exclusively by city-data.com from local newspapers, TV, and radio stations
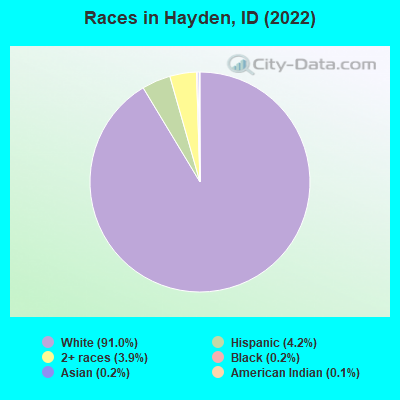
According to 2022 data, the most numerous races in Hayden, ID are White alone (15,125 residents), Hispanic (698 residents), and Two or more races (653 residents). 97.7% of Hayden residents speak English at home. 2.2% of Hayden, ID residents are foreign-born (0.8% born in North America, 0.8% born in Europe, 0.4% born in Latin America), which is 127.1% less than the foreign-born rate of 5.0% across the entire state of Idaho.
Race distribution in Hayden
2000 2022
1,139,291 88.0% White alone 101,690 7.9% Hispanic 18,261 1.4% Two or more races 15,789 1.2% American Indian alone 11,641 0.9% Asian alone 4,889 0.4% Black alone 1,192 0.09% Other race alone 1,200 0.09% Native Hawaiian and Other
1,531,219 79.0% White alone 261,921 13.5% Hispanic 81,112 4.2% Two or more races 25,174 1.3% Asian alone 15,825 0.8% American Indian alone 11,868 0.6% Black alone 8,752 0.5% Other race alone 3,162 0.2% Native Hawaiian and Other
Income and house value in Hayden Median household income in 2022 $75,955 White non-Hispanic householders$69,979 Two or more races householders$91,601 Hispanic or Latino race householdersMedian 2022 house value $548,919 White Non-Hispanic householders$630,020 American Indian or Alaska Native householders$496,227 Two or more races householders$488,437 Hispanic or Latino householders
Median age by race in Hayden
43.8 Median age for White residents40.0 48.8 35.5 Median age for Black or African American residents-1,130,434,781.5 -869,696,968.8 41.1 Median age for American Indian / Alaska Native residents-758,685,445.3 41.1 -665,151,514.5 Median age for Asian residents-1,215,252,151.3 -571,032,570.5 -393,939,393.5 Median age for Native Hawaiian / Pacific Islander residents-355,119,825.4 -679,245,282.3 98.4 Median age for Other race residents21.8 -1,058,721,933.3 22.0 Median age for Two or more races residents17.2 22.9 43.8 Median age for White alone residents40.5 48.6 19.4 Median age for Hispanic or Latino residents15.1 33.0
Owner/renter occupied households by race in Hayden
House owners and renters - White residents 4,998 81.7% Owner occupied1,118 18.3% Renter occupiedHouse owners and renters - American Indian / Alaska Native residents 40 100.0% Renter occupiedHouse owners and renters - Other race residents 8 34.2% Owner occupied15 65.8% Renter occupiedHouse owners and renters - Two or more races residents 108 43.6% Owner occupied140 56.4% Renter occupiedHouse owners and renters - White alone residents 5,008 82.8% Owner occupied1,042 17.2% Renter occupiedHouse owners and renters - Hispanic or Latino residents 22 9.7% Owner occupied202 90.3% Renter occupied
Language usage in Hayden
English speakers - Total 97.7% of residents of Hayden speak English at home.
1.2% of residents speak Spanish at home 128 69.2% Speak English very well57 30.8% Speak English less than very well0.8% of residents speak other language at home 120 100.0% Speak English very well
English speakers - Born in the United States 97.6% of residents of Hayden speak English at home.
1.5% of residents speak Spanish at home 120 77.4% Speak English very well35 22.6% Speak English less than very well0.8% of residents speak other language at home 76 100.0% Speak English very well
English speakers - Native, born elsewhere 63.6% of residents of Hayden speak English at home.
English speakers - Foreign-born 78.1% of residents of Hayden speak English at home.
16.3% of residents speak Spanish at home 6 10.3% Speak English very well52 89.7% Speak English less than very well6.5% of residents speak other language at home 23 100.0% Speak English very well
White (Caucasian) - Speak only English Native:
98.4% (13,817)Foreign-born:
100.0% (231)
White (Caucasian) - Speak another language Native:
1.5% (213)Foreign-born:
6.4% (15)
Other race - Speak only English Native:
56.5% (18)Foreign-born:
86.7% (19)
Other race - Speak another language Native:
44.3% (14)Foreign-born:
20.9% (4)
White alone - Speak only English Native:
98.3% (13,848)Foreign-born:
87.9% (238)
White alone - Speak another language Native:
1.6% (225)Foreign-born:
10.9% (29)
Hispanic or Latino - Speak only English Native:
85.8% (438)Foreign-born:
26.3% (18)
Hispanic or Latino - Speak another language Native:
15.0% (76)Foreign-born:
76.0% (52)
Foreign-born residents in Hayden 366 residents are foreign born (0.8% North America , 0.8% Europe , 0.4% Latin America ).
Marital status for residents in Hayden Marital status - White (Caucasian) population 15 years and over
Males 24.6% Never married65.3% Now married0.4% Separated0.9% Widowed8.8% DivorcedFemales 17.2% Never married56.0% Now married0.7% Separated10.1% Widowed16.0% DivorcedWomen who gave birth in the past 12 months Now married:
42.3% (59)Unmarried:
57.7% (81)
Women who did not give birth in the past 12 months Now married:
60.2% (1,756)Unmarried:
39.8% (1,161)
Marital status - Black or African American population 15 years and over
Males 73.7% Never married26.3% Now married0.0% Separated0.0% Widowed0.0% DivorcedFemales 100.0% Never married0.0% Now married0.0% Separated0.0% Widowed0.0% DivorcedWomen who did not give birth in the past 12 months Now married:
0.0% (0)Unmarried:
100.0% (5)
Marital status - Other race population 15 years and over
Males 56.2% Never married43.8% Now married0.0% Separated0.0% Widowed0.0% DivorcedFemales 48.0% Never married0.0% Now married0.0% Separated52.0% Widowed0.0% DivorcedMarital status - Two or more races population 15 years and over
Males 35.0% Never married53.9% Now married2.5% Separated0.0% Widowed8.6% DivorcedFemales 72.3% Never married21.9% Now married0.0% Separated0.0% Widowed5.8% DivorcedWomen who did not give birth in the past 12 months Now married:
17.5% (60)Unmarried:
82.5% (281)
Marital status - White alone, not Hispanic / Latino population 15 years and over
Males 24.0% Never married65.8% Now married0.4% Separated0.9% Widowed8.9% DivorcedFemales 17.3% Never married55.7% Now married0.7% Separated10.2% Widowed16.1% DivorcedWomen who gave birth in the past 12 months Now married:
42.3% (60)Unmarried:
57.7% (82)
Women who did not give birth in the past 12 months Now married:
59.5% (1,739)Unmarried:
40.5% (1,183)
Marital status - Hispanic or Latino population 15 years and over
Males 80.7% Never married19.3% Now married0.0% Separated0.0% Widowed0.0% DivorcedFemales 51.7% Never married42.2% Now married0.0% Separated6.2% Widowed0.0% DivorcedWomen who did not give birth in the past 12 months Now married:
41.7% (75)Unmarried:
58.3% (104)
Ancestries in Hayden
1,004 15.5% German880 13.6% American767 11.8% Irish543 8.4% English434 6.7% Scottish343 5.3% Norwegian341 5.3% European223 3.4% Italian207 3.2% Swedish100 1.5% British98 1.5% French89 1.4% Scandinavian82 1.3% French Canadian77 1.2% Canadian74 1.1% Polish48 0.7% Finnish48 0.7% Greek47 0.7% Scotch-Irish42 0.6% Swiss33 0.5% Danish22 0.3% Northern European18 0.3% Pennsylvania German11 0.2% Nigerian7 0.1% Eastern European5 0.08% Portuguese
Geographical mobility in Hayden Same house 1 year ago 12,387 83.5% White (Caucasian)37 86.2% Black or African American106 100.0% American Indian / Alaska Native26 100.0% Asian47 89.5% Other race956 79.1% Two or more races12,508 84.1% White alone, not Hispanic / Latino529 75.3% Hispanic or LatinoMoved within same county 1,107 7.5% White / Caucasian7 15.3% Black or African American95 7.9% Two or more races1,161 7.8% White alone, not Hispanic / LatinoMoved within same state 316 2.1% White / Caucasian17 1.4% Two or more races188 1.3% White alone, not Hispanic / Latino108 15.4% Hispanic or LatinoMoved from different state 1,010 6.8% White / Caucasian101 8.3% Two or more races977 6.6% White alone, not Hispanic / Latino56 8.0% Hispanic or LatinoMoved from abroad 65 0.4% White8 15.2% Other race65 0.4% White alone, not Hispanic / Latino7 1.0% Hispanic or Latino
Children Nativity (place of birth) in Hayden
Children under 6 years - Living with two parents Both parents native 953 100.0% NativeChildren under 6 years - Living with one parent Native parent 155 100.0% Native
Children 6 to 17 years - Living with two parents Both parents native 1,768 99.5% Native9 0.5% Foreign-bornOne native, one foreign-born parent 72 100.0% NativeChildren 6 to 17 years - Living with one parent Native parent 322 100.0% Native
Grandparents responsible for own grandchildren in Hayden
Grandparents (30 to 59 years) White / Caucasian 160 71.5% Responsible for grandchildren64 28.5% Not responsible for grandchildrenWhite alone, not Hispanic / Latino 172 72.9% Responsible for grandchildren64 27.1% Not responsible for grandchildrenGrandparents (60 years and over) White / Caucasian 39 19.8% Responsible for grandchildren159 80.2% Not responsible for grandchildrenWhite alone, not Hispanic / Latino 39 19.2% Responsible for grandchildren165 80.8% Not responsible for grandchildren