Races in Lake Grove, New York (NY) Detailed Stats
Data:
Races - White alone (%)
Races - White alone (% change since 2000)
Races - Black alone (%)
Races - Black alone (% change since 2000)
Races - American Indian alone (%)
Races - American Indian alone (% change since 2000)
Races - Asian alone (%)
Races - Asian alone (% change since 2000)
Races - Hispanic (%)
Races - Hispanic (% change since 2000)
Races - Native Hawaiian and Other Pacific Islander alone (%)
Races - Native Hawaiian and Other Pacific Islander alone (% change since 2000)
Races - Two or more races(%)
Races - Two or more races(% change since 2000)
Races - Other race alone (%)
Races - Other race alone (% change since 2000)
Racial diversity
Place of birth - Born in state of residence (%)
Place of birth - Born in state of residence (%) - White
Place of birth - Born in state of residence (%) - Black or African American
Place of birth - Born in state of residence (%) - Asian
Place of birth - Born in state of residence (%) - Hispanic or Latino
Place of birth - Born in state of residence (%) - American Indian and Alaska Native
Place of birth - Born in state of residence (%) - Multirace
Place of birth - Born in state of residence (%) - Other Race
Place of birth - Born in other state (%)
Place of birth - Born in other state (%) - White
Place of birth - Born in other state (%) - Black or African American
Place of birth - Born in other state (%) - Asian
Place of birth - Born in other state (%) - Hispanic or Latino
Place of birth - Born in other state (%) - American Indian and Alaska Native
Place of birth - Born in other state (%) - Multirace
Place of birth - Born in other state (%) - Other Race
Place of birth - Native, outside of US (%)
Place of birth - Native, outside of US (%) - White
Place of birth - Native, outside of US (%) - Black or African American
Place of birth - Native, outside of US (%) - Asian
Place of birth - Native, outside of US (%) - Hispanic or Latino
Place of birth - Native, outside of US (%) - American Indian and Alaska Native
Place of birth - Native, outside of US (%) - Multirace
Place of birth - Native, outside of US (%) - Other Race
Place of birth - Foreign born (%)
Place of birth - Foreign born (%) - White
Place of birth - Foreign born (%) - Black or African American
Place of birth - Foreign born (%) - Asian
Place of birth - Foreign born (%) - Hispanic or Latino
Place of birth - Foreign born (%) - American Indian and Alaska Native
Place of birth - Foreign born (%) - Multirace
Place of birth - Foreign born (%) - Other Race
Residents speaking English at home (%)
Residents speaking English at home - Born in the United States (%)
Residents speaking English at home - Native, born elsewhere (%)
Residents speaking English at home - Foreign born (%)
Residents speaking Spanish at home (%)
Residents speaking Spanish at home - Born in the United States (%)
Residents speaking Spanish at home - Native, born elsewhere (%)
Residents speaking Spanish at home - Foreign born (%)
Residents speaking other language at home (%)
Residents speaking other language at home - Born in the United States (%)
Residents speaking other language at home - Native, born elsewhere (%)
Residents speaking other language at home - Foreign born (%)
Marital status - Never married (%)
Marital status - Now married (%)
Marital status - Separated (%)
Marital status - Widowed (%)
Marital status - Divorced (%)
Ancestries Reported - Arab (%)
Ancestries Reported - Czech (%)
Ancestries Reported - Danish (%)
Ancestries Reported - Dutch (%)
Ancestries Reported - English (%)
Ancestries Reported - French (%)
Ancestries Reported - French Canadian (%)
Ancestries Reported - German (%)
Ancestries Reported - Greek (%)
Ancestries Reported - Hungarian (%)
Ancestries Reported - Irish (%)
Ancestries Reported - Italian (%)
Ancestries Reported - Lithuanian (%)
Ancestries Reported - Norwegian (%)
Ancestries Reported - Polish (%)
Ancestries Reported - Portuguese (%)
Ancestries Reported - Russian (%)
Ancestries Reported - Scotch-Irish (%)
Ancestries Reported - Scottish (%)
Ancestries Reported - Slovak (%)
Ancestries Reported - Subsaharan African (%)
Ancestries Reported - Swedish (%)
Ancestries Reported - Swiss (%)
Ancestries Reported - Ukrainian (%)
Ancestries Reported - United States (%)
Ancestries Reported - Welsh (%)
Ancestries Reported - West Indian (%)
Ancestries Reported - Other (%)
Geographical mobility - Same house 1 year ago (%)
Geographical mobility - Same house 1 year ago (%) - White
Geographical mobility - Same house 1 year ago (%) - Black or African American
Geographical mobility - Same house 1 year ago (%) - Asian
Geographical mobility - Same house 1 year ago (%) - Hispanic or Latino
Geographical mobility - Same house 1 year ago (%) - American Indian and Alaska Native
Geographical mobility - Same house 1 year ago (%) - Multirace
Geographical mobility - Same house 1 year ago (%) - Other Race
Geographical mobility - Moved within same county (%)
Geographical mobility - Moved within same county (%) - White
Geographical mobility - Moved within same county (%) - Black or African American
Geographical mobility - Moved within same county (%) - Asian
Geographical mobility - Moved within same county (%) - Hispanic or Latino
Geographical mobility - Moved within same county (%) - American Indian and Alaska Native
Geographical mobility - Moved within same county (%) - Multirace
Geographical mobility - Moved within same county (%) - Other Race
Geographical mobility - Moved from different county within same state (%)
Geographical mobility - Moved from different county within same state (%) - White
Geographical mobility - Moved from different county within same state (%) - Black or African American
Geographical mobility - Moved from different county within same state (%) - Asian
Geographical mobility - Moved from different county within same state (%) - Hispanic or Latino
Geographical mobility - Moved from different county within same state (%) - American Indian and Alaska Native
Geographical mobility - Moved from different county within same state (%) - Multirace
Geographical mobility - Moved from different county within same state (%) - Other Race
Geographical mobility - Moved from different state (%)
Geographical mobility - Moved from different state (%) - White
Geographical mobility - Moved from different state (%) - Black or African American
Geographical mobility - Moved from different state (%) - Asian
Geographical mobility - Moved from different state (%) - Hispanic or Latino
Geographical mobility - Moved from different state (%) - American Indian and Alaska Native
Geographical mobility - Moved from different state (%) - Multirace
Geographical mobility - Moved from different state (%) - Other Race
Geographical mobility - Moved from abroad (%)
Geographical mobility - Moved from abroad (%) - White
Geographical mobility - Moved from abroad (%) - Black or African American
Geographical mobility - Moved from abroad (%) - Asian
Geographical mobility - Moved from abroad (%) - Hispanic or Latino
Geographical mobility - Moved from abroad (%) - American Indian and Alaska Native
Geographical mobility - Moved from abroad (%) - Multirace
Geographical mobility - Moved from abroad (%) - Other Race
Place of birth for the foreign-born population - Ireland (%)
Place of birth for the foreign-born population - Denmark (%)
Place of birth for the foreign-born population - Norway (%)
Place of birth for the foreign-born population - Sweden (%)
Place of birth for the foreign-born population - United Kingdom (%)
Place of birth for the foreign-born population - England (%)
Place of birth for the foreign-born population - Scotland (%)
Place of birth for the foreign-born population - Other Northern Europe (%)
Place of birth for the foreign-born population - Austria (%)
Place of birth for the foreign-born population - Belgium (%)
Place of birth for the foreign-born population - France (%)
Place of birth for the foreign-born population - Germany (%)
Place of birth for the foreign-born population - Netherlands (%)
Place of birth for the foreign-born population - Switzerland (%)
Place of birth for the foreign-born population - Other Western Europe (%)
Place of birth for the foreign-born population - Greece (%)
Place of birth for the foreign-born population - Italy (%)
Place of birth for the foreign-born population - Portugal (%)
Place of birth for the foreign-born population - Spain (%)
Place of birth for the foreign-born population - Other Southern Europe (%)
Place of birth for the foreign-born population - Albania (%)
Place of birth for the foreign-born population - Belarus (%)
Place of birth for the foreign-born population - Bosnia and Herzegovina (%)
Place of birth for the foreign-born population - Bulgaria (%)
Place of birth for the foreign-born population - Croatia (%)
Place of birth for the foreign-born population - Czechoslovakia (%)
Place of birth for the foreign-born population - Hungary (%)
Place of birth for the foreign-born population - Latvia (%)
Place of birth for the foreign-born population - Lithuania (%)
Place of birth for the foreign-born population - North Macedonia (Macedonia) (%)
Place of birth for the foreign-born population - Moldova (%)
Place of birth for the foreign-born population - Poland (%)
Place of birth for the foreign-born population - Romania (%)
Place of birth for the foreign-born population - Russia (%)
Place of birth for the foreign-born population - Serbia (%)
Place of birth for the foreign-born population - Ukraine (%)
Place of birth for the foreign-born population - Other Eastern Europe (%)
Place of birth for the foreign-born population - China (%)
Place of birth for the foreign-born population - Hong Kong (%)
Place of birth for the foreign-born population - Taiwan (%)
Place of birth for the foreign-born population - Japan (%)
Place of birth for the foreign-born population - Korea (%)
Place of birth for the foreign-born population - Other Eastern Asia (%)
Place of birth for the foreign-born population - Afghanistan (%)
Place of birth for the foreign-born population - Bangladesh (%)
Place of birth for the foreign-born population - India (%)
Place of birth for the foreign-born population - Iran (%)
Place of birth for the foreign-born population - Kazakhstan (%)
Place of birth for the foreign-born population - Nepal (%)
Place of birth for the foreign-born population - Pakistan (%)
Place of birth for the foreign-born population - Sri Lanka (%)
Place of birth for the foreign-born population - Uzbekistan (%)
Place of birth for the foreign-born population - Other South Central Asia (%)
Place of birth for the foreign-born population - Burma (%)
Place of birth for the foreign-born population - Cambodia (%)
Place of birth for the foreign-born population - Indonesia (%)
Place of birth for the foreign-born population - Laos (%)
Place of birth for the foreign-born population - Malaysia (%)
Place of birth for the foreign-born population - Philippines (%)
Place of birth for the foreign-born population - Singapore (%)
Place of birth for the foreign-born population - Thailand (%)
Place of birth for the foreign-born population - Vietnam (%)
Place of birth for the foreign-born population - Other South Eastern Asia (%)
Place of birth for the foreign-born population - Armenia (%)
Place of birth for the foreign-born population - Iraq (%)
Place of birth for the foreign-born population - Israel (%)
Place of birth for the foreign-born population - Jordan (%)
Place of birth for the foreign-born population - Kuwait (%)
Place of birth for the foreign-born population - Lebanon (%)
Place of birth for the foreign-born population - Saudi Arabia (%)
Place of birth for the foreign-born population - Syria (%)
Place of birth for the foreign-born population - Turkey (%)
Place of birth for the foreign-born population - Yemen (%)
Place of birth for the foreign-born population - Other Western Asia (%)
Place of birth for the foreign-born population - Eritrea (%)
Place of birth for the foreign-born population - Ethiopia (%)
Place of birth for the foreign-born population - Kenya (%)
Place of birth for the foreign-born population - Somalia (%)
Place of birth for the foreign-born population - Uganda (%)
Place of birth for the foreign-born population - Zimbabwe (%)
Place of birth for the foreign-born population - Other Eastern Africa (%)
Place of birth for the foreign-born population - Cameroon (%)
Place of birth for the foreign-born population - Congo (%)
Place of birth for the foreign-born population - Democratic Republic of Congo (Zaire) (%)
Place of birth for the foreign-born population - Other Middle Africa (%)
Place of birth for the foreign-born population - Egypt (%)
Place of birth for the foreign-born population - Morocco (%)
Place of birth for the foreign-born population - Sudan (%)
Place of birth for the foreign-born population - Other Northern Africa (%)
Place of birth for the foreign-born population - South Africa (%)
Place of birth for the foreign-born population - Other Southern Africa (%)
Place of birth for the foreign-born population - Cabo Verde (%)
Place of birth for the foreign-born population - Ghana (%)
Place of birth for the foreign-born population - Liberia (%)
Place of birth for the foreign-born population - Nigeria (%)
Place of birth for the foreign-born population - Senegal (%)
Place of birth for the foreign-born population - Sierra Leone (%)
Place of birth for the foreign-born population - Other Western Africa (%)
Place of birth for the foreign-born population - Australia (%)
Place of birth for the foreign-born population - New Zealand (%)
Place of birth for the foreign-born population - Fiji (%)
Place of birth for the foreign-born population - Micronesia (%)
Place of birth for the foreign-born population - Bahamas (%)
Place of birth for the foreign-born population - Barbados (%)
Place of birth for the foreign-born population - Cuba (%)
Place of birth for the foreign-born population - Dominica (%)
Place of birth for the foreign-born population - Dominican Republic (%)
Place of birth for the foreign-born population - Grenada (%)
Place of birth for the foreign-born population - Haiti (%)
Place of birth for the foreign-born population - Jamaica (%)
Place of birth for the foreign-born population - St. Vincent and the Grenadines (%)
Place of birth for the foreign-born population - Trinidad and Tobago (%)
Place of birth for the foreign-born population - West Indies (%)
Place of birth for the foreign-born population - Other Caribbean (%)
Place of birth for the foreign-born population - Belize (%)
Place of birth for the foreign-born population - Costa Rica (%)
Place of birth for the foreign-born population - El Salvador (%)
Place of birth for the foreign-born population - Guatemala (%)
Place of birth for the foreign-born population - Honduras (%)
Place of birth for the foreign-born population - Mexico (%)
Place of birth for the foreign-born population - Nicaragua (%)
Place of birth for the foreign-born population - Panama (%)
Place of birth for the foreign-born population - Other Central America (%)
Place of birth for the foreign-born population - Argentina (%)
Place of birth for the foreign-born population - Bolivia (%)
Place of birth for the foreign-born population - Brazil (%)
Place of birth for the foreign-born population - Chile (%)
Place of birth for the foreign-born population - Colombia (%)
Place of birth for the foreign-born population - Ecuador (%)
Place of birth for the foreign-born population - Guyana (%)
Place of birth for the foreign-born population - Peru (%)
Place of birth for the foreign-born population - Uruguay (%)
Place of birth for the foreign-born population - Venezuela (%)
Place of birth for the foreign-born population - Other South America (%)
Place of birth for the foreign-born population - Canada (%)
Place of birth for the foreign-born population - Other Northern America (%)
Place of birth for the foreign-born population - Other (%)
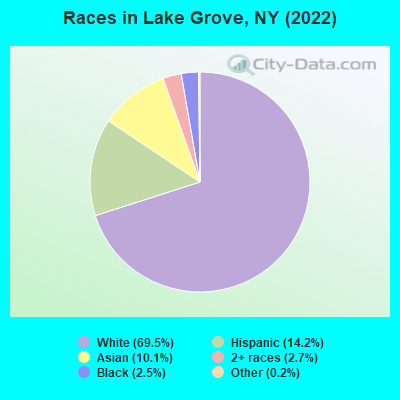
According to 2022 data, the most numerous races in Lake Grove, NY are White alone (7,694 residents), Hispanic (1,576 residents), and Black alone (279 residents). 81.4% of Lake Grove residents speak English at home. 13.4% of Lake Grove, NY residents are foreign-born (7.0% born in Asia, 2.8% born in Europe, 2.6% born in Latin America), which is 64.2% less than the foreign-born rate of 22.0% across the entire state of New York.
Race distribution in Lake Grove
2000 2022
11,760,981 62.0% White alone 2,867,583 15.1% Hispanic 2,812,623 14.8% Black alone 1,035,926 5.5% Asian alone 366,116 1.9% Two or more races 75,499 0.4% Other race alone 52,499 0.3% American Indian alone 5,230 0.03% Native Hawaiian and Other
10,408,933 52.9% White alone 3,867,299 19.7% Hispanic 2,633,840 13.4% Black alone 1,776,286 9.0% Asian alone 732,670 3.7% Two or more races 216,110 1.1% Other race alone 35,082 0.2% American Indian alone 6,931 0.04% Native Hawaiian and Other
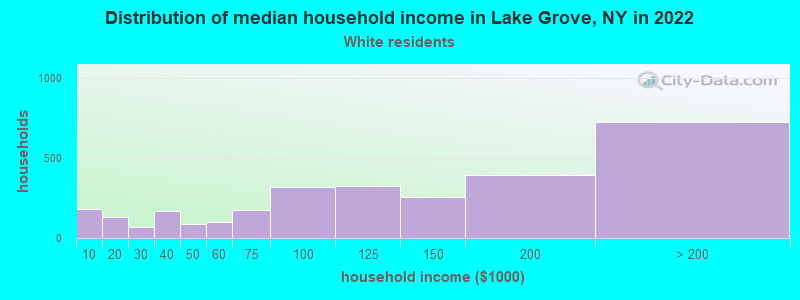
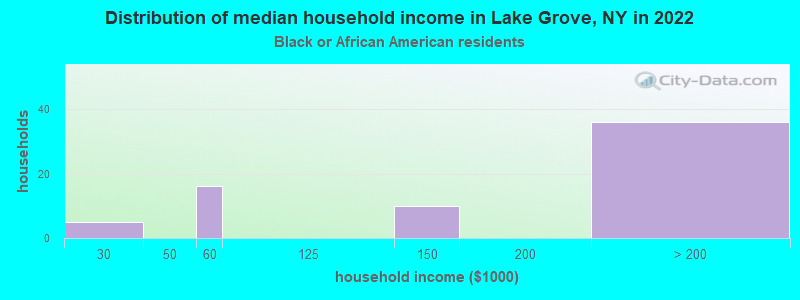
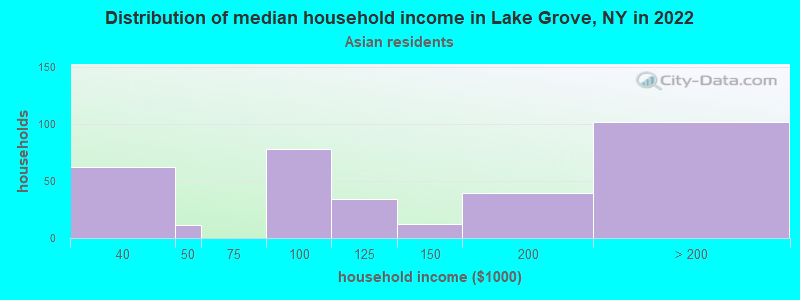
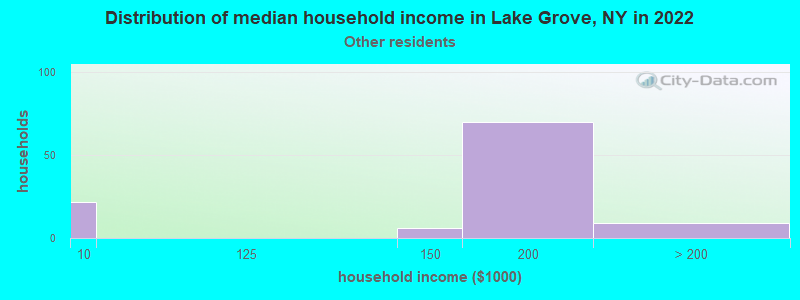
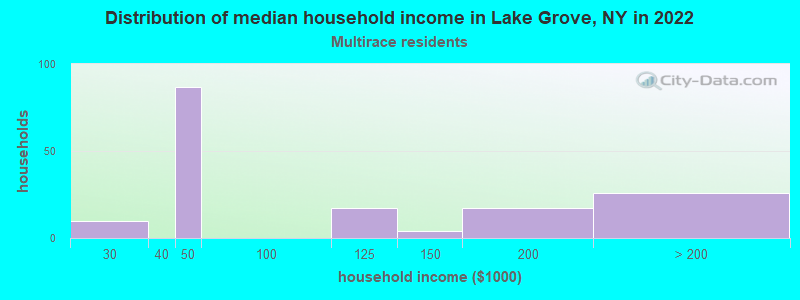
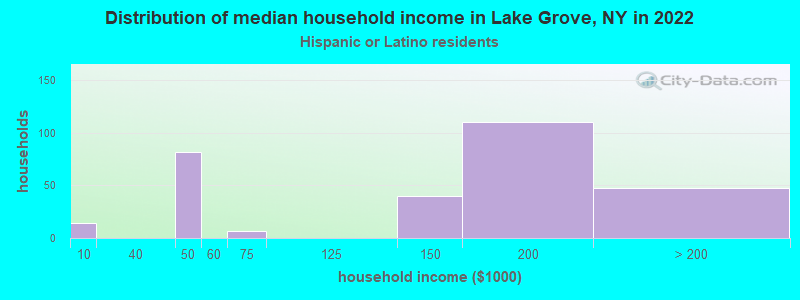
Income and house value in Lake Grove Median household income in 2022 $111,577 White non-Hispanic householders$168,034 Some other race householders$125,775 Hispanic or Latino race householdersMedian 2022 house value $548,766 White Non-Hispanic householders$543,214 Black or African American householders$547,889 American Indian or Alaska Native householders $844,188 Asian householders$596,688 Some other race householders$474,837 Two or more races householders$584,415 Hispanic or Latino householders
Median age by race in Lake Grove
45.5 Median age for White residents43.9 46.7 34.8 Median age for Black or African American residents34.2 38.0 -748,832,865.7 Median age for American Indian / Alaska Native residents-807,017,543.1 -513,692,161.9 46.6 Median age for Asian residents54.3 41.1 -742,816,091.2 Median age for Native Hawaiian / Pacific Islander residents-831,187,409.8 -771,300,447.7 37.3 Median age for Other race residents34.6 48.9 13.9 Median age for Two or more races residents11.1 32.3 46.2 Median age for White alone residents45.0 48.3 19.1 Median age for Hispanic or Latino residents14.9 35.1
Owner/renter occupied households by race in Lake Grove
House owners and renters - White residents 2,460 84.7% Owner occupied445 15.3% Renter occupiedHouse owners and renters - Black or African American residents 84 100.0% Owner occupiedHouse owners and renters - Asian residents 171 46.5% Owner occupied196 53.5% Renter occupiedHouse owners and renters - Other race residents 84 100.0% Owner occupiedHouse owners and renters - Two or more races residents 202 92.2% Owner occupied17 7.8% Renter occupiedHouse owners and renters - White alone residents 2,422 84.3% Owner occupied453 15.7% Renter occupiedHouse owners and renters - Hispanic or Latino residents 282 88.7% Owner occupied36 11.3% Renter occupied
Language usage in Lake Grove
English speakers - Total 81.4% of residents of Lake Grove speak English at home.
4.2% of residents speak Spanish at home 397 89.2% Speak English very well48 10.8% Speak English less than very well14.1% of residents speak other language at home 1,194 79.3% Speak English very well312 20.7% Speak English less than very well
English speakers - Born in the United States 95.2% of residents of Lake Grove speak English at home.
2.7% of residents speak Spanish at home 19 100.0% Speak English very well2.4% of residents speak other language at home 17 100.0% Speak English very well
All residents speak only English at home
English speakers - Foreign-born 15.0% of residents of Lake Grove speak English at home.
11.0% of residents speak Spanish at home 129 72.5% Speak English very well49 27.5% Speak English less than very well71.1% of residents speak other language at home 828 72.3% Speak English very well318 27.7% Speak English less than very well
White (Caucasian) - Speak only English Native:
97.9% (7,199)Foreign-born:
12.6% (46)
White (Caucasian) - Speak another language Native:
2.9% (212)Foreign-born:
82.2% (298)
Black or African American - Speak only English Native:
97.0% (89)Foreign-born:
74.7% (115)
Asian - Speak only English Native:
60.4% (201)Foreign-born:
6.2% (44)
Asian - Speak another language Native:
36.9% (123)Foreign-born:
97.5% (695)
Other race - Speak only English Native:
76.8% (226)Foreign-born:
19.6% (27)
Other race - Speak another language Native:
27.6% (81)Foreign-born:
77.6% (106)
Two or more races - Speak only English Native:
91.0% (808)Foreign-born:
13.8% (3)
Two or more races - Speak another language Native:
9.9% (88)Foreign-born:
86.0% (16)
White alone - Speak only English Native:
97.4% (6,887)Foreign-born:
11.4% (50)
White alone - Speak another language Native:
2.5% (180)Foreign-born:
88.5% (387)
Hispanic or Latino - Speak only English Native:
82.5% (1,032)Foreign-born:
11.0% (22)
Hispanic or Latino - Speak another language Native:
19.7% (246)Foreign-born:
88.6% (180)
Foreign-born residents in Lake Grove 1,484 residents are foreign born (7.0% Asia , 2.8% Europe , 2.6% Latin America ).
This city:
13.4%New York:
22.6%
Marital status for residents in Lake Grove Marital status - White (Caucasian) population 15 years and over
Males 34.7% Never married52.0% Now married0.3% Separated3.7% Widowed9.3% DivorcedFemales 27.0% Never married52.5% Now married1.6% Separated9.5% Widowed9.4% DivorcedWomen who gave birth in the past 12 months Now married:
100.0% (36)Unmarried:
0.0% (0)
Women who did not give birth in the past 12 months Now married:
46.9% (759)Unmarried:
53.1% (858)
Marital status - Black or African American population 15 years and over
Males 55.4% Never married44.6% Now married0.0% Separated0.0% Widowed0.0% DivorcedFemales 0.0% Never married69.8% Now married0.0% Separated30.2% Widowed0.0% DivorcedWomen who gave birth in the past 12 months Now married:
100.0% (21)Unmarried:
0.0% (0)
Women who did not give birth in the past 12 months Now married:
100.0% (9)Unmarried:
0.0% (0)
Marital status - Asian population 15 years and over
Males 48.1% Never married49.3% Now married1.4% Separated0.0% Widowed1.2% DivorcedFemales 36.4% Never married46.8% Now married0.0% Separated10.8% Widowed6.0% DivorcedWomen who gave birth in the past 12 months Now married:
100.0% (21)Unmarried:
0.0% (0)
Women who did not give birth in the past 12 months Now married:
25.9% (66)Unmarried:
74.1% (187)
Marital status - Other race population 15 years and over
Males 51.7% Never married37.3% Now married0.0% Separated0.0% Widowed11.0% DivorcedFemales 16.2% Never married60.8% Now married0.0% Separated0.0% Widowed23.0% DivorcedWomen who did not give birth in the past 12 months Now married:
61.0% (53)Unmarried:
39.0% (34)
Marital status - Two or more races population 15 years and over
Males 45.0% Never married43.8% Now married0.0% Separated0.0% Widowed11.2% DivorcedFemales 32.4% Never married62.0% Now married0.0% Separated5.6% Widowed0.0% DivorcedWomen who did not give birth in the past 12 months Now married:
65.3% (190)Unmarried:
34.7% (101)
Marital status - White alone, not Hispanic / Latino population 15 years and over
Males 33.6% Never married52.4% Now married0.3% Separated3.9% Widowed9.8% DivorcedFemales 26.2% Never married52.0% Now married1.7% Separated10.1% Widowed10.0% DivorcedWomen who gave birth in the past 12 months Now married:
100.0% (25)Unmarried:
0.0% (0)
Women who did not give birth in the past 12 months Now married:
46.4% (731)Unmarried:
53.6% (843)
Marital status - Hispanic or Latino population 15 years and over
Males 53.5% Never married41.6% Now married0.0% Separated0.0% Widowed4.9% DivorcedFemales 27.2% Never married65.6% Now married0.0% Separated3.4% Widowed3.8% DivorcedWomen who gave birth in the past 12 months Now married:
100.0% (15)Unmarried:
0.0% (0)
Women who did not give birth in the past 12 months Now married:
64.4% (247)Unmarried:
35.6% (136)
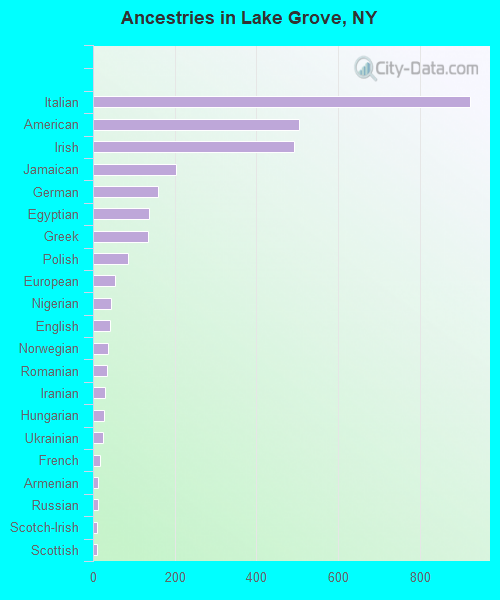
Ancestries in Lake Grove
923 20.3% Italian505 11.1% American493 10.8% Irish204 4.5% Jamaican160 3.5% German137 3.0% Egyptian135 3.0% Greek85 1.9% Polish54 1.2% European45 1.0% Nigerian42 0.9% English36 0.8% Norwegian34 0.7% Romanian30 0.7% Iranian26 0.6% Hungarian25 0.5% Ukrainian18 0.4% French13 0.3% Armenian13 0.3% Russian11 0.2% Scotch-Irish9 0.2% Scottish8 0.2% Welsh8 0.2% Yugoslavian6 0.1% British6 0.1% Turkish5 0.1% Swedish4 0.09% Luxembourger2 0.04% Croatian
Children Nativity (place of birth) in Lake Grove
Children under 6 years - Living with two parents Both parents native 282 100.0% NativeBoth parents foreign-born 180 100.0% NativeOne native, one foreign-born parent 28 100.0% NativeChildren under 6 years - Living with one parent Native parent 39 100.0% NativeChildren 6 to 17 years - Living with two parents Both parents native 979 100.0% Native0 0.0% Foreign-bornBoth parents foreign-born 65 84.2% Native12 15.8% Foreign-bornOne native, one foreign-born parent 185 100.0% NativeChildren 6 to 17 years - Living with one parent Native parent 539 100.0% NativeForeign-born parent 26 51.5% Native24 48.5% Foreign-born
Grandparents responsible for own grandchildren in Lake Grove
Grandparents (30 to 59 years) White / Caucasian 61 100.0% Responsible for grandchildrenAsian 37 100.0% Not responsible for grandchildrenWhite alone, not Hispanic / Latino 59 100.0% Responsible for grandchildrenGrandparents (60 years and over) White / Caucasian 11 14.3% Responsible for grandchildren69 85.7% Not responsible for grandchildrenAsian 39 100.0% Not responsible for grandchildrenWhite alone, not Hispanic / Latino 14 15.6% Responsible for grandchildren75 84.4% Not responsible for grandchildren