Races in Leesburg, Virginia (VA) Detailed Stats
Data:
Races - White alone (%)
Races - White alone (% change since 2000)
Races - Black alone (%)
Races - Black alone (% change since 2000)
Races - American Indian alone (%)
Races - American Indian alone (% change since 2000)
Races - Asian alone (%)
Races - Asian alone (% change since 2000)
Races - Hispanic (%)
Races - Hispanic (% change since 2000)
Races - Native Hawaiian and Other Pacific Islander alone (%)
Races - Native Hawaiian and Other Pacific Islander alone (% change since 2000)
Races - Two or more races(%)
Races - Two or more races(% change since 2000)
Races - Other race alone (%)
Races - Other race alone (% change since 2000)
Racial diversity
Place of birth - Born in state of residence (%)
Place of birth - Born in state of residence (%) - White
Place of birth - Born in state of residence (%) - Black or African American
Place of birth - Born in state of residence (%) - Asian
Place of birth - Born in state of residence (%) - Hispanic or Latino
Place of birth - Born in state of residence (%) - American Indian and Alaska Native
Place of birth - Born in state of residence (%) - Multirace
Place of birth - Born in state of residence (%) - Other Race
Place of birth - Born in other state (%)
Place of birth - Born in other state (%) - White
Place of birth - Born in other state (%) - Black or African American
Place of birth - Born in other state (%) - Asian
Place of birth - Born in other state (%) - Hispanic or Latino
Place of birth - Born in other state (%) - American Indian and Alaska Native
Place of birth - Born in other state (%) - Multirace
Place of birth - Born in other state (%) - Other Race
Place of birth - Native, outside of US (%)
Place of birth - Native, outside of US (%) - White
Place of birth - Native, outside of US (%) - Black or African American
Place of birth - Native, outside of US (%) - Asian
Place of birth - Native, outside of US (%) - Hispanic or Latino
Place of birth - Native, outside of US (%) - American Indian and Alaska Native
Place of birth - Native, outside of US (%) - Multirace
Place of birth - Native, outside of US (%) - Other Race
Place of birth - Foreign born (%)
Place of birth - Foreign born (%) - White
Place of birth - Foreign born (%) - Black or African American
Place of birth - Foreign born (%) - Asian
Place of birth - Foreign born (%) - Hispanic or Latino
Place of birth - Foreign born (%) - American Indian and Alaska Native
Place of birth - Foreign born (%) - Multirace
Place of birth - Foreign born (%) - Other Race
Residents speaking English at home (%)
Residents speaking English at home - Born in the United States (%)
Residents speaking English at home - Native, born elsewhere (%)
Residents speaking English at home - Foreign born (%)
Residents speaking Spanish at home (%)
Residents speaking Spanish at home - Born in the United States (%)
Residents speaking Spanish at home - Native, born elsewhere (%)
Residents speaking Spanish at home - Foreign born (%)
Residents speaking other language at home (%)
Residents speaking other language at home - Born in the United States (%)
Residents speaking other language at home - Native, born elsewhere (%)
Residents speaking other language at home - Foreign born (%)
Marital status - Never married (%)
Marital status - Now married (%)
Marital status - Separated (%)
Marital status - Widowed (%)
Marital status - Divorced (%)
Ancestries Reported - Arab (%)
Ancestries Reported - Czech (%)
Ancestries Reported - Danish (%)
Ancestries Reported - Dutch (%)
Ancestries Reported - English (%)
Ancestries Reported - French (%)
Ancestries Reported - French Canadian (%)
Ancestries Reported - German (%)
Ancestries Reported - Greek (%)
Ancestries Reported - Hungarian (%)
Ancestries Reported - Irish (%)
Ancestries Reported - Italian (%)
Ancestries Reported - Lithuanian (%)
Ancestries Reported - Norwegian (%)
Ancestries Reported - Polish (%)
Ancestries Reported - Portuguese (%)
Ancestries Reported - Russian (%)
Ancestries Reported - Scotch-Irish (%)
Ancestries Reported - Scottish (%)
Ancestries Reported - Slovak (%)
Ancestries Reported - Subsaharan African (%)
Ancestries Reported - Swedish (%)
Ancestries Reported - Swiss (%)
Ancestries Reported - Ukrainian (%)
Ancestries Reported - United States (%)
Ancestries Reported - Welsh (%)
Ancestries Reported - West Indian (%)
Ancestries Reported - Other (%)
Geographical mobility - Same house 1 year ago (%)
Geographical mobility - Same house 1 year ago (%) - White
Geographical mobility - Same house 1 year ago (%) - Black or African American
Geographical mobility - Same house 1 year ago (%) - Asian
Geographical mobility - Same house 1 year ago (%) - Hispanic or Latino
Geographical mobility - Same house 1 year ago (%) - American Indian and Alaska Native
Geographical mobility - Same house 1 year ago (%) - Multirace
Geographical mobility - Same house 1 year ago (%) - Other Race
Geographical mobility - Moved within same county (%)
Geographical mobility - Moved within same county (%) - White
Geographical mobility - Moved within same county (%) - Black or African American
Geographical mobility - Moved within same county (%) - Asian
Geographical mobility - Moved within same county (%) - Hispanic or Latino
Geographical mobility - Moved within same county (%) - American Indian and Alaska Native
Geographical mobility - Moved within same county (%) - Multirace
Geographical mobility - Moved within same county (%) - Other Race
Geographical mobility - Moved from different county within same state (%)
Geographical mobility - Moved from different county within same state (%) - White
Geographical mobility - Moved from different county within same state (%) - Black or African American
Geographical mobility - Moved from different county within same state (%) - Asian
Geographical mobility - Moved from different county within same state (%) - Hispanic or Latino
Geographical mobility - Moved from different county within same state (%) - American Indian and Alaska Native
Geographical mobility - Moved from different county within same state (%) - Multirace
Geographical mobility - Moved from different county within same state (%) - Other Race
Geographical mobility - Moved from different state (%)
Geographical mobility - Moved from different state (%) - White
Geographical mobility - Moved from different state (%) - Black or African American
Geographical mobility - Moved from different state (%) - Asian
Geographical mobility - Moved from different state (%) - Hispanic or Latino
Geographical mobility - Moved from different state (%) - American Indian and Alaska Native
Geographical mobility - Moved from different state (%) - Multirace
Geographical mobility - Moved from different state (%) - Other Race
Geographical mobility - Moved from abroad (%)
Geographical mobility - Moved from abroad (%) - White
Geographical mobility - Moved from abroad (%) - Black or African American
Geographical mobility - Moved from abroad (%) - Asian
Geographical mobility - Moved from abroad (%) - Hispanic or Latino
Geographical mobility - Moved from abroad (%) - American Indian and Alaska Native
Geographical mobility - Moved from abroad (%) - Multirace
Geographical mobility - Moved from abroad (%) - Other Race
Place of birth for the foreign-born population - Ireland (%)
Place of birth for the foreign-born population - Denmark (%)
Place of birth for the foreign-born population - Norway (%)
Place of birth for the foreign-born population - Sweden (%)
Place of birth for the foreign-born population - United Kingdom (%)
Place of birth for the foreign-born population - England (%)
Place of birth for the foreign-born population - Scotland (%)
Place of birth for the foreign-born population - Other Northern Europe (%)
Place of birth for the foreign-born population - Austria (%)
Place of birth for the foreign-born population - Belgium (%)
Place of birth for the foreign-born population - France (%)
Place of birth for the foreign-born population - Germany (%)
Place of birth for the foreign-born population - Netherlands (%)
Place of birth for the foreign-born population - Switzerland (%)
Place of birth for the foreign-born population - Other Western Europe (%)
Place of birth for the foreign-born population - Greece (%)
Place of birth for the foreign-born population - Italy (%)
Place of birth for the foreign-born population - Portugal (%)
Place of birth for the foreign-born population - Spain (%)
Place of birth for the foreign-born population - Other Southern Europe (%)
Place of birth for the foreign-born population - Albania (%)
Place of birth for the foreign-born population - Belarus (%)
Place of birth for the foreign-born population - Bosnia and Herzegovina (%)
Place of birth for the foreign-born population - Bulgaria (%)
Place of birth for the foreign-born population - Croatia (%)
Place of birth for the foreign-born population - Czechoslovakia (%)
Place of birth for the foreign-born population - Hungary (%)
Place of birth for the foreign-born population - Latvia (%)
Place of birth for the foreign-born population - Lithuania (%)
Place of birth for the foreign-born population - North Macedonia (Macedonia) (%)
Place of birth for the foreign-born population - Moldova (%)
Place of birth for the foreign-born population - Poland (%)
Place of birth for the foreign-born population - Romania (%)
Place of birth for the foreign-born population - Russia (%)
Place of birth for the foreign-born population - Serbia (%)
Place of birth for the foreign-born population - Ukraine (%)
Place of birth for the foreign-born population - Other Eastern Europe (%)
Place of birth for the foreign-born population - China (%)
Place of birth for the foreign-born population - Hong Kong (%)
Place of birth for the foreign-born population - Taiwan (%)
Place of birth for the foreign-born population - Japan (%)
Place of birth for the foreign-born population - Korea (%)
Place of birth for the foreign-born population - Other Eastern Asia (%)
Place of birth for the foreign-born population - Afghanistan (%)
Place of birth for the foreign-born population - Bangladesh (%)
Place of birth for the foreign-born population - India (%)
Place of birth for the foreign-born population - Iran (%)
Place of birth for the foreign-born population - Kazakhstan (%)
Place of birth for the foreign-born population - Nepal (%)
Place of birth for the foreign-born population - Pakistan (%)
Place of birth for the foreign-born population - Sri Lanka (%)
Place of birth for the foreign-born population - Uzbekistan (%)
Place of birth for the foreign-born population - Other South Central Asia (%)
Place of birth for the foreign-born population - Burma (%)
Place of birth for the foreign-born population - Cambodia (%)
Place of birth for the foreign-born population - Indonesia (%)
Place of birth for the foreign-born population - Laos (%)
Place of birth for the foreign-born population - Malaysia (%)
Place of birth for the foreign-born population - Philippines (%)
Place of birth for the foreign-born population - Singapore (%)
Place of birth for the foreign-born population - Thailand (%)
Place of birth for the foreign-born population - Vietnam (%)
Place of birth for the foreign-born population - Other South Eastern Asia (%)
Place of birth for the foreign-born population - Armenia (%)
Place of birth for the foreign-born population - Iraq (%)
Place of birth for the foreign-born population - Israel (%)
Place of birth for the foreign-born population - Jordan (%)
Place of birth for the foreign-born population - Kuwait (%)
Place of birth for the foreign-born population - Lebanon (%)
Place of birth for the foreign-born population - Saudi Arabia (%)
Place of birth for the foreign-born population - Syria (%)
Place of birth for the foreign-born population - Turkey (%)
Place of birth for the foreign-born population - Yemen (%)
Place of birth for the foreign-born population - Other Western Asia (%)
Place of birth for the foreign-born population - Eritrea (%)
Place of birth for the foreign-born population - Ethiopia (%)
Place of birth for the foreign-born population - Kenya (%)
Place of birth for the foreign-born population - Somalia (%)
Place of birth for the foreign-born population - Uganda (%)
Place of birth for the foreign-born population - Zimbabwe (%)
Place of birth for the foreign-born population - Other Eastern Africa (%)
Place of birth for the foreign-born population - Cameroon (%)
Place of birth for the foreign-born population - Congo (%)
Place of birth for the foreign-born population - Democratic Republic of Congo (Zaire) (%)
Place of birth for the foreign-born population - Other Middle Africa (%)
Place of birth for the foreign-born population - Egypt (%)
Place of birth for the foreign-born population - Morocco (%)
Place of birth for the foreign-born population - Sudan (%)
Place of birth for the foreign-born population - Other Northern Africa (%)
Place of birth for the foreign-born population - South Africa (%)
Place of birth for the foreign-born population - Other Southern Africa (%)
Place of birth for the foreign-born population - Cabo Verde (%)
Place of birth for the foreign-born population - Ghana (%)
Place of birth for the foreign-born population - Liberia (%)
Place of birth for the foreign-born population - Nigeria (%)
Place of birth for the foreign-born population - Senegal (%)
Place of birth for the foreign-born population - Sierra Leone (%)
Place of birth for the foreign-born population - Other Western Africa (%)
Place of birth for the foreign-born population - Australia (%)
Place of birth for the foreign-born population - New Zealand (%)
Place of birth for the foreign-born population - Fiji (%)
Place of birth for the foreign-born population - Micronesia (%)
Place of birth for the foreign-born population - Bahamas (%)
Place of birth for the foreign-born population - Barbados (%)
Place of birth for the foreign-born population - Cuba (%)
Place of birth for the foreign-born population - Dominica (%)
Place of birth for the foreign-born population - Dominican Republic (%)
Place of birth for the foreign-born population - Grenada (%)
Place of birth for the foreign-born population - Haiti (%)
Place of birth for the foreign-born population - Jamaica (%)
Place of birth for the foreign-born population - St. Vincent and the Grenadines (%)
Place of birth for the foreign-born population - Trinidad and Tobago (%)
Place of birth for the foreign-born population - West Indies (%)
Place of birth for the foreign-born population - Other Caribbean (%)
Place of birth for the foreign-born population - Belize (%)
Place of birth for the foreign-born population - Costa Rica (%)
Place of birth for the foreign-born population - El Salvador (%)
Place of birth for the foreign-born population - Guatemala (%)
Place of birth for the foreign-born population - Honduras (%)
Place of birth for the foreign-born population - Mexico (%)
Place of birth for the foreign-born population - Nicaragua (%)
Place of birth for the foreign-born population - Panama (%)
Place of birth for the foreign-born population - Other Central America (%)
Place of birth for the foreign-born population - Argentina (%)
Place of birth for the foreign-born population - Bolivia (%)
Place of birth for the foreign-born population - Brazil (%)
Place of birth for the foreign-born population - Chile (%)
Place of birth for the foreign-born population - Colombia (%)
Place of birth for the foreign-born population - Ecuador (%)
Place of birth for the foreign-born population - Guyana (%)
Place of birth for the foreign-born population - Peru (%)
Place of birth for the foreign-born population - Uruguay (%)
Place of birth for the foreign-born population - Venezuela (%)
Place of birth for the foreign-born population - Other South America (%)
Place of birth for the foreign-born population - Canada (%)
Place of birth for the foreign-born population - Other Northern America (%)
Place of birth for the foreign-born population - Other (%)
Latest news about races in Leesburg, VA collected exclusively by city-data.com from local newspapers, TV, and radio stations
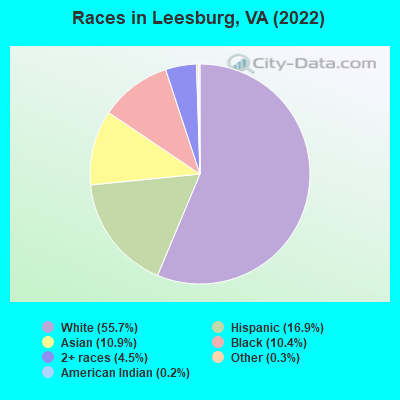
According to 2022 data, the most numerous races in Leesburg, VA are White alone (27,744 residents), Black alone (5,163 residents), and Hispanic (8,395 residents). 70.9% of Leesburg residents speak English at home. 18.4% of Leesburg, VA residents are foreign-born (7.2% born in Latin America, 6.7% born in Asia, 3.0% born in Africa), which is 34.8% greater than the foreign-born rate of 12.0% across the entire state of Virginia.
Race distribution in Leesburg
2000 2022
4,965,637 70.2% White alone 1,376,378 19.4% Black alone 329,540 4.7% Hispanic 259,277 3.7% Asian alone 114,022 1.6% Two or more races 18,596 0.3% American Indian alone 11,685 0.2% Other race alone 3,380 0.05% Native Hawaiian and Other
5,095,130 58.7% White alone 1,594,785 18.4% Black alone 905,750 10.4% Hispanic 602,881 6.9% Asian alone 406,047 4.7% Two or more races 60,419 0.7% Other race alone 11,738 0.1% American Indian alone 6,869 0.08% Native Hawaiian and Other
Income and house value in Leesburg Median household income in 2022 $151,040 White non-Hispanic householders$101,435 Black householders$166,564 American Indian and Alaska Native householders$131,233 Asian householders$73,509 Some other race householders$87,499 Two or more races householders$88,576 Hispanic or Latino race householdersMedian 2022 house value $678,032 White Non-Hispanic householders$481,071 Black or African American householders $542,774 Asian householders$546,609 Some other race householders$572,057 Two or more races householders$570,314 Hispanic or Latino householders
Median age by race in Leesburg
38.9 Median age for White residents36.8 40.6 37.9 Median age for Black or African American residents32.4 39.2 64.4 Median age for American Indian / Alaska Native residents74.2 49.0 35.2 Median age for Asian residents33.9 35.5 67.7 Median age for Native Hawaiian / Pacific Islander residents-541,531,822.5 -714,150,046.8 23.7 Median age for Other race residents29.5 20.4 27.8 Median age for Two or more races residents27.0 27.6 38.6 Median age for White alone residents36.4 40.3 30.1 Median age for Hispanic or Latino residents31.0 28.4
Owner/renter occupied households by race in Leesburg
House owners and renters - White residents 8,291 74.0% Owner occupied2,908 26.0% Renter occupiedHouse owners and renters - Black or African American residents 602 36.1% Owner occupied1,064 63.9% Renter occupiedHouse owners and renters - American Indian / Alaska Native residents 52 50.1% Owner occupied52 49.9% Renter occupiedHouse owners and renters - Asian residents 1,350 84.6% Owner occupied247 15.4% Renter occupiedHouse owners and renters - Native Hawaiian / Pacific Islander residents 6 29.0% Owner occupied14 71.0% Renter occupiedHouse owners and renters - Other race residents 318 80.5% Owner occupied77 19.5% Renter occupiedHouse owners and renters - Two or more races residents 977 55.0% Owner occupied801 45.0% Renter occupiedHouse owners and renters - White alone residents 8,078 75.1% Owner occupied2,677 24.9% Renter occupiedHouse owners and renters - Hispanic or Latino residents 1,246 56.4% Owner occupied962 43.6% Renter occupied
Language usage in Leesburg
English speakers - Total 70.9% of residents of Leesburg speak English at home.
13.1% of residents speak Spanish at home 4,208 69.9% Speak English very well1,814 30.1% Speak English less than very well14.5% of residents speak other language at home 4,783 71.7% Speak English very well1,885 28.3% Speak English less than very well
English speakers - Born in the United States 91.0% of residents of Leesburg speak English at home.
4.5% of residents speak Spanish at home 828 91.5% Speak English very well77 8.5% Speak English less than very well4.1% of residents speak other language at home 684 82.9% Speak English very well141 17.1% Speak English less than very well
English speakers - Native, born elsewhere 47.0% of residents of Leesburg speak English at home.
34.9% of residents speak Spanish at home 559 93.8% Speak English very well37 6.2% Speak English less than very well13.5% of residents speak other language at home 230 100.0% Speak English very well
English speakers - Foreign-born 20.2% of residents of Leesburg speak English at home.
32.2% of residents speak Spanish at home 1,543 49.5% Speak English very well1,573 50.5% Speak English less than very well45.0% of residents speak other language at home 2,690 61.8% Speak English very well1,661 38.2% Speak English less than very well
White (Caucasian) - Speak only English Native:
92.9% (23,305)Foreign-born:
19.6% (462)
White (Caucasian) - Speak another language Native:
7.1% (1,773)Foreign-born:
80.4% (1,897)
Black or African American - Speak only English Native:
90.9% (3,512)Foreign-born:
38.0% (385)
Black or African American - Speak another language Native:
10.0% (387)Foreign-born:
55.9% (566)
American Indian / Alaska Native - Speak another language Native:
17.7% (22)Foreign-born:
100.0% (165)
Asian - Speak only English Native:
47.5% (892)Foreign-born:
21.9% (707)
Asian - Speak another language Native:
53.4% (1,004)Foreign-born:
78.2% (2,523)
Other race - Speak only English Native:
45.8% (406)Foreign-born:
19.4% (189)
Other race - Speak another language Native:
54.1% (480)Foreign-born:
79.4% (775)
Two or more races - Speak only English Native:
59.2% (2,294)Foreign-born:
8.2% (152)
Two or more races - Speak another language Native:
43.1% (1,670)Foreign-born:
91.7% (1,703)
White alone - Speak only English Native:
94.0% (22,911)Foreign-born:
28.1% (424)
White alone - Speak another language Native:
6.0% (1,468)Foreign-born:
67.7% (1,023)
Hispanic or Latino - Speak only English Native:
40.3% (1,610)Foreign-born:
7.3% (248)
Hispanic or Latino - Speak another language Native:
59.5% (2,376)Foreign-born:
92.5% (3,135)
Foreign-born residents in Leesburg 9,164 residents are foreign born (7.2% Latin America , 6.7% Asia , 3.0% Africa ).
This city:
18.4%Virginia:
12.6%
Marital status for residents in Leesburg Marital status - White (Caucasian) population 15 years and over
Males 30.6% Never married59.3% Now married0.5% Separated1.0% Widowed8.6% DivorcedFemales 26.9% Never married53.7% Now married1.1% Separated6.5% Widowed11.8% DivorcedWomen who gave birth in the past 12 months Now married:
86.0% (332)Unmarried:
14.0% (54)
Women who did not give birth in the past 12 months Now married:
52.6% (3,538)Unmarried:
47.4% (3,189)
Marital status - Black or African American population 15 years and over
Males 39.6% Never married44.9% Now married3.3% Separated1.5% Widowed10.7% DivorcedFemales 35.8% Never married35.5% Now married8.3% Separated6.9% Widowed13.5% DivorcedWomen who gave birth in the past 12 months Now married:
100.0% (73)Unmarried:
0.0% (0)
Women who did not give birth in the past 12 months Now married:
37.0% (439)Unmarried:
63.0% (747)
Marital status - American Indian / Alaska Native population 15 years and over
Males 8.5% Never married59.3% Now married0.0% Separated0.0% Widowed32.2% DivorcedFemales 0.0% Never married78.2% Now married0.0% Separated21.8% Widowed0.0% DivorcedWomen who gave birth in the past 12 months Now married:
100.0% (2)Unmarried:
0.0% (0)
Women who did not give birth in the past 12 months Now married:
100.0% (48)Unmarried:
0.0% (0)
Marital status - Asian population 15 years and over
Males 33.7% Never married63.5% Now married0.6% Separated0.0% Widowed2.2% DivorcedFemales 17.7% Never married69.7% Now married0.0% Separated7.4% Widowed5.2% DivorcedWomen who gave birth in the past 12 months Now married:
87.5% (62)Unmarried:
12.5% (9)
Women who did not give birth in the past 12 months Now married:
66.6% (958)Unmarried:
33.4% (480)
Marital status - Native Hawaiian / Pacific Islander population 15 years and over
Males 0.0% Never married28.6% Now married0.0% Separated0.0% Widowed71.4% DivorcedFemales 100.0% Never married0.0% Now married0.0% Separated0.0% Widowed0.0% DivorcedWomen who did not give birth in the past 12 months Now married:
0.0% (0)Unmarried:
100.0% (21)
Marital status - Other race population 15 years and over
Males 46.2% Never married42.5% Now married0.0% Separated3.0% Widowed8.3% DivorcedFemales 46.4% Never married34.8% Now married8.0% Separated4.9% Widowed5.9% DivorcedWomen who gave birth in the past 12 months Now married:
100.0% (4)Unmarried:
0.0% (0)
Women who did not give birth in the past 12 months Now married:
25.9% (120)Unmarried:
74.1% (343)
Marital status - Two or more races population 15 years and over
Males 53.4% Never married38.8% Now married4.0% Separated0.0% Widowed3.9% DivorcedFemales 40.8% Never married32.3% Now married1.7% Separated4.0% Widowed21.2% DivorcedWomen who gave birth in the past 12 months Now married:
47.0% (110)Unmarried:
53.0% (124)
Women who did not give birth in the past 12 months Now married:
28.9% (423)Unmarried:
71.1% (1,038)
Marital status - White alone, not Hispanic / Latino population 15 years and over
Males 31.7% Never married57.4% Now married0.5% Separated1.1% Widowed9.3% DivorcedFemales 26.5% Never married52.6% Now married1.1% Separated7.2% Widowed12.7% DivorcedWomen who gave birth in the past 12 months Now married:
84.6% (314)Unmarried:
15.4% (57)
Women who did not give birth in the past 12 months Now married:
52.4% (3,295)Unmarried:
47.6% (2,998)
Marital status - Hispanic or Latino population 15 years and over
Males 39.7% Never married52.4% Now married2.1% Separated0.6% Widowed5.1% DivorcedFemales 34.4% Never married45.0% Now married3.3% Separated3.1% Widowed14.2% DivorcedWomen who gave birth in the past 12 months Now married:
56.5% (129)Unmarried:
43.5% (99)
Women who did not give birth in the past 12 months Now married:
38.6% (768)Unmarried:
61.4% (1,220)
Ancestries in Leesburg
1,963 7.8% English1,861 7.4% American1,849 7.4% European1,599 6.4% Irish1,438 5.7% German549 2.2% Italian484 1.9% African466 1.9% Nigerian408 1.6% Egyptian362 1.4% Somali322 1.3% Polish237 0.9% Scottish171 0.7% Iranian163 0.7% Ethiopian162 0.6% British158 0.6% Norwegian115 0.5% Scotch-Irish109 0.4% Palestinian108 0.4% Turkish97 0.4% Dutch94 0.4% Greek88 0.4% Russian78 0.3% Ghanaian71 0.3% Lebanese70 0.3% Welsh65 0.3% Yugoslavian62 0.2% Eastern European60 0.2% Albanian56 0.2% Romanian52 0.2% Belgian46 0.2% Slovak43 0.2% French39 0.2% Ukrainian35 0.1% Trinidadian and Tobagonian35 0.1% South African33 0.1% Iraqi28 0.1% Moroccan27 0.1% Afghan25 0.10% Canadian22 0.09% Sierra Leonean20 0.08% Northern European17 0.07% Pennsylvania German13 0.05% Liberian12 0.05% Hungarian11 0.04% French Canadian11 0.04% Swedish9 0.04% Swiss8 0.03% Lithuanian6 0.02% Arab3 0.01% Danish2 0.01% Czech
Geographical mobility in Leesburg Same house 1 year ago 25,143 87.4% White (Caucasian)4,594 90.6% Black or African American216 75.2% American Indian / Alaska Native4,960 89.2% Asian49 95.3% Native Hawaiian / Pacific Islander2,119 98.6% Other race5,562 87.7% Two or more races23,866 87.3% White alone, not Hispanic / Latino7,743 95.9% Hispanic or LatinoMoved within same county 1,524 5.3% White / Caucasian541 10.7% Black or African American117 41.0% American Indian / Alaska Native363 6.5% Asian32 1.5% Other race151 2.4% Two or more races1,286 4.7% White alone, not Hispanic / Latino252 3.1% Hispanic or LatinoMoved within same state 973 3.4% White / Caucasian58 1.0% Asian46 2.1% Other race322 5.1% Two or more races1,079 3.9% White alone, not Hispanic / Latino45 0.6% Hispanic or LatinoMoved from different state 972 3.4% White / Caucasian145 2.9% Black or African American100 1.8% Asian259 4.1% Two or more races1,002 3.7% White alone, not Hispanic / Latino213 2.6% Hispanic or LatinoMoved from abroad 49 0.2% White23 0.1% White alone, not Hispanic / Latino61 0.8% Hispanic or Latino
Children Nativity (place of birth) in Leesburg
Children under 6 years - Living with two parents Both parents native 1,944 100.0% NativeBoth parents foreign-born 613 82.0% Native135 18.0% Foreign-bornOne native, one foreign-born parent 565 100.0% NativeChildren under 6 years - Living with one parent Native parent 668 100.0% NativeForeign-born parent 927 95.5% Native43 4.5% Foreign-bornChildren 6 to 17 years - Living with two parents Both parents native 3,722 97.7% Native86 2.3% Foreign-bornBoth parents foreign-born 1,210 73.6% Native435 26.4% Foreign-bornOne native, one foreign-born parent 539 98.5% Native8 1.5% Foreign-bornChildren 6 to 17 years - Living with one parent Native parent 1,385 100.0% NativeForeign-born parent 752 49.3% Native775 50.7% Foreign-born
Grandparents responsible for own grandchildren in Leesburg
Grandparents (30 to 59 years) Black or African American 3 19.1% Responsible for grandchildren11 80.9% Not responsible for grandchildrenAsian 46 100.0% Not responsible for grandchildrenOther race 111 100.0% Not responsible for grandchildrenHispanic or Latino 62 100.0% Not responsible for grandchildrenGrandparents (60 years and over) Black or African American 19 24.5% Responsible for grandchildren59 75.5% Not responsible for grandchildrenAsian 23 14.4% Responsible for grandchildren136 85.6% Not responsible for grandchildrenOther race 75 100.0% Not responsible for grandchildrenHispanic or Latino 124 100.0% Not responsible for grandchildren