Races in Manassas Park, Virginia (VA) Detailed Stats
Data:
Races - White alone (%)
Races - White alone (% change since 2000)
Races - Black alone (%)
Races - Black alone (% change since 2000)
Races - American Indian alone (%)
Races - American Indian alone (% change since 2000)
Races - Asian alone (%)
Races - Asian alone (% change since 2000)
Races - Hispanic (%)
Races - Hispanic (% change since 2000)
Races - Native Hawaiian and Other Pacific Islander alone (%)
Races - Native Hawaiian and Other Pacific Islander alone (% change since 2000)
Races - Two or more races(%)
Races - Two or more races(% change since 2000)
Races - Other race alone (%)
Races - Other race alone (% change since 2000)
Racial diversity
Place of birth - Born in state of residence (%)
Place of birth - Born in state of residence (%) - White
Place of birth - Born in state of residence (%) - Black or African American
Place of birth - Born in state of residence (%) - Asian
Place of birth - Born in state of residence (%) - Hispanic or Latino
Place of birth - Born in state of residence (%) - American Indian and Alaska Native
Place of birth - Born in state of residence (%) - Multirace
Place of birth - Born in state of residence (%) - Other Race
Place of birth - Born in other state (%)
Place of birth - Born in other state (%) - White
Place of birth - Born in other state (%) - Black or African American
Place of birth - Born in other state (%) - Asian
Place of birth - Born in other state (%) - Hispanic or Latino
Place of birth - Born in other state (%) - American Indian and Alaska Native
Place of birth - Born in other state (%) - Multirace
Place of birth - Born in other state (%) - Other Race
Place of birth - Native, outside of US (%)
Place of birth - Native, outside of US (%) - White
Place of birth - Native, outside of US (%) - Black or African American
Place of birth - Native, outside of US (%) - Asian
Place of birth - Native, outside of US (%) - Hispanic or Latino
Place of birth - Native, outside of US (%) - American Indian and Alaska Native
Place of birth - Native, outside of US (%) - Multirace
Place of birth - Native, outside of US (%) - Other Race
Place of birth - Foreign born (%)
Place of birth - Foreign born (%) - White
Place of birth - Foreign born (%) - Black or African American
Place of birth - Foreign born (%) - Asian
Place of birth - Foreign born (%) - Hispanic or Latino
Place of birth - Foreign born (%) - American Indian and Alaska Native
Place of birth - Foreign born (%) - Multirace
Place of birth - Foreign born (%) - Other Race
Residents speaking English at home (%)
Residents speaking English at home - Born in the United States (%)
Residents speaking English at home - Native, born elsewhere (%)
Residents speaking English at home - Foreign born (%)
Residents speaking Spanish at home (%)
Residents speaking Spanish at home - Born in the United States (%)
Residents speaking Spanish at home - Native, born elsewhere (%)
Residents speaking Spanish at home - Foreign born (%)
Residents speaking other language at home (%)
Residents speaking other language at home - Born in the United States (%)
Residents speaking other language at home - Native, born elsewhere (%)
Residents speaking other language at home - Foreign born (%)
Marital status - Never married (%)
Marital status - Now married (%)
Marital status - Separated (%)
Marital status - Widowed (%)
Marital status - Divorced (%)
Ancestries Reported - Arab (%)
Ancestries Reported - Czech (%)
Ancestries Reported - Danish (%)
Ancestries Reported - Dutch (%)
Ancestries Reported - English (%)
Ancestries Reported - French (%)
Ancestries Reported - French Canadian (%)
Ancestries Reported - German (%)
Ancestries Reported - Greek (%)
Ancestries Reported - Hungarian (%)
Ancestries Reported - Irish (%)
Ancestries Reported - Italian (%)
Ancestries Reported - Lithuanian (%)
Ancestries Reported - Norwegian (%)
Ancestries Reported - Polish (%)
Ancestries Reported - Portuguese (%)
Ancestries Reported - Russian (%)
Ancestries Reported - Scotch-Irish (%)
Ancestries Reported - Scottish (%)
Ancestries Reported - Slovak (%)
Ancestries Reported - Subsaharan African (%)
Ancestries Reported - Swedish (%)
Ancestries Reported - Swiss (%)
Ancestries Reported - Ukrainian (%)
Ancestries Reported - United States (%)
Ancestries Reported - Welsh (%)
Ancestries Reported - West Indian (%)
Ancestries Reported - Other (%)
Geographical mobility - Same house 1 year ago (%)
Geographical mobility - Same house 1 year ago (%) - White
Geographical mobility - Same house 1 year ago (%) - Black or African American
Geographical mobility - Same house 1 year ago (%) - Asian
Geographical mobility - Same house 1 year ago (%) - Hispanic or Latino
Geographical mobility - Same house 1 year ago (%) - American Indian and Alaska Native
Geographical mobility - Same house 1 year ago (%) - Multirace
Geographical mobility - Same house 1 year ago (%) - Other Race
Geographical mobility - Moved within same county (%)
Geographical mobility - Moved within same county (%) - White
Geographical mobility - Moved within same county (%) - Black or African American
Geographical mobility - Moved within same county (%) - Asian
Geographical mobility - Moved within same county (%) - Hispanic or Latino
Geographical mobility - Moved within same county (%) - American Indian and Alaska Native
Geographical mobility - Moved within same county (%) - Multirace
Geographical mobility - Moved within same county (%) - Other Race
Geographical mobility - Moved from different county within same state (%)
Geographical mobility - Moved from different county within same state (%) - White
Geographical mobility - Moved from different county within same state (%) - Black or African American
Geographical mobility - Moved from different county within same state (%) - Asian
Geographical mobility - Moved from different county within same state (%) - Hispanic or Latino
Geographical mobility - Moved from different county within same state (%) - American Indian and Alaska Native
Geographical mobility - Moved from different county within same state (%) - Multirace
Geographical mobility - Moved from different county within same state (%) - Other Race
Geographical mobility - Moved from different state (%)
Geographical mobility - Moved from different state (%) - White
Geographical mobility - Moved from different state (%) - Black or African American
Geographical mobility - Moved from different state (%) - Asian
Geographical mobility - Moved from different state (%) - Hispanic or Latino
Geographical mobility - Moved from different state (%) - American Indian and Alaska Native
Geographical mobility - Moved from different state (%) - Multirace
Geographical mobility - Moved from different state (%) - Other Race
Geographical mobility - Moved from abroad (%)
Geographical mobility - Moved from abroad (%) - White
Geographical mobility - Moved from abroad (%) - Black or African American
Geographical mobility - Moved from abroad (%) - Asian
Geographical mobility - Moved from abroad (%) - Hispanic or Latino
Geographical mobility - Moved from abroad (%) - American Indian and Alaska Native
Geographical mobility - Moved from abroad (%) - Multirace
Geographical mobility - Moved from abroad (%) - Other Race
Place of birth for the foreign-born population - Ireland (%)
Place of birth for the foreign-born population - Denmark (%)
Place of birth for the foreign-born population - Norway (%)
Place of birth for the foreign-born population - Sweden (%)
Place of birth for the foreign-born population - United Kingdom (%)
Place of birth for the foreign-born population - England (%)
Place of birth for the foreign-born population - Scotland (%)
Place of birth for the foreign-born population - Other Northern Europe (%)
Place of birth for the foreign-born population - Austria (%)
Place of birth for the foreign-born population - Belgium (%)
Place of birth for the foreign-born population - France (%)
Place of birth for the foreign-born population - Germany (%)
Place of birth for the foreign-born population - Netherlands (%)
Place of birth for the foreign-born population - Switzerland (%)
Place of birth for the foreign-born population - Other Western Europe (%)
Place of birth for the foreign-born population - Greece (%)
Place of birth for the foreign-born population - Italy (%)
Place of birth for the foreign-born population - Portugal (%)
Place of birth for the foreign-born population - Spain (%)
Place of birth for the foreign-born population - Other Southern Europe (%)
Place of birth for the foreign-born population - Albania (%)
Place of birth for the foreign-born population - Belarus (%)
Place of birth for the foreign-born population - Bosnia and Herzegovina (%)
Place of birth for the foreign-born population - Bulgaria (%)
Place of birth for the foreign-born population - Croatia (%)
Place of birth for the foreign-born population - Czechoslovakia (%)
Place of birth for the foreign-born population - Hungary (%)
Place of birth for the foreign-born population - Latvia (%)
Place of birth for the foreign-born population - Lithuania (%)
Place of birth for the foreign-born population - North Macedonia (Macedonia) (%)
Place of birth for the foreign-born population - Moldova (%)
Place of birth for the foreign-born population - Poland (%)
Place of birth for the foreign-born population - Romania (%)
Place of birth for the foreign-born population - Russia (%)
Place of birth for the foreign-born population - Serbia (%)
Place of birth for the foreign-born population - Ukraine (%)
Place of birth for the foreign-born population - Other Eastern Europe (%)
Place of birth for the foreign-born population - China (%)
Place of birth for the foreign-born population - Hong Kong (%)
Place of birth for the foreign-born population - Taiwan (%)
Place of birth for the foreign-born population - Japan (%)
Place of birth for the foreign-born population - Korea (%)
Place of birth for the foreign-born population - Other Eastern Asia (%)
Place of birth for the foreign-born population - Afghanistan (%)
Place of birth for the foreign-born population - Bangladesh (%)
Place of birth for the foreign-born population - India (%)
Place of birth for the foreign-born population - Iran (%)
Place of birth for the foreign-born population - Kazakhstan (%)
Place of birth for the foreign-born population - Nepal (%)
Place of birth for the foreign-born population - Pakistan (%)
Place of birth for the foreign-born population - Sri Lanka (%)
Place of birth for the foreign-born population - Uzbekistan (%)
Place of birth for the foreign-born population - Other South Central Asia (%)
Place of birth for the foreign-born population - Burma (%)
Place of birth for the foreign-born population - Cambodia (%)
Place of birth for the foreign-born population - Indonesia (%)
Place of birth for the foreign-born population - Laos (%)
Place of birth for the foreign-born population - Malaysia (%)
Place of birth for the foreign-born population - Philippines (%)
Place of birth for the foreign-born population - Singapore (%)
Place of birth for the foreign-born population - Thailand (%)
Place of birth for the foreign-born population - Vietnam (%)
Place of birth for the foreign-born population - Other South Eastern Asia (%)
Place of birth for the foreign-born population - Armenia (%)
Place of birth for the foreign-born population - Iraq (%)
Place of birth for the foreign-born population - Israel (%)
Place of birth for the foreign-born population - Jordan (%)
Place of birth for the foreign-born population - Kuwait (%)
Place of birth for the foreign-born population - Lebanon (%)
Place of birth for the foreign-born population - Saudi Arabia (%)
Place of birth for the foreign-born population - Syria (%)
Place of birth for the foreign-born population - Turkey (%)
Place of birth for the foreign-born population - Yemen (%)
Place of birth for the foreign-born population - Other Western Asia (%)
Place of birth for the foreign-born population - Eritrea (%)
Place of birth for the foreign-born population - Ethiopia (%)
Place of birth for the foreign-born population - Kenya (%)
Place of birth for the foreign-born population - Somalia (%)
Place of birth for the foreign-born population - Uganda (%)
Place of birth for the foreign-born population - Zimbabwe (%)
Place of birth for the foreign-born population - Other Eastern Africa (%)
Place of birth for the foreign-born population - Cameroon (%)
Place of birth for the foreign-born population - Congo (%)
Place of birth for the foreign-born population - Democratic Republic of Congo (Zaire) (%)
Place of birth for the foreign-born population - Other Middle Africa (%)
Place of birth for the foreign-born population - Egypt (%)
Place of birth for the foreign-born population - Morocco (%)
Place of birth for the foreign-born population - Sudan (%)
Place of birth for the foreign-born population - Other Northern Africa (%)
Place of birth for the foreign-born population - South Africa (%)
Place of birth for the foreign-born population - Other Southern Africa (%)
Place of birth for the foreign-born population - Cabo Verde (%)
Place of birth for the foreign-born population - Ghana (%)
Place of birth for the foreign-born population - Liberia (%)
Place of birth for the foreign-born population - Nigeria (%)
Place of birth for the foreign-born population - Senegal (%)
Place of birth for the foreign-born population - Sierra Leone (%)
Place of birth for the foreign-born population - Other Western Africa (%)
Place of birth for the foreign-born population - Australia (%)
Place of birth for the foreign-born population - New Zealand (%)
Place of birth for the foreign-born population - Fiji (%)
Place of birth for the foreign-born population - Micronesia (%)
Place of birth for the foreign-born population - Bahamas (%)
Place of birth for the foreign-born population - Barbados (%)
Place of birth for the foreign-born population - Cuba (%)
Place of birth for the foreign-born population - Dominica (%)
Place of birth for the foreign-born population - Dominican Republic (%)
Place of birth for the foreign-born population - Grenada (%)
Place of birth for the foreign-born population - Haiti (%)
Place of birth for the foreign-born population - Jamaica (%)
Place of birth for the foreign-born population - St. Vincent and the Grenadines (%)
Place of birth for the foreign-born population - Trinidad and Tobago (%)
Place of birth for the foreign-born population - West Indies (%)
Place of birth for the foreign-born population - Other Caribbean (%)
Place of birth for the foreign-born population - Belize (%)
Place of birth for the foreign-born population - Costa Rica (%)
Place of birth for the foreign-born population - El Salvador (%)
Place of birth for the foreign-born population - Guatemala (%)
Place of birth for the foreign-born population - Honduras (%)
Place of birth for the foreign-born population - Mexico (%)
Place of birth for the foreign-born population - Nicaragua (%)
Place of birth for the foreign-born population - Panama (%)
Place of birth for the foreign-born population - Other Central America (%)
Place of birth for the foreign-born population - Argentina (%)
Place of birth for the foreign-born population - Bolivia (%)
Place of birth for the foreign-born population - Brazil (%)
Place of birth for the foreign-born population - Chile (%)
Place of birth for the foreign-born population - Colombia (%)
Place of birth for the foreign-born population - Ecuador (%)
Place of birth for the foreign-born population - Guyana (%)
Place of birth for the foreign-born population - Peru (%)
Place of birth for the foreign-born population - Uruguay (%)
Place of birth for the foreign-born population - Venezuela (%)
Place of birth for the foreign-born population - Other South America (%)
Place of birth for the foreign-born population - Canada (%)
Place of birth for the foreign-born population - Other Northern America (%)
Place of birth for the foreign-born population - Other (%)
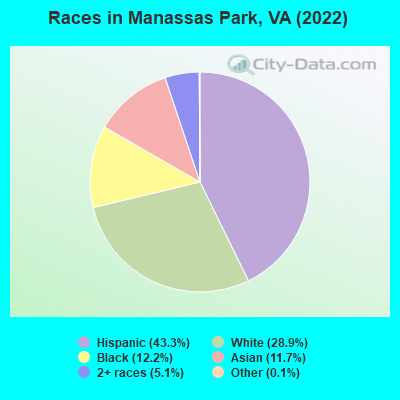
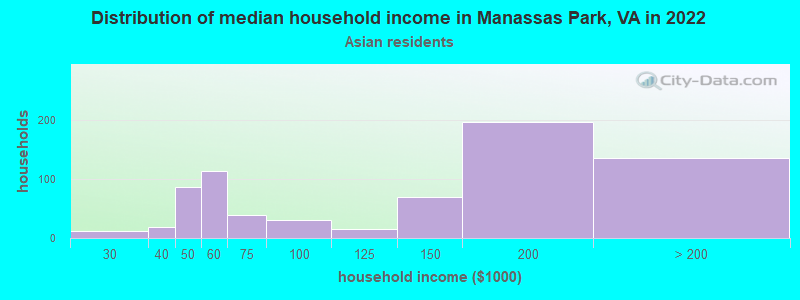
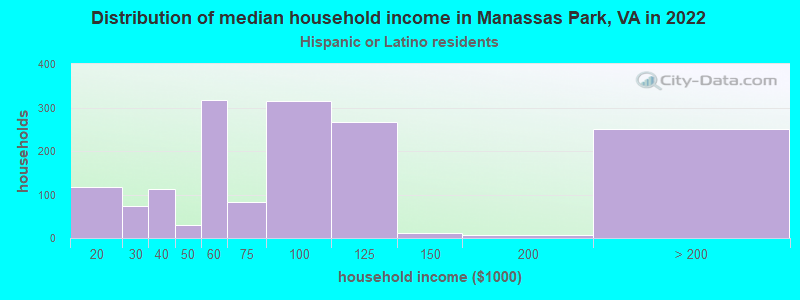
According to 2022 data, the most numerous races in Manassas Park, VA are White alone (5,003 residents), Black alone (2,117 residents), and Hispanic (7,497 residents). 47.7% of Manassas Park residents speak English at home. 36.6% of Manassas Park, VA residents are foreign-born (23.3% born in Latin America, 10.5% born in Asia), which is 67.2% greater than the foreign-born rate of 12.0% across the entire state of Virginia.
Race distribution in Manassas Park
2000 2022
4,965,637 70.2% White alone 1,376,378 19.4% Black alone 329,540 4.7% Hispanic 259,277 3.7% Asian alone 114,022 1.6% Two or more races 18,596 0.3% American Indian alone 11,685 0.2% Other race alone 3,380 0.05% Native Hawaiian and Other
5,095,130 58.7% White alone 1,594,785 18.4% Black alone 905,750 10.4% Hispanic 602,881 6.9% Asian alone 406,047 4.7% Two or more races 60,419 0.7% Other race alone 11,738 0.1% American Indian alone 6,869 0.08% Native Hawaiian and Other
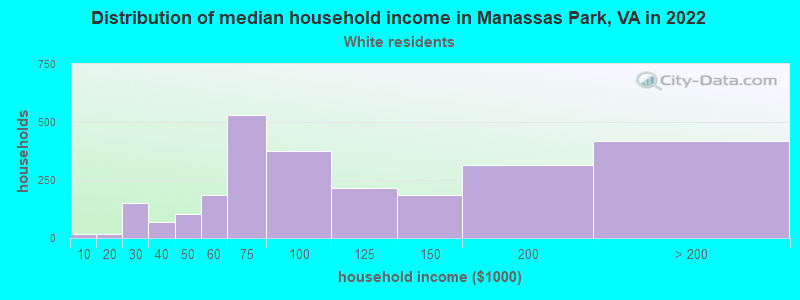
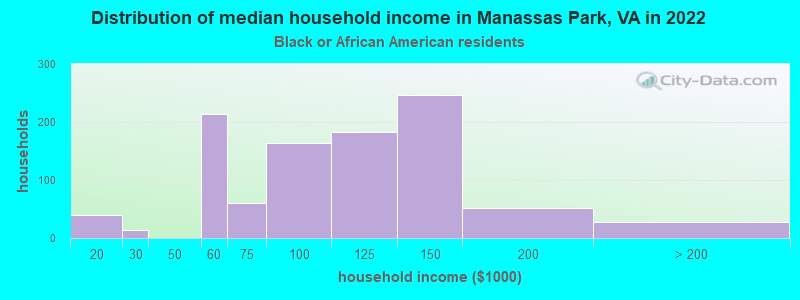
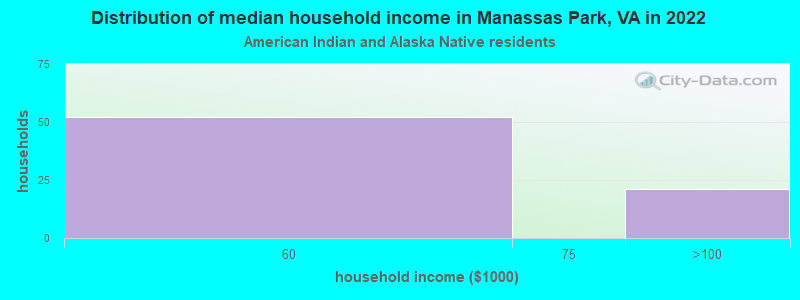
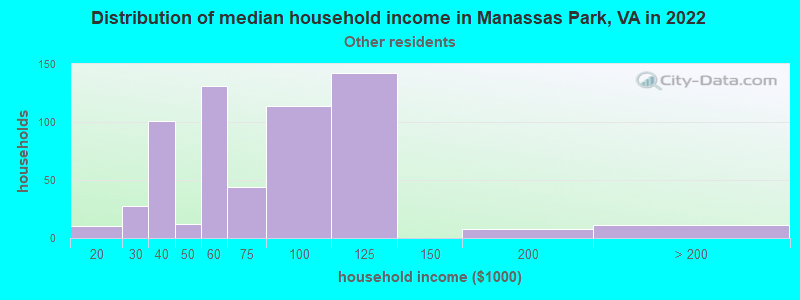
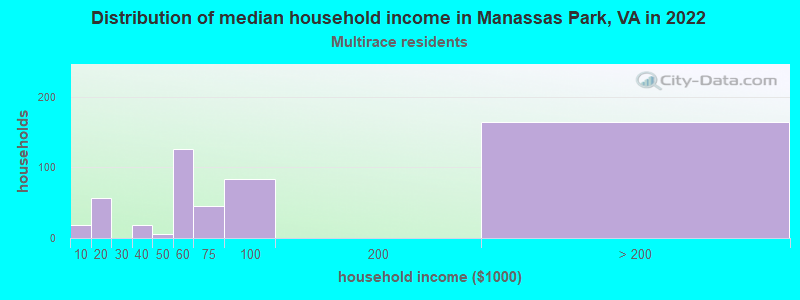
Income and house value in Manassas Park Median household income in 2022 $90,247 White non-Hispanic householders$100,368 Black householders$58,532 American Indian and Alaska Native householders$154,951 Asian householders$77,773 Some other race householders$63,694 Two or more races householders$82,246 Hispanic or Latino race householdersMedian 2022 house value $396,593 White Non-Hispanic householders$500,960 Black or African American householders$407,030 American Indian or Alaska Native householders $629,331 Asian householders$384,069 Some other race householders$404,595 Two or more races householders$389,288 Hispanic or Latino householders
Median age by race in Manassas Park
38.7 Median age for White residents40.0 38.3 36.8 Median age for Black or African American residents37.3 33.5 19.5 Median age for American Indian / Alaska Native residents35.3 17.9 47.1 Median age for Asian residents47.0 48.4 -611,955,419.9 Median age for Native Hawaiian / Pacific Islander residents-541,531,822.5 -714,150,046.8 30.9 Median age for Other race residents33.7 32.6 25.1 Median age for Two or more races residents37.0 24.5 40.0 Median age for White alone residents42.9 37.9 30.2 Median age for Hispanic or Latino residents32.5 27.0
Owner/renter occupied households by race in Manassas Park
House owners and renters - White residents 1,565 63.0% Owner occupied918 37.0% Renter occupiedHouse owners and renters - Black or African American residents 562 58.1% Owner occupied405 41.9% Renter occupiedHouse owners and renters - American Indian / Alaska Native residents 54 70.3% Owner occupied23 29.7% Renter occupiedHouse owners and renters - Asian residents 500 69.0% Owner occupied224 31.0% Renter occupiedHouse owners and renters - Other race residents 374 54.9% Owner occupied307 45.1% Renter occupiedHouse owners and renters - Two or more races residents 369 73.2% Owner occupied135 26.8% Renter occupiedHouse owners and renters - White alone residents 1,351 64.5% Owner occupied743 35.5% Renter occupiedHouse owners and renters - Hispanic or Latino residents 955 59.7% Owner occupied644 40.3% Renter occupied
Language usage in Manassas Park
English speakers - Total 47.7% of residents of Manassas Park speak English at home.
34.9% of residents speak Spanish at home 3,187 56.5% Speak English very well2,452 43.5% Speak English less than very well17.4% of residents speak other language at home 1,505 53.3% Speak English very well1,316 46.7% Speak English less than very well
English speakers - Born in the United States 88.5% of residents of Manassas Park speak English at home.
8.8% of residents speak Spanish at home 252 73.3% Speak English very well92 26.7% Speak English less than very well3.2% of residents speak other language at home 127 100.0% Speak English very well
English speakers - Native, born elsewhere 67.3% of residents of Manassas Park speak English at home.
25.9% of residents speak Spanish at home 137 85.6% Speak English very well23 14.4% Speak English less than very well
English speakers - Foreign-born 5.6% of residents of Manassas Park speak English at home.
57.3% of residents speak Spanish at home 1,196 35.3% Speak English very well2,196 64.7% Speak English less than very well38.0% of residents speak other language at home 1,068 47.4% Speak English very well1,183 52.6% Speak English less than very well
White (Caucasian) - Speak only English Native:
81.8% (4,104)Foreign-born:
2.6% (26)
White (Caucasian) - Speak another language Native:
14.1% (709)Foreign-born:
96.2% (953)
Black or African American - Speak only English Native:
95.3% (1,859)Foreign-born:
7.0% (25)
Black or African American - Speak another language Native:
4.6% (90)Foreign-born:
98.1% (345)
American Indian / Alaska Native - Speak only English Native:
11.4% (35)Foreign-born:
9.6% (27)
American Indian / Alaska Native - Speak another language Native:
83.3% (253)Foreign-born:
79.6% (226)
Asian - Speak only English Native:
52.1% (277)Foreign-born:
6.2% (91)
Asian - Speak another language Native:
42.3% (225)Foreign-born:
93.9% (1,375)
Other race - Speak only English Native:
11.0% (121)Foreign-born:
13.7% (240)
Other race - Speak another language Native:
89.3% (982)Foreign-born:
88.0% (1,545)
Two or more races - Speak only English Native:
72.1% (1,047)Foreign-born:
2.6% (29)
Two or more races - Speak another language Native:
26.7% (388)Foreign-born:
96.2% (1,068)
White alone - Speak another language Native:
6.5% (275)Foreign-born:
100.0% (493)
Hispanic or Latino - Speak only English Native:
30.3% (965)Foreign-born:
10.0% (372)
Hispanic or Latino - Speak another language Native:
69.1% (2,201)Foreign-born:
90.6% (3,386)
Foreign-born residents in Manassas Park 6,346 residents are foreign born (23.3% Latin America , 10.5% Asia ).
This city:
36.6%Virginia:
12.6%
Marital status for residents in Manassas Park Marital status - White (Caucasian) population 15 years and over
Males 36.5% Never married46.0% Now married4.4% Separated3.7% Widowed9.4% DivorcedFemales 38.8% Never married37.3% Now married4.2% Separated5.9% Widowed13.8% DivorcedWomen who gave birth in the past 12 months Now married:
100.0% (19)Unmarried:
0.0% (0)
Women who did not give birth in the past 12 months Now married:
38.6% (606)Unmarried:
61.4% (963)
Marital status - Black or African American population 15 years and over
Males 37.0% Never married36.2% Now married5.3% Separated0.0% Widowed21.4% DivorcedFemales 40.6% Never married25.6% Now married0.0% Separated6.4% Widowed27.4% DivorcedWomen who did not give birth in the past 12 months Now married:
19.5% (91)Unmarried:
80.5% (377)
Marital status - American Indian / Alaska Native population 15 years and over
Males 0.0% Never married0.0% Now married0.0% Separated0.0% Widowed100.0% DivorcedFemales 75.5% Never married0.0% Now married5.8% Separated11.6% Widowed7.1% DivorcedWomen who did not give birth in the past 12 months Now married:
7.1% (15)Unmarried:
92.9% (194)
Marital status - Asian population 15 years and over
Males 31.2% Never married67.3% Now married0.0% Separated0.0% Widowed1.6% DivorcedFemales 37.8% Never married49.8% Now married0.0% Separated12.4% Widowed0.0% DivorcedWomen who did not give birth in the past 12 months Now married:
36.1% (184)Unmarried:
63.9% (326)
Marital status - Other race population 15 years and over
Males 40.7% Never married57.0% Now married0.0% Separated0.0% Widowed2.3% DivorcedFemales 41.1% Never married40.8% Now married10.8% Separated5.2% Widowed2.1% DivorcedWomen who gave birth in the past 12 months Now married:
100.0% (9)Unmarried:
0.0% (0)
Women who did not give birth in the past 12 months Now married:
45.3% (295)Unmarried:
54.7% (356)
Marital status - Two or more races population 15 years and over
Males 42.8% Never married57.2% Now married0.0% Separated0.0% Widowed0.0% DivorcedFemales 49.4% Never married38.7% Now married2.3% Separated0.0% Widowed9.5% DivorcedWomen who gave birth in the past 12 months Now married:
100.0% (74)Unmarried:
0.0% (0)
Women who did not give birth in the past 12 months Now married:
37.5% (393)Unmarried:
62.5% (656)
Marital status - White alone, not Hispanic / Latino population 15 years and over
Males 28.0% Never married53.0% Now married3.3% Separated5.7% Widowed9.9% DivorcedFemales 29.0% Never married44.9% Now married0.9% Separated8.4% Widowed16.7% DivorcedWomen who did not give birth in the past 12 months Now married:
50.6% (588)Unmarried:
49.4% (575)
Marital status - Hispanic or Latino population 15 years and over
Males 45.0% Never married44.3% Now married2.7% Separated0.0% Widowed8.1% DivorcedFemales 50.5% Never married31.5% Now married8.4% Separated2.7% Widowed6.9% DivorcedWomen who gave birth in the past 12 months Now married:
100.0% (31)Unmarried:
0.0% (0)
Women who did not give birth in the past 12 months Now married:
34.8% (656)Unmarried:
65.2% (1,231)
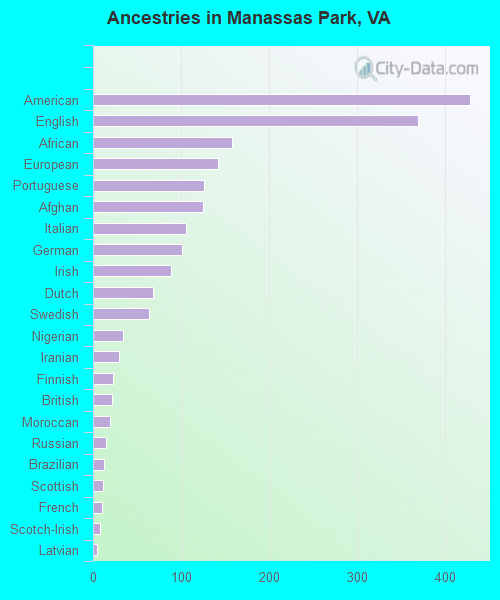
Ancestries in Manassas Park
428 4.2% American369 3.6% English158 1.6% African142 1.4% European126 1.2% Portuguese125 1.2% Afghan105 1.0% Italian101 1.0% German89 0.9% Irish68 0.7% Dutch63 0.6% Swedish34 0.3% Nigerian30 0.3% Iranian23 0.2% Finnish21 0.2% British19 0.2% Moroccan15 0.1% Russian12 0.1% Brazilian11 0.1% Scottish10 0.10% French8 0.08% Scotch-Irish4 0.04% Latvian
Geographical mobility in Manassas Park Same house 1 year ago 5,746 86.5% White (Caucasian)2,371 94.5% Black or African American286 47.7% American Indian / Alaska Native1,781 88.1% Asian3,007 91.1% Other race2,425 88.6% Two or more races4,382 87.8% White alone, not Hispanic / Latino6,322 84.3% Hispanic or LatinoMoved within same county 7 0.1% White / Caucasian55 2.2% Black or African American7 0.2% Other race17 0.6% Two or more races8 0.2% White alone, not Hispanic / Latino19 0.3% Hispanic or LatinoMoved within same state 732 11.0% White / Caucasian22 0.9% Black or African American285 47.5% American Indian / Alaska Native194 9.6% Asian152 4.6% Other race192 7.0% Two or more races476 9.5% White alone, not Hispanic / Latino1,253 16.7% Hispanic or LatinoMoved from different state 243 3.7% White / Caucasian83 3.3% Black or African American11 0.5% Asian33 1.0% Other race83 3.0% Two or more races158 3.2% White alone, not Hispanic / Latino214 2.8% Hispanic or LatinoMoved from abroad 28 0.8% Other race27 1.0% Two or more races39 0.5% Hispanic or Latino
Children Nativity (place of birth) in Manassas Park
Children under 6 years - Living with two parents Both parents native 245 99.5% Native1 0.5% Foreign-bornBoth parents foreign-born 441 85.2% Native76 14.8% Foreign-bornChildren under 6 years - Living with one parent Native parent 199 100.0% NativeForeign-born parent 61 27.1% Native163 72.9% Foreign-bornChildren 6 to 17 years - Living with two parents Both parents native 506 100.0% NativeBoth parents foreign-born 907 71.2% Native368 28.8% Foreign-bornChildren 6 to 17 years - Living with one parent Native parent 326 100.0% NativeForeign-born parent 638 53.6% Native553 46.4% Foreign-born
Grandparents responsible for own grandchildren in Manassas Park
Grandparents (30 to 59 years) White / Caucasian 13 9.6% Responsible for grandchildren120 90.4% Not responsible for grandchildrenAmerican Indian / Alaska Native 16 100.0% Responsible for grandchildrenOther race 132 75.7% Responsible for grandchildren42 24.3% Not responsible for grandchildrenWhite alone, not Hispanic / Latino 64 100.0% Not responsible for grandchildrenHispanic or Latino 164 62.4% Responsible for grandchildren99 37.6% Not responsible for grandchildrenGrandparents (60 years and over) White / Caucasian 128 62.0% Responsible for grandchildren79 38.0% Not responsible for grandchildrenOther race 67 100.0% Not responsible for grandchildrenWhite alone, not Hispanic / Latino 126 61.1% Responsible for grandchildren80 38.9% Not responsible for grandchildrenHispanic or Latino 18 25.9% Responsible for grandchildren51 74.1% Not responsible for grandchildren